OPEN-SOURCE SCRIPT
Institutional Retail Trap PRO
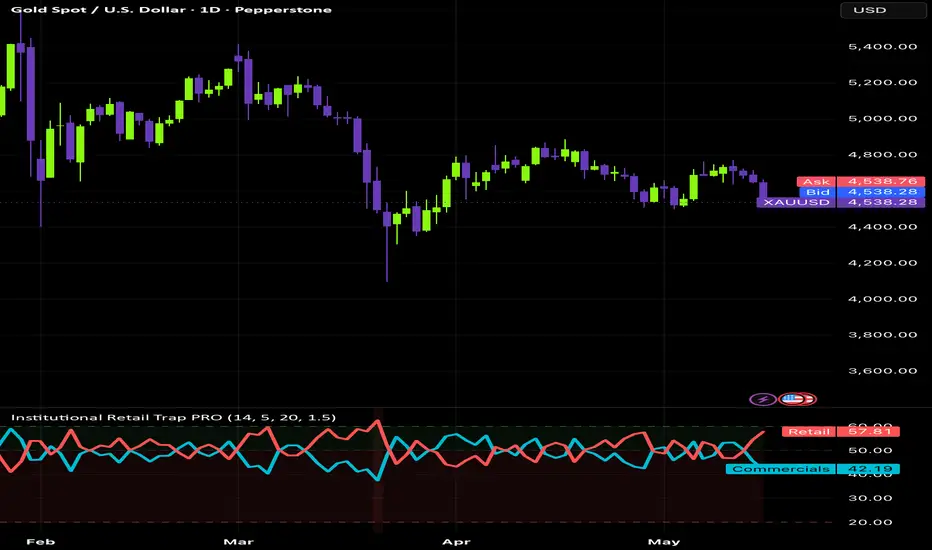
Description:
Institutional Retail Trap PRO is an advanced order flow indicator designed to identify the behavioral difference between institutional ("smart money") participants and retail traders — and more importantly, to detect when retail traders are caught on the wrong side of the market.
Unlike standard momentum indicators, this tool weights price movement against relative volume and candle displacement to estimate who is actually driving price at any given moment.
How it works:
The indicator calculates buy and sell pressure based on where price closes within each candle's range, then scales that pressure by relative volume (current volume vs. average volume). This creates a raw flow signal that is split into two streams — one representing institutional activity and one representing retail activity — both normalized using RSI to produce clear, readable oscillator lines.
The two lines:
Aqua line (Commercials / Smart Money) — rises when volume-weighted buying pressure dominates, suggesting institutional accumulation or aggressive buying
Red line (Retail Traders) — the inverse, rising when retail-style selling or chasing behavior dominates
Key levels:
Above 60 — dominant zone, one side is in control
50 — equilibrium, no clear dominance
Below 20 — exhaustion zone, the dominant flow is fading
Signals:
Lime circle (Smart Money Entry) — smart money line crosses above retail line while still in low territory, suggesting institutional accumulation beginning
Orange circle (Smart Money Exit) — smart money line crosses below retail line from high territory, suggesting distribution
Red triangle down (Retail Long Trap) — retail is overextended long while smart money is weak and price closes bearish with displacement — classic bull trap setup
Aqua triangle up (Retail Short Trap) — retail is overextended short while smart money is strong and price closes bullish with displacement — classic bear trap setup
Background shading:
Green background — smart money in dominant zone
Red background — retail flow dominant, potential exhaustion or reversal ahead
Displacement filter:
A built-in displacement filter ensures signals only trigger when the candle body exceeds the average range by a configurable multiplier. This filters out low-conviction signals during choppy, low-momentum periods.
Best used with:
Price action context, key support and resistance levels, volume profile, and multi-timeframe analysis. Works on all liquid markets — indices (ES, NQ, DAX), forex majors, gold (XAUUSD), and high-volume crypto pairs. Most effective on the 1m, 3m, 5m, and 15m timeframes for intraday trading.
Settings:
Flow Length — RSI normalization period (default 14)
Flow Smoothing — EMA smoothing on the raw flow signal (default 5)
Volume Average — baseline volume period for relative volume calculation (default 20)
Displacement Strength — multiplier for the candle body displacement filter (default 1.5)
Show Trap Signals — toggle all signals on/off
Show Zones — toggle zone fills on/off
Background Coloring — toggle background shading on/off
Note:
This indicator does not use real-time order book or Level 2 data. Institutional flow is estimated using price-volume analysis relative to recent averages. Always use in confluence with other tools and proper risk management. Past signals do not guarantee future results.
Institutional Retail Trap PRO is an advanced order flow indicator designed to identify the behavioral difference between institutional ("smart money") participants and retail traders — and more importantly, to detect when retail traders are caught on the wrong side of the market.
Unlike standard momentum indicators, this tool weights price movement against relative volume and candle displacement to estimate who is actually driving price at any given moment.
How it works:
The indicator calculates buy and sell pressure based on where price closes within each candle's range, then scales that pressure by relative volume (current volume vs. average volume). This creates a raw flow signal that is split into two streams — one representing institutional activity and one representing retail activity — both normalized using RSI to produce clear, readable oscillator lines.
The two lines:
Aqua line (Commercials / Smart Money) — rises when volume-weighted buying pressure dominates, suggesting institutional accumulation or aggressive buying
Red line (Retail Traders) — the inverse, rising when retail-style selling or chasing behavior dominates
Key levels:
Above 60 — dominant zone, one side is in control
50 — equilibrium, no clear dominance
Below 20 — exhaustion zone, the dominant flow is fading
Signals:
Lime circle (Smart Money Entry) — smart money line crosses above retail line while still in low territory, suggesting institutional accumulation beginning
Orange circle (Smart Money Exit) — smart money line crosses below retail line from high territory, suggesting distribution
Red triangle down (Retail Long Trap) — retail is overextended long while smart money is weak and price closes bearish with displacement — classic bull trap setup
Aqua triangle up (Retail Short Trap) — retail is overextended short while smart money is strong and price closes bullish with displacement — classic bear trap setup
Background shading:
Green background — smart money in dominant zone
Red background — retail flow dominant, potential exhaustion or reversal ahead
Displacement filter:
A built-in displacement filter ensures signals only trigger when the candle body exceeds the average range by a configurable multiplier. This filters out low-conviction signals during choppy, low-momentum periods.
Best used with:
Price action context, key support and resistance levels, volume profile, and multi-timeframe analysis. Works on all liquid markets — indices (ES, NQ, DAX), forex majors, gold (XAUUSD), and high-volume crypto pairs. Most effective on the 1m, 3m, 5m, and 15m timeframes for intraday trading.
Settings:
Flow Length — RSI normalization period (default 14)
Flow Smoothing — EMA smoothing on the raw flow signal (default 5)
Volume Average — baseline volume period for relative volume calculation (default 20)
Displacement Strength — multiplier for the candle body displacement filter (default 1.5)
Show Trap Signals — toggle all signals on/off
Show Zones — toggle zone fills on/off
Background Coloring — toggle background shading on/off
Note:
This indicator does not use real-time order book or Level 2 data. Institutional flow is estimated using price-volume analysis relative to recent averages. Always use in confluence with other tools and proper risk management. Past signals do not guarantee future results.
开源脚本
秉承TradingView的精神,该脚本的作者将其开源,以便交易者可以查看和验证其功能。向作者致敬!您可以免费使用该脚本,但请记住,重新发布代码须遵守我们的网站规则。

免责声明
这些信息和出版物并非旨在提供,也不构成TradingView提供或认可的任何形式的财务、投资、交易或其他类型的建议或推荐。请阅读使用条款了解更多信息。
免责声明
这些信息和出版物并非旨在提供,也不构成TradingView提供或认可的任何形式的财务、投资、交易或其他类型的建议或推荐。请阅读使用条款了解更多信息。