OPEN-SOURCE SCRIPT
SupOsc + SSL + Willy Signals
What It Does
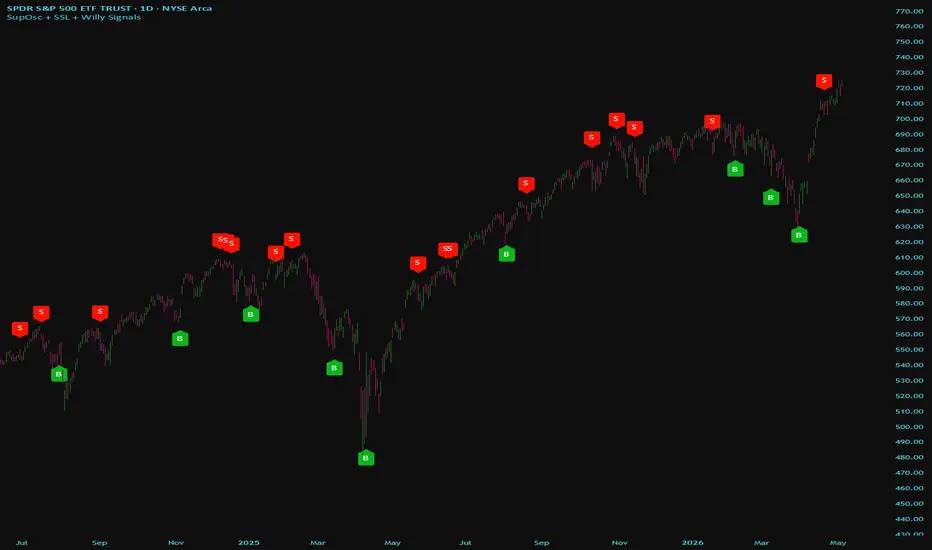
This is a confluence signal indicator that combines three separate technical indicators and only fires a buy or sell signal when all three agree simultaneously. The idea is to reduce false signals by requiring multiple independent conditions to align before triggering an entry. It plots simple B (buy) and S (sell) labels directly on your chart.
The Three Indicators
1. SuperTrend Oscillator (SupOsc)
A normalized oscillator built from a SuperTrend calculation. Rather than plotting the SuperTrend line itself, it measures how far price is from the SuperTrend bands and converts that into an oscillator value between -1 and +1. A smoothed EMA histogram runs underneath it. For signals, it watches for the oscillator crossing the -0.50 level upward (buy) or crossing the +0.50 level downward (sell). Think of it as a momentum/trend confirmation filter.
2. SSL Channel
A simple but effective trend direction tool that uses SMAs of the highs and lows to determine whether price is in a bullish or bearish regime. When the upper SSL line is above the lower line, it's bullish. When below, it's bearish. The signal requires SSL to be confirming the same direction as the SupOsc before anything fires.
3. Williams %R
A momentum oscillator that measures where price closed relative to its recent high-low range, on a scale of 0 to -100. The indicator checks the previous candle's Williams %R reading — requiring it to have been in oversold territory (below -80) for buys, or overbought territory (above -20) for sells. This acts as a pullback/exhaustion filter, helping you buy dips and sell rips rather than chasing.
Does It Repaint?
Largely no, but with one caveat to be aware of.
The SupOsc and Williams %R components are calculated purely on current timeframe bars using standard closed-bar data — no repainting there.
The SSL component uses request.security() with lookahead=barmerge.lookahead_off, which is the correct, repaint-safe setting. However, if you set the SSL Timeframe to a higher timeframe than your chart, the SSL values will only update when that higher timeframe bar closes — meaning mid-bar the value reflects the previous completed HTF bar, which is standard and expected behavior, not true repainting.
The Williams %R check also looks at wR[1] (the previous bar's value), which is already a closed bar — safe.
Bottom line: Signals that appear on a closed bar will not disappear or move. Signals on the current live bar could technically shift if conditions change before the bar closes, which is true of virtually any indicator.
Personally I find it works best for confirmations when combined with the CCI as seen in the image below.

This is a confluence signal indicator that combines three separate technical indicators and only fires a buy or sell signal when all three agree simultaneously. The idea is to reduce false signals by requiring multiple independent conditions to align before triggering an entry. It plots simple B (buy) and S (sell) labels directly on your chart.
The Three Indicators
1. SuperTrend Oscillator (SupOsc)
A normalized oscillator built from a SuperTrend calculation. Rather than plotting the SuperTrend line itself, it measures how far price is from the SuperTrend bands and converts that into an oscillator value between -1 and +1. A smoothed EMA histogram runs underneath it. For signals, it watches for the oscillator crossing the -0.50 level upward (buy) or crossing the +0.50 level downward (sell). Think of it as a momentum/trend confirmation filter.
2. SSL Channel
A simple but effective trend direction tool that uses SMAs of the highs and lows to determine whether price is in a bullish or bearish regime. When the upper SSL line is above the lower line, it's bullish. When below, it's bearish. The signal requires SSL to be confirming the same direction as the SupOsc before anything fires.
3. Williams %R
A momentum oscillator that measures where price closed relative to its recent high-low range, on a scale of 0 to -100. The indicator checks the previous candle's Williams %R reading — requiring it to have been in oversold territory (below -80) for buys, or overbought territory (above -20) for sells. This acts as a pullback/exhaustion filter, helping you buy dips and sell rips rather than chasing.
Does It Repaint?
Largely no, but with one caveat to be aware of.
The SupOsc and Williams %R components are calculated purely on current timeframe bars using standard closed-bar data — no repainting there.
The SSL component uses request.security() with lookahead=barmerge.lookahead_off, which is the correct, repaint-safe setting. However, if you set the SSL Timeframe to a higher timeframe than your chart, the SSL values will only update when that higher timeframe bar closes — meaning mid-bar the value reflects the previous completed HTF bar, which is standard and expected behavior, not true repainting.
The Williams %R check also looks at wR[1] (the previous bar's value), which is already a closed bar — safe.
Bottom line: Signals that appear on a closed bar will not disappear or move. Signals on the current live bar could technically shift if conditions change before the bar closes, which is true of virtually any indicator.
Personally I find it works best for confirmations when combined with the CCI as seen in the image below.
开源脚本
秉承TradingView的精神,该脚本的作者将其开源,以便交易者可以查看和验证其功能。向作者致敬!您可以免费使用该脚本,但请记住,重新发布代码须遵守我们的网站规则。

免责声明
这些信息和出版物并非旨在提供,也不构成TradingView提供或认可的任何形式的财务、投资、交易或其他类型的建议或推荐。请阅读使用条款了解更多信息。
开源脚本
秉承TradingView的精神,该脚本的作者将其开源,以便交易者可以查看和验证其功能。向作者致敬!您可以免费使用该脚本,但请记住,重新发布代码须遵守我们的网站规则。
免责声明
这些信息和出版物并非旨在提供,也不构成TradingView提供或认可的任何形式的财务、投资、交易或其他类型的建议或推荐。请阅读使用条款了解更多信息。