OPEN-SOURCE SCRIPT
已更新 ATR Regime Forecast + Persistence [Forex]
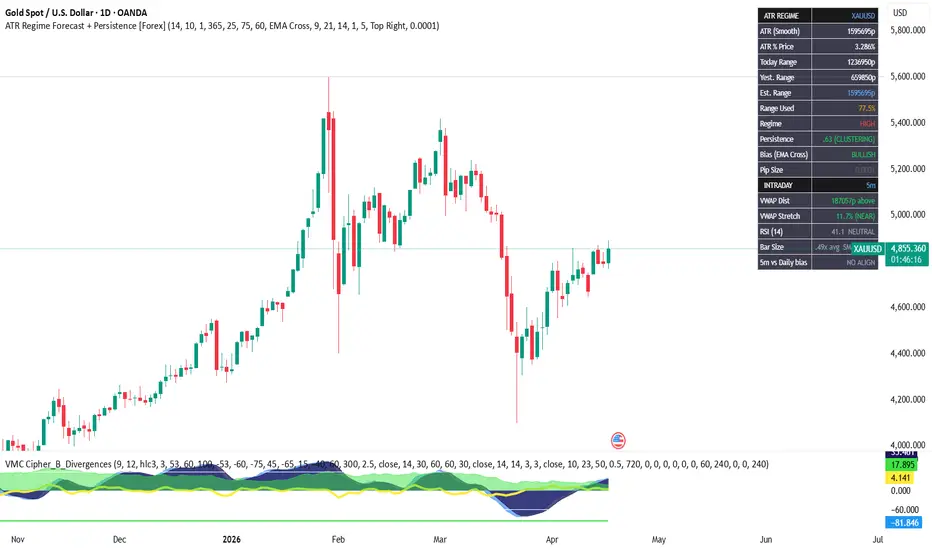
ATR Regime Forecast + Persistence [Forex]
Overview:
A volatility regime dashboard designed for Forex traders. All calculations are locked to the daily timeframe regardless of which chart you are on — load it on your 5m chart and the regime, ATR, and persistence readings remain consistent with the daily picture.
What it shows:
The table has two sections.
The daily section gives you the volatility regime (LOW / NORMAL / HIGH
based on historical percentiles), today's range vs the ATR-based estimate, yesterday's range, and a persistence reading that shows whether volatility is clustering or mean-reverting day to day.
The intraday section shows distance from VWAP, a VWAP stretch reading calibrated to the daily ATR, intraday RSI, and a single alignment signal that combines the intraday VWAP position with the daily bias.
Key fixes vs common ATR regime scripts:
All daily calculations run inside request.security() so they are truly timeframe-independent. The persistence correlation and regime percentile thresholds both run in daily context, not on chart bars. Yesterday's range is computed by fetching high[1] and low[1] separately before subtracting — not inside the security() call.
Settings:
Set Pip Size to 0.0001 for major pairs and 0.01 for JPY pairs. Set Intraday Timeframe to match your trading chart. All other defaults are suitable for standard Forex use.
How to use it:
Check Regime before trading. LOW is ideal for mean reversion, HIGH is a caution flag.
Watch Range Used % — above 80% means the day's statistical range is nearly exhausted, which is the core timing signal for fading intraday moves back toward VWAP.
Use the 5m vs Daily alignment row as a quick-glance directional filter before entry.
Overview:
A volatility regime dashboard designed for Forex traders. All calculations are locked to the daily timeframe regardless of which chart you are on — load it on your 5m chart and the regime, ATR, and persistence readings remain consistent with the daily picture.
What it shows:
The table has two sections.
The daily section gives you the volatility regime (LOW / NORMAL / HIGH
based on historical percentiles), today's range vs the ATR-based estimate, yesterday's range, and a persistence reading that shows whether volatility is clustering or mean-reverting day to day.
The intraday section shows distance from VWAP, a VWAP stretch reading calibrated to the daily ATR, intraday RSI, and a single alignment signal that combines the intraday VWAP position with the daily bias.
Key fixes vs common ATR regime scripts:
All daily calculations run inside request.security() so they are truly timeframe-independent. The persistence correlation and regime percentile thresholds both run in daily context, not on chart bars. Yesterday's range is computed by fetching high[1] and low[1] separately before subtracting — not inside the security() call.
Settings:
Set Pip Size to 0.0001 for major pairs and 0.01 for JPY pairs. Set Intraday Timeframe to match your trading chart. All other defaults are suitable for standard Forex use.
How to use it:
Check Regime before trading. LOW is ideal for mean reversion, HIGH is a caution flag.
Watch Range Used % — above 80% means the day's statistical range is nearly exhausted, which is the core timing signal for fading intraday moves back toward VWAP.
Use the 5m vs Daily alignment row as a quick-glance directional filter before entry.
版本注释
Update Summary (TradingView Script v2)Increased the regime lookback period, making volatility classification smoother and based on a longer historical window
Added regime transition detection using previous state tracking
Regime system now highlights shifts between LOW / NORMAL / HIGH states with “TRANSITION →” labels
Added alert condition for regime changes for automation and notifications
Improved state persistence so regime changes are correctly tracked across bars
No changes to ATR calculation, bias logic, intraday metrics, or table structure
版本注释
ATR Regime Forecast + Persistence Dashboard (Overview)Overview
The ATR Regime Forecast + Persistence Dashboard is a volatility intelligence system designed to provide a clear, structured read on daily market behaviour. It reduces market complexity into a compact set of statistically meaningful volatility metrics that can be used for context, planning, and risk awareness.
The indicator is built on a core principle from volatility research:
Volatility is not random — it clusters, regimes, and transitions between states.
This tool combines:
Daily ATR
Range behaviour
Volatility regimes
Persistence (volatility stability)
Directional bias
Regime transitions (state change detection)
to produce a unified volatility framework.
Core Components
1. ATR (Daily Volatility Baseline)
ATR is calculated on the Daily timeframe and forms the foundation of all volatility modelling.
Users can select:
Raw ATR (unfiltered volatility)
Smoothed ATR (reduced noise via smoothing)
ATR defines expected daily movement and anchors all forecasting logic.
2. Daily Range Behaviour
The dashboard tracks:
Current day range (high–low)
Previous day range
This provides immediate context on whether volatility is expanding or contracting relative to recent sessions.
3. Forecast Range
Volatility expectation is projected using:
ATR × Forecast Multiplier
This creates a practical expected range for daily movement based on current market conditions.
It is not predictive — it is a statistically grounded volatility envelope.
4. Volatility Regime Classification
Market conditions are classified into three regimes using ATR percentiles:
LOW → compressed volatility environment
NORMAL → balanced / typical conditions
HIGH → expanded volatility environment
This provides a macro-level view of market behaviour and risk state.
5. Regime Transitions (Structural Change Detection) — NEW
Beyond static classification, the system detects changes between regimes over time.
When volatility shifts from one state to another, the dashboard highlights:
TRANSITION → HIGH / NORMAL / LOW
This represents a change in market structure, such as:
Volatility expansion beginning
Volatility contraction initiating
Shift from ranging to trending conditions (or vice versa)
These transitions are often more important than the regime itself, as they signal regime instability or acceleration.
An alert condition is included to support automation or real-time notification workflows.
6. Persistence (Volatility Stability)
Persistence measures how stable volatility behaviour is over time using lagged correlation of daily ranges.
This acts as a quality filter for ATR reliability:
High persistence → stable volatility structure
Medium persistence → moderately stable conditions
Low persistence → unstable / noisy volatility
Persistence determines how trustworthy volatility-based expectations are.
7. Directional Bias
Directional bias evaluates structural market pressure using:
EMA relationship, or
Price vs VWAP, or
Open vs Close structure
Bias states:
Bullish
Bearish
Neutral
Bias is not a trade signal — it is a contextual filter for directional pressure within the volatility regime.
How to Use the Dashboard
Step 1 — Identify the Volatility Environment
Use:
ATR
Regime state
Daily range comparison
to determine whether the market is expanding, contracting, or stable.
Step 2 — Validate Volatility Quality
Use persistence as a reliability filter:
High persistence → ATR and regime signals are stable and reliable
Low persistence → expect irregular and unpredictable behaviour
Step 3 — Contextual Direction
Use directional bias to understand:
Whether volatility is aligned with bullish or bearish pressure
Whether conditions support continuation or exhaustion
Step 4 — Monitor Regime Transitions
Regime transitions provide early warnings of structural change:
Compression → expansion
Expansion → contraction
Market regime instability
These are often the earliest indication of changing trading conditions.
Why This Indicator Works
The system is built around three statistically robust market properties:
Volatility (ATR)
→ Defines expected movement
Regime Structure
→ Classifies market environment
Persistence
→ Measures reliability of volatility behaviour
With the addition of:
Regime transition detection
the model becomes a full volatility state framework rather than a static dashboard.
开源脚本
秉承TradingView的精神,该脚本的作者将其开源,以便交易者可以查看和验证其功能。向作者致敬!您可以免费使用该脚本,但请记住,重新发布代码须遵守我们的网站规则。

免责声明
这些信息和出版物并非旨在提供,也不构成TradingView提供或认可的任何形式的财务、投资、交易或其他类型的建议或推荐。请阅读使用条款了解更多信息。
开源脚本
秉承TradingView的精神,该脚本的作者将其开源,以便交易者可以查看和验证其功能。向作者致敬!您可以免费使用该脚本,但请记住,重新发布代码须遵守我们的网站规则。
免责声明
这些信息和出版物并非旨在提供,也不构成TradingView提供或认可的任何形式的财务、投资、交易或其他类型的建议或推荐。请阅读使用条款了解更多信息。