OPEN-SOURCE SCRIPT
Volume Profile + LVN
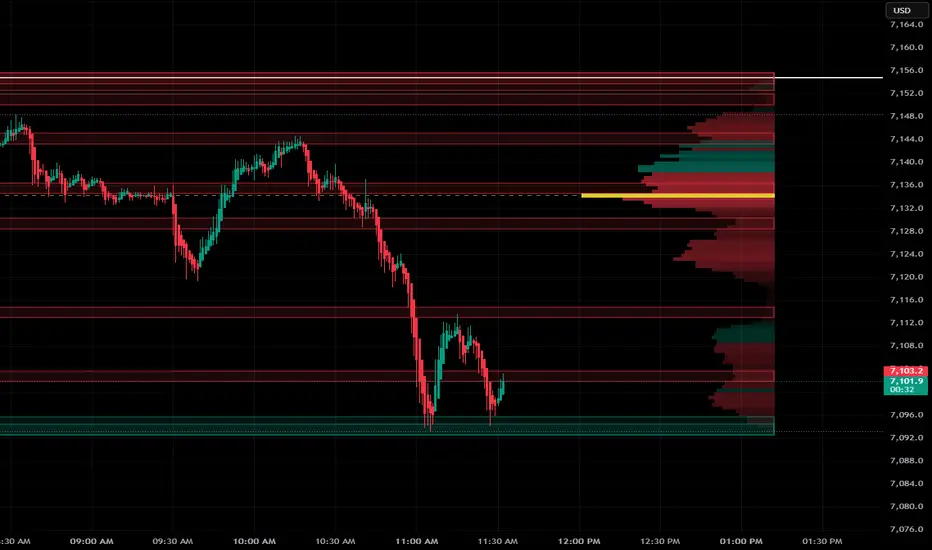
Volume Profile + Low Volume Nodes
A clean institutional-grade volume profile built for intraday traders. This indicator maps exactly where volume was traded across price levels during the session and automatically identifies the thin areas — the Low Volume Nodes — where price moves fast and institutions are likely to react.
What it does:
Volume Profile — displays a horizontal bar chart to the right of price showing how much volume traded at each price level. Green bars where buyers dominated, red bars where sellers dominated, yellow bar at the Point of Control — the single price level with the most volume traded.
Low Volume Nodes (LVN) — automatically detects the price zones where volume is significantly thinner than surrounding levels. These are the gaps in the market where price moved too fast for participants to trade much — creating imbalances that price tends to revisit and react to.
🟢 Green zones — LVN below current price = support. Price tends to bounce here or accelerate through on high volume.
🔴 Red zones — LVN above current price = resistance. Price tends to reject here or break through with momentum.
🟡 POC line — Point of Control extends left across the chart. The most important intraday reference level — price gravitates toward this level throughout the day.
How to use it:
When price approaches a green or red zone you have two scenarios — a bounce or a clean break.
Bounce — price touches the zone and closes back outside it. Look for a buy at green zones and a sell at red zones.
Break — price closes through the zone with volume. Trade the continuation in the direction of the break — buy above a broken red zone, sell below a broken green zone.
The thinner the zone the faster price will move through it. The POC acts as a magnet — if price is far from it expect it to get pulled back during the session.
Settings:
Profile Mode — Session resets each day for intraday use. Lookback uses a fixed bar count
Node Detection % — Controls how sensitive the LVN detection is. Higher finds more zones
Max LVN Nodes — Maximum number of zones shown — always displays the closest ones to current price
Zone Expand — Makes each zone slightly thicker to capture neighboring thin levels
Profile Offset — Controls the space between price and the profile
session mode - best for 1-5 minute timeframe
lookback mode - best for higher timeframe
A clean institutional-grade volume profile built for intraday traders. This indicator maps exactly where volume was traded across price levels during the session and automatically identifies the thin areas — the Low Volume Nodes — where price moves fast and institutions are likely to react.
What it does:
Volume Profile — displays a horizontal bar chart to the right of price showing how much volume traded at each price level. Green bars where buyers dominated, red bars where sellers dominated, yellow bar at the Point of Control — the single price level with the most volume traded.
Low Volume Nodes (LVN) — automatically detects the price zones where volume is significantly thinner than surrounding levels. These are the gaps in the market where price moved too fast for participants to trade much — creating imbalances that price tends to revisit and react to.
🟢 Green zones — LVN below current price = support. Price tends to bounce here or accelerate through on high volume.
🔴 Red zones — LVN above current price = resistance. Price tends to reject here or break through with momentum.
🟡 POC line — Point of Control extends left across the chart. The most important intraday reference level — price gravitates toward this level throughout the day.
How to use it:
When price approaches a green or red zone you have two scenarios — a bounce or a clean break.
Bounce — price touches the zone and closes back outside it. Look for a buy at green zones and a sell at red zones.
Break — price closes through the zone with volume. Trade the continuation in the direction of the break — buy above a broken red zone, sell below a broken green zone.
The thinner the zone the faster price will move through it. The POC acts as a magnet — if price is far from it expect it to get pulled back during the session.
Settings:
Profile Mode — Session resets each day for intraday use. Lookback uses a fixed bar count
Node Detection % — Controls how sensitive the LVN detection is. Higher finds more zones
Max LVN Nodes — Maximum number of zones shown — always displays the closest ones to current price
Zone Expand — Makes each zone slightly thicker to capture neighboring thin levels
Profile Offset — Controls the space between price and the profile
session mode - best for 1-5 minute timeframe
lookback mode - best for higher timeframe
开源脚本
秉承TradingView的精神,该脚本的作者将其开源,以便交易者可以查看和验证其功能。向作者致敬!您可以免费使用该脚本,但请记住,重新发布代码须遵守我们的网站规则。

免责声明
这些信息和出版物并非旨在提供,也不构成TradingView提供或认可的任何形式的财务、投资、交易或其他类型的建议或推荐。请阅读使用条款了解更多信息。
开源脚本
秉承TradingView的精神,该脚本的作者将其开源,以便交易者可以查看和验证其功能。向作者致敬!您可以免费使用该脚本,但请记住,重新发布代码须遵守我们的网站规则。
免责声明
这些信息和出版物并非旨在提供,也不构成TradingView提供或认可的任何形式的财务、投资、交易或其他类型的建议或推荐。请阅读使用条款了解更多信息。