Fibonacci Pro + Intraday Momentum | Albert Setups
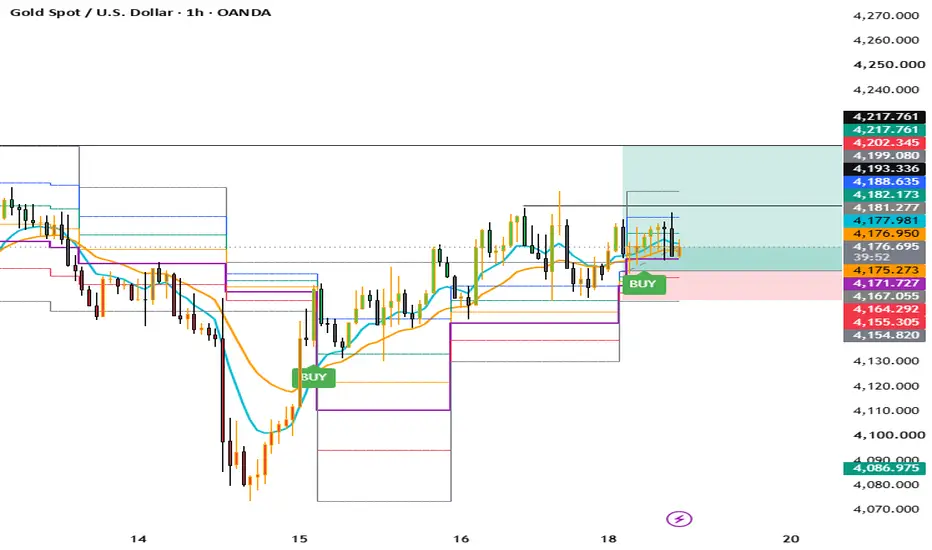
Fibonacci Pro + Intraday Momentum | Albert Setups
**Master the Retracement. Confirm the Momentum. Identify the Opportunity.**
The **Fibonacci Pro + Intraday Momentum** indicator is designed to help traders identify potential intraday trading opportunities by combining Fibonacci retracement levels, EMA trend analysis, RSI momentum, and candlestick confirmation in one TradingView indicator.
### Key Features
- **Automatic Fibonacci Levels:** Plots key retracement levels at 23.6%, 38.2%, 50%, 61.8%, and 78.6% using confirmed market swing points.
- **Intraday Trend Detection:** Uses the 9 EMA and 21 EMA to help identify bullish and bearish market direction.
- **RSI Momentum Confirmation:** Evaluates momentum using RSI to filter potential trading setups.
- **BUY Signals:** Identifies potential bullish opportunities when price enters the 38.2%–61.8% Fibonacci retracement zone with bullish trend and candle confirmation.
- **SELL Signals:** Identifies potential bearish opportunities when price enters the retracement zone with bearish trend and candle confirmation.
- **Trend Candle Coloring:** Green candles indicate bullish momentum, red candles indicate bearish momentum, and gray candles indicate mixed conditions.
- **TradingView Alerts:** Provides alerts for potential BUY and SELL signals.
### How to Use It
1. Identify the current market direction using the EMA lines.
2. Monitor the Fibonacci retracement zone between 38.2% and 61.8%.
3. Wait for RSI momentum and candle confirmation.
4. Use the indicator's signals alongside support and resistance, higher-timeframe analysis, and a defined risk-management plan.
### Best Suited For
- Intraday trading and short-term market analysis
- Forex and Gold (XAUUSD)
- Cryptocurrency markets
- Fibonacci-based price action strategies
**Important Risk Disclaimer:** This indicator provides technical analysis signals, not guaranteed trading results. Fibonacci levels are based on confirmed swing points and may update as new market structure develops. Always backtest your settings and use appropriate stop-loss and position-sizing rules.
**Albert Setups | Trade the Retracement. Follow the Momentum. Manage Your Risk.**
**Master the Retracement. Confirm the Momentum. Identify the Opportunity.**
The **Fibonacci Pro + Intraday Momentum** indicator is designed to help traders identify potential intraday trading opportunities by combining Fibonacci retracement levels, EMA trend analysis, RSI momentum, and candlestick confirmation in one TradingView indicator.
### Key Features
- **Automatic Fibonacci Levels:** Plots key retracement levels at 23.6%, 38.2%, 50%, 61.8%, and 78.6% using confirmed market swing points.
- **Intraday Trend Detection:** Uses the 9 EMA and 21 EMA to help identify bullish and bearish market direction.
- **RSI Momentum Confirmation:** Evaluates momentum using RSI to filter potential trading setups.
- **BUY Signals:** Identifies potential bullish opportunities when price enters the 38.2%–61.8% Fibonacci retracement zone with bullish trend and candle confirmation.
- **SELL Signals:** Identifies potential bearish opportunities when price enters the retracement zone with bearish trend and candle confirmation.
- **Trend Candle Coloring:** Green candles indicate bullish momentum, red candles indicate bearish momentum, and gray candles indicate mixed conditions.
- **TradingView Alerts:** Provides alerts for potential BUY and SELL signals.
### How to Use It
1. Identify the current market direction using the EMA lines.
2. Monitor the Fibonacci retracement zone between 38.2% and 61.8%.
3. Wait for RSI momentum and candle confirmation.
4. Use the indicator's signals alongside support and resistance, higher-timeframe analysis, and a defined risk-management plan.
### Best Suited For
- Intraday trading and short-term market analysis
- Forex and Gold (XAUUSD)
- Cryptocurrency markets
- Fibonacci-based price action strategies
**Important Risk Disclaimer:** This indicator provides technical analysis signals, not guaranteed trading results. Fibonacci levels are based on confirmed swing points and may update as new market structure develops. Always backtest your settings and use appropriate stop-loss and position-sizing rules.
**Albert Setups | Trade the Retracement. Follow the Momentum. Manage Your Risk.**

— Albert Markets
📊 Market Analysis • Trading Ideas • Forecasts
📲 Join our Telegram Channel for more updates.
t.me/+lf89cAXTVAI5MjI0
📊 Market Analysis • Trading Ideas • Forecasts
📲 Join our Telegram Channel for more updates.
t.me/+lf89cAXTVAI5MjI0
免责声明
这些信息和出版物并非旨在提供,也不构成TradingView提供或认可的任何形式的财务、投资、交易或其他类型的建议或推荐。请阅读使用条款了解更多信息。
— Albert Markets
📊 Market Analysis • Trading Ideas • Forecasts
📲 Join our Telegram Channel for more updates.
t.me/+lf89cAXTVAI5MjI0
📊 Market Analysis • Trading Ideas • Forecasts
📲 Join our Telegram Channel for more updates.
t.me/+lf89cAXTVAI5MjI0
免责声明
这些信息和出版物并非旨在提供,也不构成TradingView提供或认可的任何形式的财务、投资、交易或其他类型的建议或推荐。请阅读使用条款了解更多信息。