OPEN-SOURCE SCRIPT
SQVIGU Squeeze+ TSI Ghost
Description:
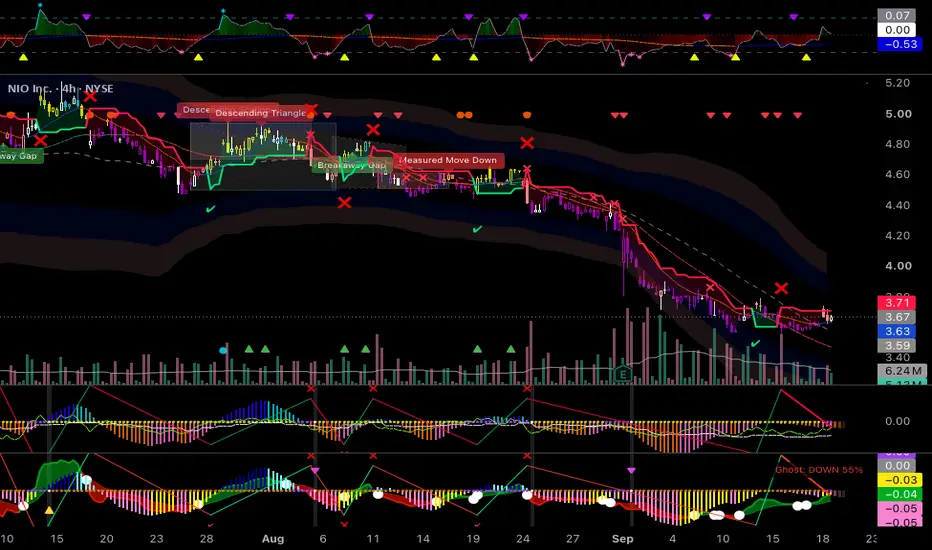
The SQVIGU Squeeze+ is an all-in-one momentum, trend, and projection indicator designed to keep your charts clean while delivering high-conviction signals. It upgrades the classic momentum squeeze by adding predictive "Ghost" projection bars, SuperTrend tracking, and a smooth, auto-scaling True Strength Index (TSI) Cloud Ribbon to confirm trend direction at a glance.
How to Use It:
The TSI Cloud Ribbon: The ribbon at the bottom of the indicator shows the broader trend. Light Blue means bullish momentum; Dark Blue means bearish. A bright White Dot appears exactly when the TSI crosses its signal line, indicating an optimal entry or momentum shift.
The Squeeze Dots (Zero Line): The dots on the zero line tell you when price is consolidating. Purple means the squeeze is building energy. White means the squeeze is firing (breakout). Yellow/Green means the squeeze is off.
Momentum Histogram & Ghost Bars: The classic red and green histogram shows current momentum. The slightly faded "Ghost" bars at the front project where momentum is heading 1 to 3 bars into the future based on linear regression.
SuperTrend Cloud & Zig-Zag: A Green (bullish) or Red (bearish) SuperTrend cloud will display on your main chart. Checkmarks (✔) indicate a confirmed trend cross, while Xs (❌) warn you of a likely false signal.
High-Probability Signals: Look for the tiny Yellow (Long) or Purple (Short) triangles on the top and bottom edges of the indicator pane. These only fire when a squeeze breakout perfectly aligns with a strong macro trend.
The SQVIGU Squeeze+ is an all-in-one momentum, trend, and projection indicator designed to keep your charts clean while delivering high-conviction signals. It upgrades the classic momentum squeeze by adding predictive "Ghost" projection bars, SuperTrend tracking, and a smooth, auto-scaling True Strength Index (TSI) Cloud Ribbon to confirm trend direction at a glance.
How to Use It:
The TSI Cloud Ribbon: The ribbon at the bottom of the indicator shows the broader trend. Light Blue means bullish momentum; Dark Blue means bearish. A bright White Dot appears exactly when the TSI crosses its signal line, indicating an optimal entry or momentum shift.
The Squeeze Dots (Zero Line): The dots on the zero line tell you when price is consolidating. Purple means the squeeze is building energy. White means the squeeze is firing (breakout). Yellow/Green means the squeeze is off.
Momentum Histogram & Ghost Bars: The classic red and green histogram shows current momentum. The slightly faded "Ghost" bars at the front project where momentum is heading 1 to 3 bars into the future based on linear regression.
SuperTrend Cloud & Zig-Zag: A Green (bullish) or Red (bearish) SuperTrend cloud will display on your main chart. Checkmarks (✔) indicate a confirmed trend cross, while Xs (❌) warn you of a likely false signal.
High-Probability Signals: Look for the tiny Yellow (Long) or Purple (Short) triangles on the top and bottom edges of the indicator pane. These only fire when a squeeze breakout perfectly aligns with a strong macro trend.
开源脚本
秉承TradingView的精神,该脚本的作者将其开源,以便交易者可以查看和验证其功能。向作者致敬!您可以免费使用该脚本,但请记住,重新发布代码须遵守我们的网站规则。

免责声明
这些信息和出版物并非旨在提供,也不构成TradingView提供或认可的任何形式的财务、投资、交易或其他类型的建议或推荐。请阅读使用条款了解更多信息。
开源脚本
秉承TradingView的精神,该脚本的作者将其开源,以便交易者可以查看和验证其功能。向作者致敬!您可以免费使用该脚本,但请记住,重新发布代码须遵守我们的网站规则。
免责声明
这些信息和出版物并非旨在提供,也不构成TradingView提供或认可的任何形式的财务、投资、交易或其他类型的建议或推荐。请阅读使用条款了解更多信息。