OPEN-SOURCE SCRIPT
已更新 RSI Divergence Detector
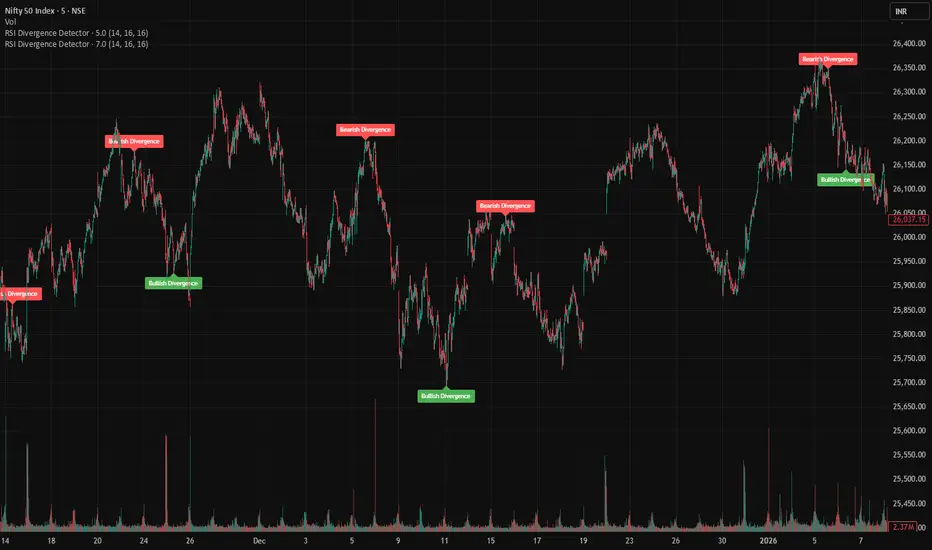
This indicator automatically detects bullish and bearish RSI divergences and displays them directly on the price chart.
A bullish divergence occurs when price forms a lower low while RSI forms a higher low, which may indicate weakening bearish momentum and a potential upward reversal.
A bearish divergence occurs when price forms a higher high while RSI forms a lower high, which may signal weakening bullish momentum and a possible downward reversal.
The script uses pivot highs and lows on both price and RSI to identify confirmed divergences and plots labels on the chart when they occur.
Inputs
RSI Length – period used to calculate RSI
Pivot Left Bars – bars required on the left to confirm a pivot
Pivot Right Bars – bars required on the right to confirm a pivot
Because pivots require confirmation, signals appear after several bars.
A bullish divergence occurs when price forms a lower low while RSI forms a higher low, which may indicate weakening bearish momentum and a potential upward reversal.
A bearish divergence occurs when price forms a higher high while RSI forms a lower high, which may signal weakening bullish momentum and a possible downward reversal.
The script uses pivot highs and lows on both price and RSI to identify confirmed divergences and plots labels on the chart when they occur.
Inputs
RSI Length – period used to calculate RSI
Pivot Left Bars – bars required on the left to confirm a pivot
Pivot Right Bars – bars required on the right to confirm a pivot
Because pivots require confirmation, signals appear after several bars.
版本注释
Update版本注释
updates版本注释
update版本注释
updates版本注释
update: added alert开源脚本
秉承TradingView的精神,该脚本的作者将其开源,以便交易者可以查看和验证其功能。向作者致敬!您可以免费使用该脚本,但请记住,重新发布代码须遵守我们的网站规则。

免责声明
这些信息和出版物并非旨在提供,也不构成TradingView提供或认可的任何形式的财务、投资、交易或其他类型的建议或推荐。请阅读使用条款了解更多信息。
开源脚本
秉承TradingView的精神,该脚本的作者将其开源,以便交易者可以查看和验证其功能。向作者致敬!您可以免费使用该脚本,但请记住,重新发布代码须遵守我们的网站规则。
免责声明
这些信息和出版物并非旨在提供,也不构成TradingView提供或认可的任何形式的财务、投资、交易或其他类型的建议或推荐。请阅读使用条款了解更多信息。