OPEN-SOURCE SCRIPT
Moving Average Suite (60+)
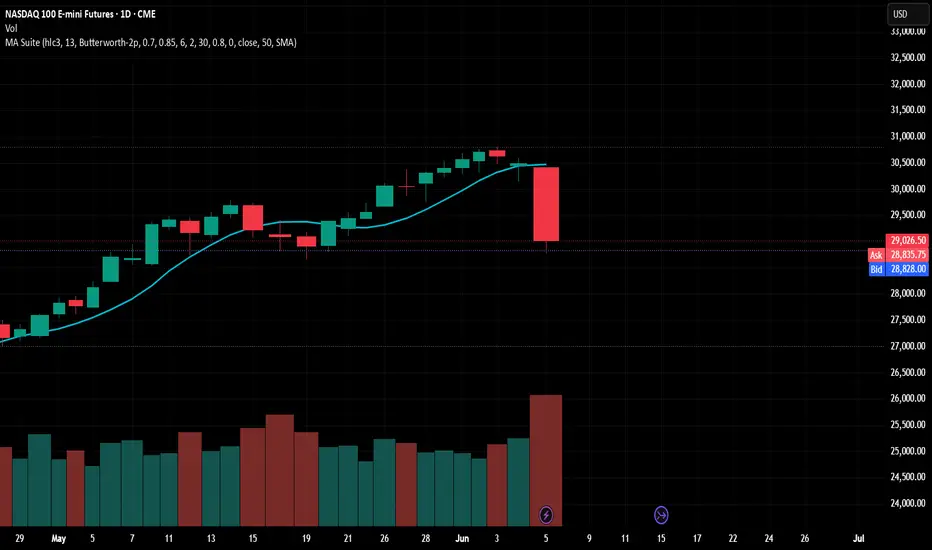
Moving Average Suite (60+ in One)
Welcome to the ultimate Moving Average Suite. Instead of cluttering your chart with multiple scripts or struggling to find that one specific moving average, this single indicator gives you access to over 60 different moving averages through a clean, simple dropdown menu.
Every included moving average has been numerically validated for accuracy, ensuring you get institutional-grade calculations without the hassle of managing multiple indicators.
Key Features
Massive Library: Choose from over 60 distinct moving average types from 7 different mathematical families.
Dual-Plotting System: Optionally plot a second, independent moving average to easily build crossover strategies or compare two different calculation methods side-by-side.
Clean UI: A single "Length" input drives the core of every moving average. For the specific MAs that require extra fine-tuning (like T3 volume factors or KAMA speeds), those parameters are neatly organized in a dedicated section.
Highly Accurate: Calculated with precision and validated against external data science libraries to ensure true-to-form behavior.
The Moving Average Families
We have categorized the available moving averages into seven distinct families based on how they process price data:
1. Classic
The foundational trend-following tools. This includes the standard Simple (SMA), Exponential (EMA), Weighted (WMA), and Running/Smoothed (RMA/SMMA) averages, plus a Cumulative average that tracks price action since the beginning of the chart.
2. Reduced-Lag
Designed to stick closer to the price action and react faster to sudden changes. This family includes double/triple exponential variations (DEMA, TEMA) and highly responsive tools like the Hull (HMA), EHMA, Tillson's T3, and the McGinley Dynamic.
3. Shaped Windows
Instead of applying linear weights, these averages use statistical "shapes" to smooth out price data. You'll find bell-curve smoothing (Gaussian), wave-based smoothing (Sine, Cosine), and binomial models (Pascal) that provide incredibly smooth outputs.
4. Adaptive
"Smart" moving averages that dynamically adjust their own speed based on market conditions. In choppy, sideways markets, they slow down and stay flat to avoid false signals. When a strong trend breaks out, they speed up to catch the move. This category includes KAMA, VIDYA, FRAMA, MAMA/FAMA, and an approximation of the Jurik Moving Average (JMA).
5. Volume-Weighted
Price is only half the story; volume is the other. These averages factor in trading volume to give more weight to price levels where heavy trading occurred. Includes VWMA, Session VWAP, Elastic VWMA, and Volatility-Adjusted MA (VAMA).
6. Regression & Statistical
Built on statistical modeling rather than simple averaging. This includes the Linear Regression Curve (LSMA), Holt Double Exponential (which tracks both level and trend), the Median price tracker, Geometric, and Harmonic averages.
7. Ehlers & Digital Filters
Advanced tools borrowed from the world of digital signal processing, engineered by John Ehlers. These filters are mathematically designed to aggressively strip out market noise (aliasing) while maintaining near-zero lag. Includes the SuperSmoother, 2-Pole Butterworth, Laguerre, Roofing Filter, and Instantaneous Trendline.
How to Use It
Add the indicator to your chart.
Open the settings and select your primary MA Type and Length.
If you use a crossover strategy, check the "Show second MA" box and configure your secondary baseline.
If you are using a specialized MA (like ALMA or KAMA), scroll down to the Per-MA Params group to tweak its specific inputs.
Welcome to the ultimate Moving Average Suite. Instead of cluttering your chart with multiple scripts or struggling to find that one specific moving average, this single indicator gives you access to over 60 different moving averages through a clean, simple dropdown menu.
Every included moving average has been numerically validated for accuracy, ensuring you get institutional-grade calculations without the hassle of managing multiple indicators.
Key Features
Massive Library: Choose from over 60 distinct moving average types from 7 different mathematical families.
Dual-Plotting System: Optionally plot a second, independent moving average to easily build crossover strategies or compare two different calculation methods side-by-side.
Clean UI: A single "Length" input drives the core of every moving average. For the specific MAs that require extra fine-tuning (like T3 volume factors or KAMA speeds), those parameters are neatly organized in a dedicated section.
Highly Accurate: Calculated with precision and validated against external data science libraries to ensure true-to-form behavior.
The Moving Average Families
We have categorized the available moving averages into seven distinct families based on how they process price data:
1. Classic
The foundational trend-following tools. This includes the standard Simple (SMA), Exponential (EMA), Weighted (WMA), and Running/Smoothed (RMA/SMMA) averages, plus a Cumulative average that tracks price action since the beginning of the chart.
2. Reduced-Lag
Designed to stick closer to the price action and react faster to sudden changes. This family includes double/triple exponential variations (DEMA, TEMA) and highly responsive tools like the Hull (HMA), EHMA, Tillson's T3, and the McGinley Dynamic.
3. Shaped Windows
Instead of applying linear weights, these averages use statistical "shapes" to smooth out price data. You'll find bell-curve smoothing (Gaussian), wave-based smoothing (Sine, Cosine), and binomial models (Pascal) that provide incredibly smooth outputs.
4. Adaptive
"Smart" moving averages that dynamically adjust their own speed based on market conditions. In choppy, sideways markets, they slow down and stay flat to avoid false signals. When a strong trend breaks out, they speed up to catch the move. This category includes KAMA, VIDYA, FRAMA, MAMA/FAMA, and an approximation of the Jurik Moving Average (JMA).
5. Volume-Weighted
Price is only half the story; volume is the other. These averages factor in trading volume to give more weight to price levels where heavy trading occurred. Includes VWMA, Session VWAP, Elastic VWMA, and Volatility-Adjusted MA (VAMA).
6. Regression & Statistical
Built on statistical modeling rather than simple averaging. This includes the Linear Regression Curve (LSMA), Holt Double Exponential (which tracks both level and trend), the Median price tracker, Geometric, and Harmonic averages.
7. Ehlers & Digital Filters
Advanced tools borrowed from the world of digital signal processing, engineered by John Ehlers. These filters are mathematically designed to aggressively strip out market noise (aliasing) while maintaining near-zero lag. Includes the SuperSmoother, 2-Pole Butterworth, Laguerre, Roofing Filter, and Instantaneous Trendline.
How to Use It
Add the indicator to your chart.
Open the settings and select your primary MA Type and Length.
If you use a crossover strategy, check the "Show second MA" box and configure your secondary baseline.
If you are using a specialized MA (like ALMA or KAMA), scroll down to the Per-MA Params group to tweak its specific inputs.
开源脚本
秉承TradingView的精神,该脚本的作者将其开源,以便交易者可以查看和验证其功能。向作者致敬!您可以免费使用该脚本,但请记住,重新发布代码须遵守我们的网站规则。

免责声明
这些信息和出版物并非旨在提供,也不构成TradingView提供或认可的任何形式的财务、投资、交易或其他类型的建议或推荐。请阅读使用条款了解更多信息。
开源脚本
秉承TradingView的精神,该脚本的作者将其开源,以便交易者可以查看和验证其功能。向作者致敬!您可以免费使用该脚本,但请记住,重新发布代码须遵守我们的网站规则。
免责声明
这些信息和出版物并非旨在提供,也不构成TradingView提供或认可的任何形式的财务、投资、交易或其他类型的建议或推荐。请阅读使用条款了解更多信息。