Hussman Motherlode Approximation█ OVERVIEW
This indicator approximates John Hussman's "Motherlode" composite, which flags conditions historically present at intermediate market peaks: overextended price action coinciding with deteriorating internal breadth. The composite draws red vertical lines when multiple breadth-divergence signals fire within a configurable lookback window.
The core composite requires joint occurrence of a confirmed Hindenburg Omen (Miekka two-phase method) and a Titanic Syndrome within 20 trading sessions. An optional Phase Transition proxy can be toggled on for a stricter three-signal requirement.
█ SIGNALS
Hindenburg Omen (Miekka Two-Phase)
Implements Jim Miekka's original two-phase methodology using NYSE breadth data:
• Phase 1 (Trigger): Both NYSE new 52-week highs and new 52-week lows exceed a threshold
percentage of total issues (advancing + declining), while the index is trading at or above its
level from N bars ago (uptrend filter). Both conditions must be true on the same bar.
• Phase 2 (Activation): Once triggered, a signal window opens for 30 bars. Within that window,
the omen is ACTIVE when the McClellan Oscillator (computed via the Ratio-Adjusted Net Advances
method from NYSE breadth) is negative, and INACTIVE when the MCO turns positive.
This two-phase approach reduces false signals relative to single-bar implementations by requiring
sustained breadth deterioration after the initial divergence.
Titanic Syndrome
Fires when NYSE new 52-week lows exceed NYSE new 52-week highs within 7 trading days of the chart
instrument making a 52-week high. This captures the specific condition of declining breadth beneath
a surface of index-level strength, often driven by narrow leadership.
Phase Transition Proxy (Optional)
Hussman's Phase Transition condition combines overvaluation, overbought price action, overbullish
sentiment, and rising yields. Since TradingView lacks direct feeds for valuation metrics and
Investors Intelligence sentiment data, this indicator approximates the condition using RSI
(overbought threshold) combined with an elevated 10-period smoothed NYSE advances ratio.
This proxy will overfire relative to Hussman's actual model. It is disabled in the composite by
default and should be treated as a rough filter, not a faithful reproduction. Enable it via the
"Require Phase Transition proxy" toggle in the Composite input group.
█ WHAT IS NOT INCLUDED
Hussman's full Motherlode composite also requires at least one instance of his proprietary
Syndrome 63 or Syndrome 74 within the lookback window. These syndromes are referenced in his
weekly commentaries but their exact formulas have never been published. This indicator does not
attempt to fabricate them. The info table on the chart displays "Not Available" for this component
as a permanent reminder.
This means the indicator will produce more signals than Hussman's published charts. Treat it as a
superset: every Hussman signal would appear here, but not every signal here would appear in
Hussman's version.
█ HOW TO USE
1 — Apply the indicator to a daily chart. It is designed for the S&P 500 ( SP:SPX )
but will function on any instrument since breadth data is pulled independently via
`request.security()`. The uptrend filter and 52-week high detection use the chart instrument's
own price data.
2 — Red vertical lines mark bars where the composite condition is active. The first bar of each
new cluster draws a full-opacity line; sustained signal bars draw thinner, partially transparent
lines so you can distinguish onset from continuation.
3 — Use the info table (top-right corner) to see which components are currently active and their
raw values: McClellan Oscillator level, new highs/lows percentages, and Hindenburg Omen window
status.
4 — For component-level debugging, enable the optional background shading toggles in the Display
input group. These shade the chart background when individual signals are active:
• Orange: Hindenburg Omen active (within window, MCO negative)
• Purple: Titanic Syndrome firing
• Blue: Phase Transition proxy firing
█ INPUTS
Hindenburg Omen (Miekka)
• NH/NL Threshold (%): Minimum percentage of total NYSE issues that both new highs and new
lows must exceed. Default 2.8%.
• Uptrend Lookback (bars): The index must be at or above its close this many bars ago for the
trigger to fire. Default 50 (roughly 10 weeks).
• Signal Window (bars): After a trigger, the MCO gate remains active for this many bars.
Default 30.
Titanic Syndrome
• Days from 52wk High: How recently the chart instrument must have made a 52-week high for the
syndrome to be valid. Default 7.
Phase Transition Proxy
• RSI Length / Overbought: Standard RSI parameters for the overbought condition. Defaults 14 / 70.
• Bull% Threshold: The 10-bar smoothed NYSE advances ratio must exceed this level. Default 55%.
Composite
• Joint Signal Lookback: All required signals must have fired within this many bars. Default 20.
• Require Phase Transition proxy: Off by default. When enabled, the Phase Transition proxy must
also fire within the lookback for the composite to activate.
Display
• Vertical line color and width.
• Optional background shading for each individual component (all off by default).
█ DATA FEEDS
The indicator pulls four NYSE breadth series via `request.security()`:
• INDEX:HIGN — NYSE New 52-Week Highs
• INDEX:LOWN — NYSE New 52-Week Lows
• INDEX:ADVN — NYSE Advancing Issues
• INDEX:DECN — NYSE Declining Issues
These feeds require a TradingView plan that includes access to NYSE breadth indices. If they
resolve to `NaN`, the indicator will not produce signals.
█ ALERTS
Four alert conditions are available:
• Motherlode Onset: Fires on the first bar of a new composite signal cluster.
• Hindenburg Trigger: Fires when Phase 1 trigger conditions are met.
• Hindenburg Active: Fires on every bar where the omen is active (within window, MCO negative).
• Titanic Syndrome: Fires when new lows exceed new highs near a 52-week high.
█ LIMITATIONS
• The Phase Transition proxy is a rough approximation. It lacks valuation data, Investors
Intelligence survey data, and yield curve inputs that Hussman's actual model uses.
• Syndromes 63 and 74 are not implemented. The composite will produce more signals than Hussman's
published version.
• The McClellan Oscillator is computed from NYSE breadth even when the chart instrument is not an
NYSE-based index. This is by design (the MCO measures broad market internals) but worth noting.
• The indicator draws `line` objects. TradingView limits these to 500 per indicator. On a daily
chart with default settings this is unlikely to be a constraint, but very long histories or
aggressive threshold settings could hit it.
• Vertical lines render correctly on both arithmetic and logarithmic scale charts.
█ REFERENCES
• Hussman, J. "The Motherlode." Weekly Market Comment, November 20, 2021.
hussmanfunds.com
• Hussman, J. "The Phase Transition." Weekly Market Comment, July 30, 2007.
hussmanfunds.com
• Miekka, J. The Hindenburg Omen. Documented in the Sudbury Bull & Bear Report.
█ DISCLAIMER
This indicator is an independent approximation. It is not affiliated with, endorsed by, or derived
from proprietary code of Hussman Strategic Advisors. Published signal history will not match
Hussman's charts exactly due to the omission of Syndromes 63/74 and the use of a Phase Transition
proxy rather than his actual model. Use at your own discretion as one input among many. This is not
financial advice. 指标

指标

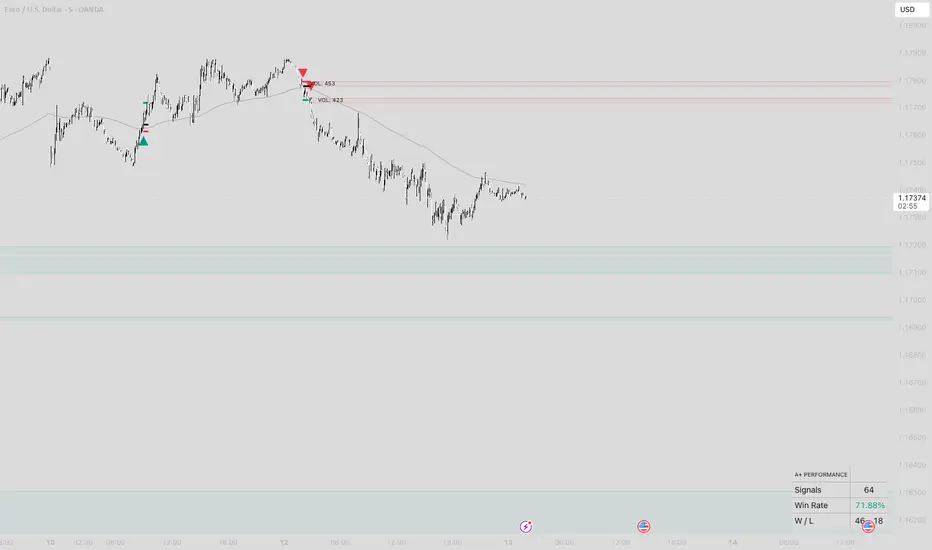
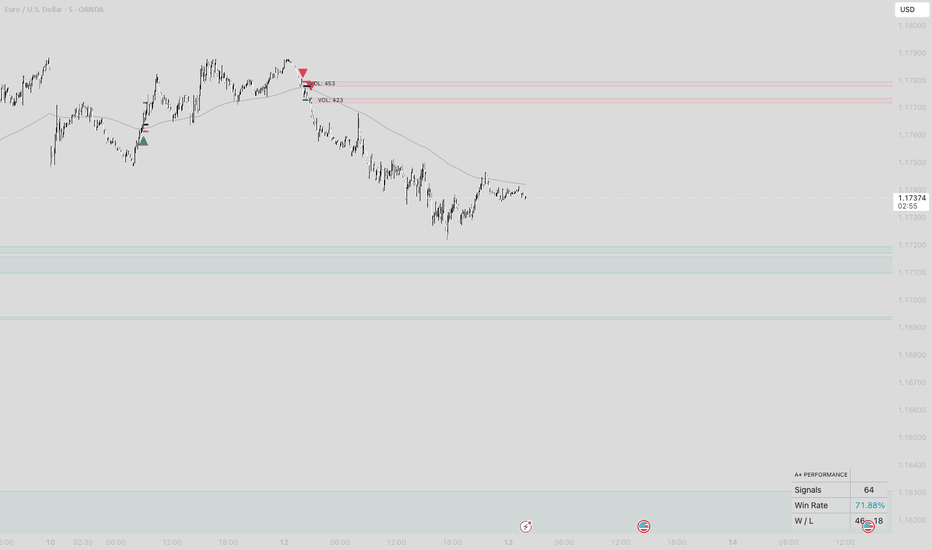
A+ Supply & DemandThe “A+ Supply & Demand” indicator is a high-probability institutional trading tool designed to identify only the strongest market zones with the highest potential for profitable reactions. It combines advanced supply and demand logic, trend confirmation, liquidity analysis, and automated risk management into one complete TradingView system.
The indicator detects powerful institutional supply and demand zones by analyzing aggressive price displacement and volatility using ATR-based filtering. Only high-quality zones created by strong buying or selling pressure are displayed, helping traders avoid weak or low-probability setups.
To improve accuracy, the system includes a 200 EMA trend filter that aligns trades with the dominant market direction. Demand zones are prioritized during bullish trends, while supply zones are prioritized during bearish trends, increasing the probability of successful entries.
A built-in liquidity and volume strength system estimates how much institutional activity and remaining liquidity exist inside each zone. Stronger zones are visually highlighted using volume-based scoring, color intensity, and liquidity labels, making it easier to identify where large unfilled orders may still be present. Zones that become partially mitigated automatically lose liquidity strength over time.
The indicator also provides complete trade execution planning:
* Automatic entry signals on the first retest of fresh zones
* Dynamic stop losses placed beyond previous swing highs/lows with ATR safety buffers
* Accurate take profit targets based on true risk distance
* Configurable Risk:Reward ratios (default 1:2)
For performance tracking, the indicator includes a live dashboard displaying:
* Total trades
* Win rate
* Wins and losses
* Active setup statistics
Additional visual enhancements include:
* Entry, stop loss, and take profit plotting
* Zone transparency based on liquidity strength
* Retest/touch tracking
* Automatic removal of invalid or mitigated zones
The goal of the indicator is to help traders focus exclusively on A+ institutional setups by combining trend alignment, liquidity analysis, displacement strength, and precision risk management into a clean and highly selective trading system.
指标
指标

Composite Breadth Score█ OVERVIEW
Composite Breadth Score (CBS) condenses three independent measures of market breadth into a single normalized 0-100 reading, giving you one line that answers the question: how healthy is market participation right now? The three components are participation breadth (percentage of stocks above their 200-day moving average), momentum breadth (McClellan Summation Index, percentile-ranked), and leadership breadth (ratio of new 52-week highs to total new highs plus new lows).
When all three dimensions confirm each other, the composite score pushes toward extremes. When they diverge, the score compresses toward the midline, surfacing deterioration that single-indicator approaches can miss.
█ CONCEPTS
Why three dimensions?
A market can rise on narrowing participation (a few mega-caps dragging an index higher while most stocks lag). It can also rise with broad participation but deteriorating momentum, or with strong momentum but collapsing leadership. Each failure mode shows up in a different breadth measure. CBS fuses all three so you do not have to watch three separate panes.
Component definitions
1 — Participation : the percentage of S&P 500 constituents trading above their 200-day moving average. This is sourced from `S5TH` (primary) or `MMTH` (fallback). Already scaled 0-100. Measures how many stocks are in long-term uptrends.
2 — Momentum : the McClellan Summation Index, computed as the running cumulative total of the McClellan Oscillator (19/39-period EMA differential of NYSE advancing minus declining issues). Because the Summation Index has no fixed range, it is normalized to 0-100 via percentile rank over a configurable lookback (default 252 bars, roughly one year of daily data).
3 — Leadership : new 52-week highs divided by the sum of new highs and new lows, multiplied by 100. When this reads above 50, new highs dominate; below 50, new lows dominate. Captures whether the market's leading edge is expanding or contracting.
Composite calculation
Each component is weighted (default equal at 33.3% each) and combined into a single score. Weights are user-adjustable. If the participation symbol is unavailable on your data feed, the indicator automatically reweights using only the two remaining components.
█ HOW TO USE
Reading the score
• Above 75: all three breadth dimensions are strong. Market internals confirm the trend. Historically associated with broad, durable rallies, though sustained readings above 75 can precede mean-reversion pullbacks.
• 50 midline: the dividing line between net-positive and net-negative breadth. Crossovers and crossunders of 50 are the most actionable signals for trend direction.
• Below 25: breadth is weak across all three dimensions. Market internals are not supporting price. Common during corrections, bear markets, or the exhaustion phase of a rally.
Divergence analysis
The most valuable use case is divergence: the price index (S&P 500, for example) makes a new high while CBS makes a lower high. This indicates narrowing participation, fading momentum, or deteriorating leadership, often well before price reverses.
Toggle Show Individual Components in the indicator settings to overlay all three normalized streams. This lets you identify which dimension is diverging.
Trend confirmation
CBS crossing above 50 from below, particularly when all three components are rising, is a broad confirmation signal. The inverse (crossing below 50 with all three falling) confirms deterioration.
█ FEATURES
• Fully configurable component weights, allowing you to emphasize whichever breadth dimension matters most to your approach.
• Adjustable McClellan EMA periods (default 19/39) and Summation Index percentile lookback (default 252).
• Configurable overbought, oversold, and participation warning thresholds.
• All data symbols exposed as inputs so you can substitute alternative advancing/declining or new high/new low feeds.
• Status table in the top-right corner showing current values and color-coded health for each component at a glance.
• Nine built-in alert conditions:
— Composite crossing above/below overbought, oversold, and midline levels
— McClellan Summation crossing above/below zero
— New Highs/New Lows ratio flipping bullish or bearish
— Participation dropping below the warning threshold
█ LIMITATIONS
• The McClellan Summation normalization uses percentile rank, which requires the full lookback period (default 252 bars) of data history to stabilize. Values during the initial warm-up period are unreliable.
• Participation data depends on `S5TH` or `MMTH` being available on your TradingView data plan. If neither resolves, the indicator degrades gracefully to a two-component composite and marks participation as "N/A" in the status table.
• The indicator is designed for daily timeframes on US equity indices. Using it on intraday charts or non-US markets will produce results based on whatever the underlying NYSE/S&P symbols report on that timeframe, which may not be meaningful.
• New highs and new lows data reflects NYSE-listed issues, which includes ETFs, preferreds, and closed-end funds. This is the standard feed; common-stock-only filtering is not available via these symbols.
█ NOTES
The default equal weighting (33.3/33.3/33.3) treats all three breadth dimensions as equally important. You may find that adjusting weights improves the signal for your specific use case. For example, weighting participation more heavily produces a score that better captures structural regime shifts, while weighting leadership more heavily makes the score more sensitive to short-term rotations.
The indicator can be applied to any chart symbol. All data is pulled from fixed external symbols regardless of what chart you are viewing. 指标

Fosback High Low Logic Index [NYSE]█ OVERVIEW
This indicator implements Norman Fosback's High Low Logic Index (HLLI) as described in his 1976 book Stock Market Logic . The HLLI detects internal market divergence by measuring how many stocks are simultaneously hitting 52-week highs and 52-week lows on the NYSE. When both counts are elevated, the market's internal structure is bifurcated, which historically precedes significant declines even when headline indices appear healthy.
This is a pure breadth indicator plotted in its own pane beneath price, not an overlay.
█ CONCEPT
Most breadth indicators track net direction: advances minus declines, or new highs minus new lows. The HLLI takes a fundamentally different approach. Instead of asking "which side is winning," it asks "are both extremes active at the same time?" A market where many stocks are making new highs and many are making new lows is structurally fragile regardless of which count is larger.
The core formula:
Raw Ratio = min(New 52W Highs, New 52W Lows) / Total Issues Traded × 100
By taking the minimum of the two counts, the index isolates the "disagreement" component. If 200 stocks hit new highs and 5 hit new lows, the ratio is tiny because the market is moving coherently upward. If 200 hit new highs and 150 hit new lows, the ratio spikes because the market is deeply split.
The raw ratio is then smoothed with an exponential moving average (default 50 bars, approximating Fosback's original 10-week EMA on a daily chart) to filter noise and reveal the underlying regime.
█ HOW TO READ IT
High readings (above the bearish threshold)
The market is internally divided. A large number of stocks are reaching 52-week extremes on both sides simultaneously. This condition historically precedes broad market weakness. The rally, if one exists, is narrow or rotational rather than broad-based.
Low readings (below the bullish threshold)
The market is moving coherently. Very few stocks are at opposing extremes at the same time. This internal agreement, whether the market is trending up or down, historically supports sustained directional moves.
Neutral readings (between thresholds)
No strong signal in either direction. The background shading is absent in this zone.
█ FEATURES
• The smoothed HLLI line is color-coded by regime: red when above the bearish threshold,
green when below the bullish threshold, and gray when neutral.
• The unsmoothed raw ratio is plotted as a faded area behind the HLLI line, allowing you
to see individual spikes before smoothing absorbs them.
• A status label on the last bar displays the current HLLI value, raw ratio, underlying
new highs/lows counts, total issues traded, and the active regime.
• Background shading highlights bearish (red) and bullish (green) regimes.
• Two alert conditions fire on threshold crossovers: one when the HLLI crosses above the
bearish level, one when it crosses below the bullish level.
█ INPUTS
• EMA Smoothing Length : Controls the smoothing period for the raw ratio. Default is
50 bars (approximately 10 trading weeks on a daily chart). Shorter values increase
sensitivity; longer values produce a slower, more stable signal.
• Bearish Threshold % : The level above which the HLLI signals elevated divergence.
Default is 2.5%. This may require adjustment depending on the historical period and
your risk tolerance.
• Bullish Threshold % : The level below which the HLLI signals market coherence.
Default is 1.0%.
█ DATA SOURCES
This script uses four external data feeds via request.security() :
• MAHN : NYSE new 52-week highs
• MALN : NYSE new 52-week lows
• USI:ADV : NYSE advancing issues
• USI:DECL : NYSE declining issues
Total issues traded is computed as advancing + declining issues. Fosback's original formulation included unchanged issues in the denominator, but TradingView does not provide a reliable NYSE unchanged-issues feed, so this script uses the two-component total. The practical impact on the ratio is minimal.
█ LIMITATIONS
• This is a regime indicator, not a timing tool. The 50-bar EMA smoothing means the HLLI
responds slowly to sudden shifts. It is best used as a confirmation layer alongside
faster signals.
• The default thresholds (2.5% bearish, 1.0% bullish) are starting points derived from
historical convention. The NYSE universe has changed substantially since 1976 due to
ETF proliferation and structural changes in listed issues. Backtesting threshold
sensitivity on your timeframe of interest is recommended.
• Historical data availability for the underlying breadth feeds varies by TradingView
subscription tier.
• The script uses four request.security() calls. Keep this in mind if you are near
TradingView's per-script limit when combining with other multi-feed indicators.
█ NOTES
This indicator should not be confused with the "High-Low Index" (sometimes called the Record High Percent indicator), which computes new highs / (new highs + new lows). That is a directional measure. Fosback's HLLI specifically uses min (new highs, new lows) in the numerator to capture divergence, which makes it conceptually distinct.
Fosback's original research is published in:
Fosback, Norman G. Stock Market Logic: A Sophisticated Approach to Profits on Wall Street . Dearborn Financial Publishing, 1976.
═════════════════════════════════════════════════════════════════════════
Disclaimer : This script is provided for educational and informational purposes only. It is not financial advice. Past indicator behavior does not guarantee future results. 指标

Hindenburg Omen [Severity]Hindenburg Omen - Severity Weighted
Most Hindenburg Omen implementations give you a binary answer: the omen fired or it didn't. This version tells you how alarmed to be . It replaces the binary trigger with a continuous divergence intensity score that measures how far above the threshold both new highs and new lows have pushed, while preserving Miekka's original two-phase methodology in every other respect.
A bar where 8% of stocks are hitting new highs and 6% are hitting new lows is a fundamentally more alarming signal than one barely crossing 2.8% on both sides. This indicator makes that distinction visible.
This is the fourth in a series of Hindenburg Omen indicators built on Miekka's original specification. The first corrects the widely misimplemented NYSE version. The second adapts it to the S&P 500 to avoid ETF noise. The third combines multiple universes into a consensus framework. This version adds severity grading to the base NYSE indicator.
═══════════════════════════════════════════════════════════════════
DIVERGENCE INTENSITY SCORE
The core addition is a single number:
Divergence Intensity = min(new_highs_%, new_lows_%) / threshold
• 1.0x means the weaker side is exactly at the threshold. Barely qualifying.
• 1.5x means the weaker side is 50% above the threshold. Notable.
• 2.0x means the weaker side is double the threshold. Severe.
• 2.5x+ is historically rare and indicates extreme breadth divergence.
The formula uses the lesser of the two percentages (new highs % and new lows %) because the omen requires BOTH to exceed the threshold. The weaker side is the binding constraint. If new highs are at 8% but new lows are at 3%, the intensity is 3% / 2.8% = 1.07x. The extreme highs reading does not compensate for a barely qualifying lows reading.
═══════════════════════════════════════════════════════════════════
HOW IT WORKS
The indicator preserves Miekka's two-phase structure exactly. Severity grading is layered on top without changing the underlying methodology.
Phase 1: Trigger
A trigger fires when divergence intensity reaches 1.0x or higher (both new highs % and new lows % exceed the threshold) AND the NYSE Composite is in an uptrend (at or above its value from 50 trading days ago). This opens a 30-trading-day signal window, identical to the base indicator.
Phase 2: Activation
Within the signal window, the omen is active when the McClellan Oscillator is negative and deactivated when it turns positive. The MCO is computed from NYSE advances and declines and acts as a sentiment gate, not a co-equal trigger condition.
Severity Layer
The trigger is classified into tiers based on intensity at the moment it fires:
• TRIGGER (1.0x to 1.5x) — Threshold met. Standard Hindenburg signal.
• ELEVATED (1.5x to 2.0x) — Meaningfully above threshold on both sides.
• SEVERE (2.0x+) — Double the threshold or more. Historically uncommon.
The indicator also tracks the peak intensity seen during each 30-day signal window. A window opened by a barely qualifying trigger that later sees a second, stronger trigger within the same window will reflect the higher reading. This matters because Miekka emphasized that clusters of signals within a window are stronger warnings than single occurrences.
═══════════════════════════════════════════════════════════════════
HOW TO READ THE CHART
Trigger Markers
• Yellow triangle "TRIGGER" — Intensity 1.0x to 1.5x. Standard threshold crossing.
• Orange triangle "ELEVATED" — Intensity 1.5x to 2.0x. Both sides meaningfully above threshold.
• Red triangle "SEVERE" — Intensity 2.0x or higher. Extreme breadth divergence.
Background Shading
• Graded maroon/red background: The omen is active (signal window open, MCO negative). The background intensity varies by the peak divergence score recorded during the current window. A window opened by a severe trigger has a deeper, more visible background than one opened by a marginal trigger. Per Miekka, this is the state where traders should consider going short or exiting long positions.
• Light orange background: A signal window is open but the MCO has turned positive, temporarily deactivating the omen. If the MCO dips negative again before the 30 days expire, the omen reactivates.
• No background: No active signal window.
Info Label
The floating label on the last bar shows:
• Current divergence intensity and its severity classification
• Raw new highs and new lows percentages with issue counts
• Uptrend condition status with index values
• McClellan Oscillator reading and gate status
• Signal window status with bars remaining
• Peak intensity recorded during the current window
═══════════════════════════════════════════════════════════════════
PRACTICAL INTERPRETATION
Not all Hindenburg Omen triggers are equal. Here is how to think about the severity tiers:
TRIGGER (1.0x to 1.5x): The threshold has been crossed, but not by much. This is the most common case and has the highest false positive rate. Worth noting, not worth panicking over. Watch for follow-up triggers within the 30-day window (cluster confirmation).
ELEVATED (1.5x to 2.0x): Both new highs and new lows are meaningfully above the threshold. The market is showing real internal disagreement. Pay closer attention. If this clusters with other signals in the same window, the warning carries significantly more weight.
SEVERE (2.0x+): Both sides are at double the threshold or beyond. This is historically uncommon and indicates extreme breadth divergence. When this coincides with a negative MCO, treat it as a high-priority risk management signal.
The intensity score also helps with near-misses. A reading of 0.9x means the market nearly triggered but fell just short. That context is useful even without a formal trigger.
═══════════════════════════════════════════════════════════════════
INPUTS
• New Highs/Lows Threshold % — The baseline threshold for new 52-week highs and lows as a percentage of NYSE advances + declines. Default 2.8% per Miekka. The intensity score is computed relative to this value.
• Positive Trend Lookback — Number of trading days used to confirm the NYSE Composite is in an uptrend. Default 50.
• Signal Window — Number of trading days the signal window remains open after a trigger. Default 30.
═══════════════════════════════════════════════════════════════════
ALERTS
Four alert conditions are available, allowing different notification urgencies for different severity levels:
• Severe Trigger: Fires only when intensity reaches 2.0x or higher.
• Elevated Trigger: Fires when intensity is between 1.5x and 2.0x.
• Any Trigger: Fires on any trigger at 1.0x or above.
• Omen Active: Fires when the omen is active (signal window open, MCO negative), regardless of the severity tier that opened the window.
═══════════════════════════════════════════════════════════════════
METHODOLOGY NOTES
This indicator preserves all corrections from the base Hindenburg Omen indicator:
• Threshold: Default 2.8% per Miekka's specification, not the widely misreported 2.2%.
• Denominator: Advances + declines, not total issues traded (which includes unchanged).
• MCO role: Two-phase gating mechanism within a 30-day signal window, not a co-equal trigger condition.
• NH/NL ratio filter: Removed. Not in Miekka's published methodology.
The severity grading is an analytical enhancement layered on top of Miekka's structure. It does not add, remove, or modify any of his conditions. It simply measures how far above the threshold the trigger has pushed, information that was always present in the data but discarded by binary implementations.
═══════════════════════════════════════════════════════════════════
DATA FEEDS
• `INDEX:MAHN` — NYSE new 52-week highs count
• `INDEX:MALN` — NYSE new 52-week lows count
• `USI:ADV` — NYSE advancing issues
• `USI:DECL` — NYSE declining issues
• `NYA` — NYSE Composite Index
═══════════════════════════════════════════════════════════════════
LIMITATIONS
• False positives: Even severe triggers can occur without subsequent declines. Severity grading reduces but does not eliminate false positives. Use as one input in a broader risk assessment framework.
• NYSE noise: This version runs against the full NYSE, which includes ETFs and structured products. For a cleaner universe, see the S&P 500 variant or the Multi-Universe Consensus variant in this series.
• Intensity is relative to threshold: Changing the threshold input changes all intensity readings. A 1.5x reading at a 2.8% threshold (4.2% actual) represents different market conditions than a 1.5x reading at a 2.2% threshold (3.3% actual). Be aware of this when comparing across different threshold settings.
• Data availability: The NYSE breadth feeds have limited historical depth on TradingView. The indicator will not produce signals prior to the start of these feeds (approximately 2015).
• Not investment advice: This indicator is a technical analysis tool. It does not constitute financial advice. Always conduct your own research and consult qualified professionals before making investment decisions.
═══════════════════════════════════════════════════════════════════
BACKGROUND
The Hindenburg Omen was developed by James R. Miekka in 1995 as a modified and restricted version of work originally published by Martin Zweig and later tweaked by Gerald Appel. It also draws on Norman G. Fosback's High Low Logic Index. Miekka was a high-school physics teacher who lost his eyesight after a laboratory explosion and worked almost entirely with formulas rather than charts. He published the indicator through his newsletter, the Sudbury Bull and Bear Report . The name was suggested by Kennedy Gammage, publisher of The Richland Report . Miekka passed away in 2014.
Claims that the Hindenburg Omen "predicted the crash of 1987" are retroactive backtests. Miekka did not develop the indicator until 1995.
═══════════════════════════════════════════════════════════════════
CREDITS
Part of the Hindenburg Omen series. Originally based on QuantNomad's Hindenburg Omen v4 indicator. Rewritten for Pine Script v6 with structural corrections to align with Miekka's published methodology.
Primary sources:
• Greg Morris, The Complete Guide to Market Breadth Indicators (contains material written directly by Miekka)
• Adaptiv Investments writeup documenting Miekka's original formula
• Tom McClellan's commentary at McClellan Financial Publications 指标

Hindenburg Omen [Consensus]Hindenburg Omen - Multi-Universe Consensus
This indicator runs Jim Miekka's two-phase Hindenburg Omen methodology independently across multiple market universes (NYSE, S&P 500, and optionally NASDAQ) and only signals when two or more universes agree. Cross-universe consensus filters out noise specific to any single exchange, producing fewer but higher-conviction warnings of genuine broad-market fracturing.
This is the third in a series of Hindenburg Omen indicators built on Miekka's original specification. The first corrects the widely misimplemented NYSE version. The second adapts it to the S&P 500 to avoid ETF noise. This version combines both (and optionally NASDAQ) into a consensus framework.
═══════════════════════════════════════════════════════════════════
WHY CONSENSUS
Every single-universe breadth indicator has blind spots:
• NYSE is polluted by ETFs, closed-end funds, preferred shares, and structured products that inflate the new highs and new lows counts with cross-asset noise. A bond ETF hitting a new low while equities rally is not the breadth divergence Miekka intended to detect.
• S&P 500 is curated and clean (no ETFs, no structured products), but it only covers ~503 large-cap names. It misses mid-cap and small-cap weakness, and its small universe means a handful of stocks can push the percentages around.
• NASDAQ skews heavily toward technology and growth. Breadth divergence on NASDAQ alone may reflect sector rotation rather than broad-market stress.
When two or more of these universes independently show breadth divergence during an uptrend, the signal is far more likely to represent genuine market-wide fracturing rather than an artifact of one exchange's composition. This is also philosophically consistent with Miekka's own emphasis on cluster confirmation as a stronger warning than a single signal.
═══════════════════════════════════════════════════════════════════
HOW IT WORKS
The indicator applies Miekka's two-phase methodology independently to each enabled universe:
Phase 1: Trigger (per universe)
Two conditions must fire on the same bar to open a 30-trading-day signal window for that universe:
• Breadth divergence: Both new 52-week highs and new 52-week lows must each exceed a threshold percentage of the universe's issue count.
• Uptrend: The universe's benchmark index must be at or above its value from 50 trading days ago.
Each universe has its own threshold and denominator:
• NYSE: 2.8% of advances + declines (per Miekka's original specification)
• S&P 500: 4.7% of ~503 fixed constituent count
• NASDAQ: 2.8% of ~3,300 estimated composite count
Phase 2: Activation (global)
The indicator counts how many universes currently have open signal windows. When that count meets or exceeds the minimum consensus threshold (default: 2) AND the McClellan Oscillator is negative, the omen is active.
The MCO is computed from NYSE breadth data globally, as TradingView does not provide per-universe advance/decline feeds for the S&P 500 or NASDAQ. It acts as a sentiment gate within the consensus window, not a co-equal trigger condition.
═══════════════════════════════════════════════════════════════════
HOW TO READ THE CHART
• Red "CONSENSUS" triangle above a bar: Multiple universes triggered on the same bar, meeting the consensus threshold. This is the strongest single-bar signal.
• Gray dot above a bar: A single universe triggered but consensus was not reached. Provides context on which universes are showing stress even when the full consensus signal has not fired.
• Dark maroon background: The omen is active . Enough universes have overlapping open signal windows and the McClellan Oscillator is negative. Per Miekka, this is the state where traders should consider going short or exiting long positions.
• Light orange background: Enough universes have overlapping windows (consensus reached) but the MCO has turned positive, temporarily deactivating the omen. If the MCO dips negative again before the windows expire, the omen reactivates.
• No background: Either not enough universes have open windows or all windows have expired.
The floating label on the last bar shows the full status of each universe: whether its window is open, its current new highs/lows percentages versus its threshold, the MCO reading, and the consensus score.
Important: Consensus is scored at the window level , not the trigger level. The indicator asks "how many universes currently have an open 30-day signal window?" rather than "how many triggered on this exact bar?" Triggers across universes will not necessarily land on the same day, but overlapping windows indicate the same underlying stress.
═══════════════════════════════════════════════════════════════════
INPUTS
General
• Positive Trend Lookback — Trading days used to confirm the uptrend condition for each universe. Default 50.
• Signal Window — Trading days each universe's signal window remains open after a trigger. Default 30.
• Minimum Universes for Consensus — How many universes must have overlapping open windows before the consensus signal fires. Default 2. Range 1-3. Set to 1 to see individual universe signals without consensus filtering.
NYSE
• Enable NYSE — Toggle this universe on or off. Default on.
• NYSE Threshold % — Minimum percentage of advances + declines hitting new 52-week highs and lows. Default 2.8% per Miekka.
S&P 500
• Enable S&P 500 — Toggle this universe on or off. Default on.
• S&P 500 Threshold % — Minimum percentage of S&P 500 constituents hitting new 52-week highs and lows. Default 4.7%.
• S&P 500 Constituent Count — Denominator for percentage calculation. Default 503.
NASDAQ (Unverified Symbols)
• Enable NASDAQ — Toggle this universe on or off. Default off. The data symbols `INDEX:MAHQ` and `INDEX:MALQ` are unverified on TradingView. Enable this only after confirming these symbols return valid data on your TradingView plan. If they return no data, the NASDAQ universe will not contribute to consensus.
• NASDAQ Threshold % — Minimum percentage of NASDAQ composite issues. Default 2.8%.
═══════════════════════════════════════════════════════════════════
ALERTS
Two alert conditions are available:
• Consensus Trigger: Fires when enough universes trigger on the same bar to meet the consensus threshold.
• Consensus Active: Fires when the consensus omen is active (enough overlapping windows + negative MCO).
═══════════════════════════════════════════════════════════════════
DATA FEEDS
NYSE
• `INDEX:MAHN` — NYSE new 52-week highs count
• `INDEX:MALN` — NYSE new 52-week lows count
• `USI:ADV` — NYSE advancing issues (also used for global MCO)
• `USI:DECL` — NYSE declining issues (also used for global MCO)
• `NYA` — NYSE Composite Index
S&P 500
• `INDEX:MAHP` — S&P 500 new 52-week highs count
• `INDEX:MALP` — S&P 500 new 52-week lows count
• `SP:SPX` — S&P 500 Index
NASDAQ
• `INDEX:MAHQ` — NASDAQ new 52-week highs count (unverified)
• `INDEX:MALQ` — NASDAQ new 52-week lows count (unverified)
• `NASDAQ:IXIC` — NASDAQ Composite Index
═══════════════════════════════════════════════════════════════════
LIMITATIONS
• False positives: Even with consensus filtering, the Hindenburg Omen can fire without a subsequent decline. It should be used as one input in a broader risk assessment framework, not as a standalone trading signal.
• Hybrid MCO: The McClellan Oscillator is computed from NYSE breadth data and applied globally across all universes. No per-universe MCO is available on TradingView.
• NASDAQ symbols unverified: The `INDEX:MAHQ` and `INDEX:MALQ` symbols follow the observed naming convention but have not been confirmed to return valid data. NASDAQ is disabled by default for this reason.
• Thresholds not backtested: The default thresholds (2.8% NYSE, 4.7% S&P 500, 2.8% NASDAQ) are starting points. The NYSE value is Miekka's original. The S&P 500 value is empirically chosen for the smaller, curated universe. Users should evaluate signal quality and adjust.
• Data availability: The breadth data feeds have limited historical depth on TradingView. The indicator will not produce signals prior to the start of these feeds (approximately 2015 for most).
• Not investment advice: This indicator is a technical analysis tool. It does not constitute financial advice. Always conduct your own research and consult qualified professionals before making investment decisions.
═══════════════════════════════════════════════════════════════════
BACKGROUND
The Hindenburg Omen was developed by James R. Miekka in 1995 as a modified and restricted version of work originally published by Martin Zweig and later tweaked by Gerald Appel. It also draws on Norman G. Fosback's High Low Logic Index. Miekka was a high-school physics teacher who lost his eyesight after a laboratory explosion and worked almost entirely with formulas rather than charts. He published the indicator through his newsletter, the Sudbury Bull and Bear Report . The name was suggested by Kennedy Gammage, publisher of The Richland Report . Miekka passed away in 2014.
Claims that the Hindenburg Omen "predicted the crash of 1987" are retroactive backtests. Miekka did not develop the indicator until 1995.
═══════════════════════════════════════════════════════════════════
CREDITS
Part of the Hindenburg Omen series. The NYSE version corrects structural errors in most public implementations. The S&P 500 version addresses ETF noise. This consensus version combines multiple universes to reduce false positives.
Originally based on QuantNomad's Hindenburg Omen v4 indicator. Rewritten for Pine Script v6.
Primary sources:
• Greg Morris, The Complete Guide to Market Breadth Indicators (contains material written directly by Miekka)
• Adaptiv Investments writeup documenting Miekka's original formula
• Tom McClellan's commentary at McClellan Financial Publications 指标

指标
Hindenburg Omen [Miekka Method]Hindenburg Omen
This indicator implements Jim Miekka's original Hindenburg Omen methodology, correcting several errors found in most public implementations. It is a rewrite of QuantNomad's v4 Hindenburg Omen indicator, updated to Pine Script v6 with structural corrections to match Miekka's published specification.
═══════════════════════════════════════════════════════════════════
WHAT THE HINDENBURG OMEN IS
The Hindenburg Omen is a market breadth indicator that flags periods of elevated crash risk. It detects a specific divergence condition: when an unusually large percentage of NYSE-listed stocks are simultaneously hitting 52-week highs AND 52-week lows. Under normal conditions, the market moves with some degree of uniformity. When both extremes spike at once during an uptrend, it suggests internal fracturing that has historically preceded significant drawdowns.
The indicator was developed by James R. Miekka in 1995 as a modified and restricted version of work originally published by Martin Zweig and later tweaked by Gerald Appel. It also draws on Norman G. Fosback's High Low Logic Index. Miekka was a high-school physics teacher who lost his eyesight after a laboratory explosion and complications from subsequent surgery. While recovering, he began studying the markets by listening to financial broadcasts. Because he could not see, he worked almost entirely with formulas rather than charts. He published the indicator through his newsletter, the Sudbury Bull and Bear Report .
The name was suggested by Kennedy Gammage, publisher of The Richland Report , who had a background in advertising and knew the value of a strong brand. Gammage was also familiar with Bill Ohama's "Titanic Syndrome," another indicator based on new highs and new lows data.
Note: Claims that the Hindenburg Omen "predicted the crash of 1987" are retroactive backtests. Miekka did not develop the indicator until 1995.
═══════════════════════════════════════════════════════════════════
HOW THIS IMPLEMENTATION DIFFERS FROM MOST
Most publicly available versions of the Hindenburg Omen contain errors that have been copied from source to source for years. This version corrects four material deviations from Miekka's specification:
1. Threshold
Miekka specified 2.8% as the minimum percentage of NYSE issues that must be hitting new 52-week highs and lows simultaneously. Most implementations incorrectly use 2.2%. This script defaults to 2.8% but remains configurable.
2. Denominator
Miekka defined the threshold as a percentage of advances plus declines on the same day. Most implementations incorrectly use total issues traded (advances + declines + unchanged). An older version of the indicator used 2.5% of total issues, which may be the source of this confusion. This script uses advances + declines per Miekka's final specification.
3. McClellan Oscillator role
This is the most significant correction. Most implementations treat a negative McClellan Oscillator as one of several conditions that must all fire on the same bar. Miekka's actual design is a two-phase system :
• Phase 1 (Trigger): Breadth divergence and an uptrend must fire on the same bar, opening a 30-trading-day signal window.
• Phase 2 (Activation): Within that window, the omen is activated when the MCO is negative and deactivated when it turns positive.
The MCO is a gate, not a co-equal trigger.
4. High/Low ratio filter
Many implementations include a condition requiring that new highs cannot exceed twice the number of new lows. This does not appear in Miekka's published methodology and has been removed.
═══════════════════════════════════════════════════════════════════
HOW TO READ THE CHART
• Red triangle above a bar: A trigger has fired (breadth divergence + uptrend confirmed on that bar). This opens a 30-trading-day signal window.
• Dark maroon background: The omen is active . You are inside a signal window and the McClellan Oscillator is negative. Per Miekka, this is the state where traders should consider going short or exiting long positions.
• Light orange background: A signal window is open but the MCO has turned positive, temporarily deactivating the omen. The window has not expired, so if the MCO dips negative again before the 30 days are up, the omen reactivates and the background returns to maroon.
• No background: Either no trigger has fired recently or the 30-day window has expired.
A floating label on the last bar shows the current state of all conditions, the MCO value, and how many bars remain in any active window.
Cluster interpretation: A single trigger in isolation is weaker than multiple triggers firing within a short timeframe. If you see repeated triggers clustering within a few weeks, that is historically a stronger warning than a single occurrence.
═══════════════════════════════════════════════════════════════════
INPUTS
• New Highs/Lows Threshold % — Minimum percentage of NYSE advances + declines hitting new 52-week highs and lows. Default 2.8% per Miekka. Some analysts use 2.2%.
• Positive Trend Lookback — Number of trading days used to confirm the NYSE Composite is in an uptrend. Default 50.
• Signal Window — Number of trading days the signal window remains open after a trigger. Default 30.
═══════════════════════════════════════════════════════════════════
ALERTS
Two alert conditions are available:
• Hindenburg Trigger: Fires when the breadth divergence and uptrend conditions are met on the same bar.
• Hindenburg Active: Fires when the omen is active (inside signal window with negative MCO).
═══════════════════════════════════════════════════════════════════
LIMITATIONS
The Hindenburg Omen has a meaningful false positive rate. It fires more often than crashes actually occur. It should be used as one input in a broader risk assessment framework, not as a standalone trading signal. ETF proliferation on the NYSE has also introduced structural noise into the new highs/lows data, which can produce spurious triggers.
═══════════════════════════════════════════════════════════════════
CREDITS
Originally based on QuantNomad's Hindenburg Omen v4 indicator. Rewritten for Pine Script v6 with structural corrections to align with Miekka's published methodology.
Primary sources:
• Greg Morris, The Complete Guide to Market Breadth Indicators (contains material written directly by Miekka)
• Adaptiv Investments writeup documenting Miekka's formula
• Tom McClellan's commentary at McClellan Financial Publications
指标

指标
指标
Crypto Dominance Rotation Map [AGPro Series]Crypto Dominance Rotation Map
🧠 Core Idea
Is crypto capital rotating toward Bitcoin, Ethereum, altcoins, or defensive stablecoin exposure?
📌 Overview / What it does
Crypto Dominance Rotation Map is a crypto market regime tool built to read capital rotation through Bitcoin dominance, Ethereum dominance, broad altcoin participation, and stablecoin defensive pressure.
The script produces a four-lane rotation map, a 0-100 Risk Participation Score, curated regime labels, right-side lane tags, alert conditions, and an AG Pro panel that summarizes the active crypto capital-flow state.
It does not predict price direction, automate trades, or claim that dominance rotation will always lead to a specific outcome. It is designed as a structured market context and visualization tool.
🎯 Purpose & Design Philosophy
This script was built to fill the gap between single-symbol price indicators and broader crypto market context.
Many crypto traders watch BTC dominance, ETH dominance, altcoin market capitalization, and stablecoin dominance separately. This script brings those references into one readable rotation map so the trader can understand the current capital-flow environment faster.
The mindset is context-first: identify where attention and capital may be concentrating before interpreting individual chart setups.
⚡ Why This Script Is Different
Most tools focus on the active chart symbol or on a basket of crypto assets.
This script does NOT try to call buys or sells on one coin.
Instead, it maps dominance rotation across Bitcoin, Ethereum, altcoins, and stablecoin defense so the trader can read the broader crypto regime behind the chart.
⚙️ Methodology
1. Dominance Mapping
The script reads Bitcoin dominance, Ethereum dominance, altcoin market-cap participation, and stablecoin dominance.
2. Rotation Scoring
Each reference is converted into a normalized 0-100 lane score using configurable momentum and smoothing.
3. Regime Classification
The model classifies the active state as BTC Lead, ETH Lead, Alt Risk-On, Defensive, Rotation Watch, or Neutral.
4. Visual Output
The script plots four rotation lanes, a Risk Participation Score, event labels, right-side tags, and a compact panel.
🗺️ How to Read the Chart
BTC Lane shows whether Bitcoin dominance is gaining leadership.
ETH Lane shows whether Ethereum dominance is improving versus the broader crypto market.
Altcoin Lane shows whether broad non-Bitcoin participation is improving.
Stable Lane shows whether stablecoin dominance is rising, which may reflect defensive positioning.
The Risk Participation Score summarizes whether crypto rotation is constructive, defensive, or undecided.
🚦 Signals & States
• BTC LEAD → Bitcoin dominance is the active leadership lane.
• ETH LEAD → Ethereum dominance is leading rotation.
• ALT RISK-ON → altcoin participation is constructive and broad risk appetite is stronger.
• DEFENSIVE → stablecoin dominance pressure is elevated.
• ROTATION WATCH → no clean leader yet, but participation is improving.
• NEUTRAL → no strong capital-flow leader is confirmed.
🔔 Alerts Logic
Alerts trigger when the active rotation state changes into a major regime.
Available alert states:
• BTC Dominance Leadership
• ETH Dominance Leadership
• Altcoin Risk-On Rotation
• Defensive Stablecoin Rotation
Alerts are attention markers only. They are not trade instructions.
🧩 Confluence Logic
Context becomes stronger when the active rotation state aligns with the trader’s chart setup.
For example, an altcoin breakout may carry stronger context when the map shows Alt Risk-On. A defensive state may encourage more caution around aggressive long setups.
📊 When to Use
• Crypto market regime review
• Altcoin season / Bitcoin dominance monitoring
• Risk-on and risk-off context checks
• Higher-timeframe crypto market preparation
• Comparing individual setups with broader market rotation
⚠️ When NOT to Use
• Very low-liquidity crypto assets
• Symbols that do not respond to broader crypto conditions
• Extremely short-term scalping where dominance data is too slow
• Periods where dominance symbols are unavailable or delayed
🎛️ Key Inputs
• BTC Dominance Symbol → Bitcoin dominance reference.
• ETH Dominance Symbol → Ethereum dominance reference.
• Altcoin Market Cap Symbol → broad altcoin participation proxy.
• Stablecoin Dominance Symbol → defensive crypto positioning proxy.
• Rotation Momentum Length → how far back rotation pressure is measured.
• Rotation Smoothing → how smooth or reactive the lane map becomes.
• Risk-On / Defensive Thresholds → state classification sensitivity.
🖥️ Interface & Visual Design
The interface is designed around a four-lane map. Each lane has a clear role: BTC, ETH, ALT, and STABLE.
Event labels highlight regime changes without turning the chart into a signal board.
The panel summarizes state, risk score, lane values, dominance readings, next context, and timeframe.
🧪 Practical Usage Workflow
1. Read the panel state.
2. Check which lane is leading.
3. Compare the Risk Participation Score with the active chart idea.
4. Use labels and alerts as context markers.
5. Confirm with price structure, volume, and your own risk plan.
🔍 Interpretation Guidelines
The script should be interpreted as market context.
BTC leadership may indicate capital concentration in Bitcoin. Alt Risk-On may suggest broader participation. Defensive stablecoin rotation may indicate caution.
No state is automatically bullish or bearish for every asset.
🚫 What This Script Is NOT
This script is not a prediction engine.
It is not financial advice.
It is not an auto-trading system.
It does not provide guaranteed signals.
⚠️ Limitations & Transparency
Dominance symbols may update differently from exchange-traded instruments.
Timeframe selection can materially change the rotation read.
Crypto market conditions can shift quickly during volatility events.
The script depends on the availability and quality of the selected reference symbols.
🧠 Market Context Notes
Dominance rotation is often more useful as a background regime filter than as a direct entry signal.
The strongest use case is comparing an individual crypto setup against the broader flow of capital across Bitcoin, Ethereum, altcoins, and defensive stable exposure.
🧾 Use Case Examples
When an altcoin setup appears while the map shows Alt Risk-On, the broader participation context may be more supportive.
When Bitcoin dominance leads while altcoin participation weakens, altcoin setups may require more selectivity.
When stablecoin dominance becomes defensive, aggressive risk-on interpretations should be handled more carefully.
🔐 Non-Promise Statement
No script can provide certainty.
This tool provides structured context, not guaranteed outcomes.
📉 Risk Disclosure
Trading involves risk.
Users remain responsible for their own decisions.
This script does not provide financial advice.
📚 Educational Note
Use this script to study how crypto capital rotation changes across market regimes and how that context interacts with individual chart setups.
指标

指标

指标

指标

指标
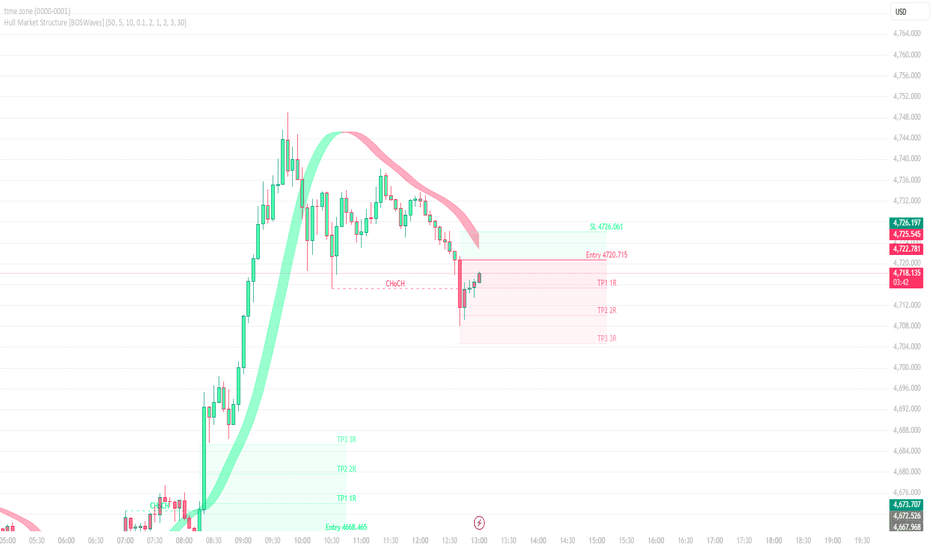
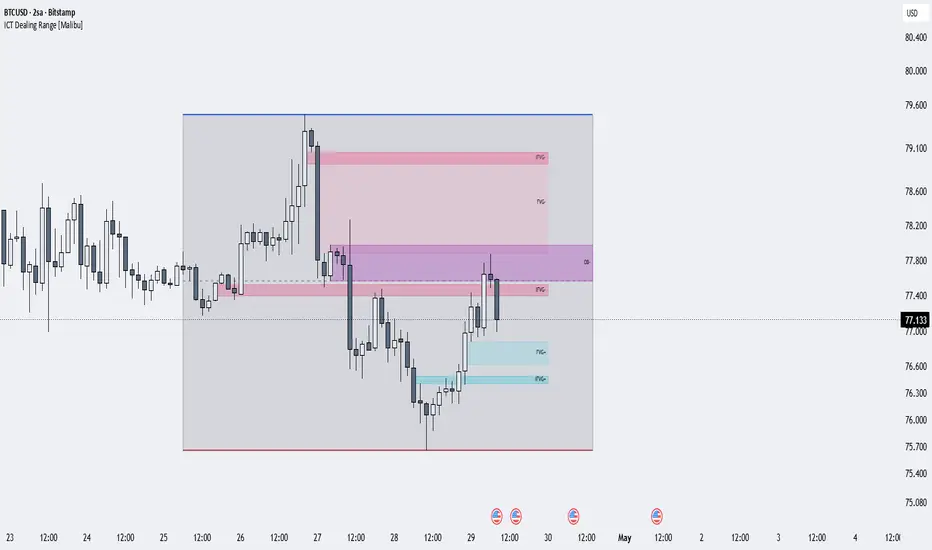
ICT Dealing Range [Malibu]ICT Dealing Range Engine is an open-source market structure and imbalance indicator built to organize multiple ICT-style concepts inside a single live dealing range framework. Instead of plotting Fair Value Gaps, Order Blocks, Breaker Blocks, and equilibrium zones as disconnected elements, this script uses the active dealing range as a structural engine that helps filter, organize, and maintain the most relevant zones around current price.
The purpose of this indicator is not to flood the chart with every possible imbalance or block. Its purpose is to build a cleaner, more contextual map of price by combining dealing range logic, equilibrium, liquidity interaction, market structure shifts, Fair Value Gaps, Inverted Fair Value Gaps, Order Blocks, and Breaker Blocks into one coordinated framework. This makes the script especially useful for traders who want to study price delivery inside a living range rather than treat each concept as an isolated label.
At the center of the script is a rolling dealing range calculated from a user-defined lookback window. The highest high and lowest low within that window define the active range boundaries, while the midpoint defines the equilibrium level. These values are not drawn as static references. They continuously update with market movement, which allows the range to function as a live structural context rather than a fixed historical box. The range can be visually extended to the right and styled with its own fill and boundary colors so that it remains readable without overwhelming the chart.
This range engine is what gives the script its identity. Many indicators can detect FVGs, Order Blocks, or swing-based zones, but they often do so everywhere on the chart without a hierarchy of relevance. In this script, the dealing range can act as a filter, meaning zones can be accepted, preserved, or removed according to whether they belong to the active structural window. That design choice helps reduce clutter and keeps the chart focused on what is currently most relevant from a structural perspective. Instead of treating the range as decoration, the script turns it into the framework that governs how other zones are interpreted.
The indicator can display the active dealing range itself, including the range high, range low, and optional equilibrium line. On top of that structural layer, it can detect bullish and bearish Fair Value Gaps, convert broken gaps into Inverted Fair Value Gaps, identify bullish and bearish Order Blocks after liquidity and structure conditions are met, and build bullish and bearish Breaker Blocks from recent swing relationships. Each of these zone categories can be managed independently, which gives the user control over both logic and presentation.
The Fair Value Gap engine uses a classic three-candle imbalance relationship. A bullish FVG forms when the older candle’s high is below the current candle’s low, creating a void that suggests upward displacement. A bearish FVG forms when the older candle’s low is above the current candle’s high, creating a downward imbalance. This script does not stop at merely finding such gaps. It can also require the gap to be meaningful relative to ATR, which helps ignore very thin or insignificant imbalances that often clutter lower timeframes. Once a qualifying gap is found, it is projected forward as a live zone so the user can monitor future interaction with it.
The Inverted Fair Value Gap logic extends that idea further. If a bullish FVG later breaks to the downside by close, the script can convert it into a bearish IFVG. If a bearish FVG later breaks to the upside by close, it can become a bullish IFVG. This is important because failed imbalances often retain analytical value after polarity changes. Instead of treating a broken gap as useless, the script can reinterpret it as a new directional zone. This creates a more complete picture of how imbalance evolves as price transitions from one state to another.
The Order Block logic is intentionally more selective than simple “last opposite candle” approaches. The script first tracks confirmed pivot highs and pivot lows using the chosen pivot length. Those pivots are then monitored for liquidity sweeps. A move above a stored pivot high marks buy-side liquidity taken, while a move below a stored pivot low marks sell-side liquidity taken. These events alone do not create an Order Block. Instead, they establish the context needed for the next confirmation step.
After liquidity is taken, the script waits for a close-based Market Structure Shift. This means price must actually close through a relevant structural level in the opposite direction before an Order Block candidate is allowed to form. Once that sequence completes, the script scans backward over a configurable number of bars to find the first qualifying opposite candle and uses that candle’s range as the Order Block. In practical terms, after sell-side liquidity is swept and bullish structure shifts, the script searches for a bearish candle to define a bullish OB. After buy-side liquidity is swept and bearish structure shifts, it searches for a bullish candle to define a bearish OB. This makes the Order Block engine more conditional, more context-aware, and less arbitrary than approaches that mark every local opposite candle before a move.
The Breaker Block logic is also structure-driven rather than purely cosmetic. For bearish breakers, the script looks for a high-low-high relationship in which the more recent high exceeds the previous one and price later closes below the intervening low. For bullish breakers, it looks for a low-high-low relationship in which the more recent low undercuts the previous one and price later closes above the intervening high. When those conditions are met, the corresponding region is marked as a Breaker Block. This approach makes breaker creation dependent on actual structural sequencing rather than on a simple visual approximation. To keep the chart readable, the script can also suppress near-duplicate breakers using ATR-based distance checks and remove breaker zones once they exceed a user-defined maximum age.
A major strength of the script is that all of these zones can optionally be filtered through the active dealing range. If enabled, only FVGs, IFVGs, OBs, and BBs that belong to the current structural window are retained. This is one of the main reasons the indicator is useful as a full framework rather than as a loose collection of concepts. The range is not merely a backdrop. It acts as a relevance filter that helps keep attention on the most structurally important zones around current price.
The script also includes a maintenance layer for zone management. Once zones are created, they can be extended forward for continued monitoring. If price invalidates or mitigates a zone, that zone can either be deleted or faded depending on the user’s preference. This is especially useful for traders who want to preserve historical context without keeping fully active boxes on the chart. Breakers can also expire based on age, and every major category has a cap on how many active regions can remain on screen. These controls are important not only for visual clarity but also for overall chart performance and usability.
From a user interface standpoint, the indicator is organized into functional groups so the settings remain easy to understand. The Dealing Range section controls the rolling range window, midpoint visibility, forward extension, and styling for the box and lines. The FVG / IFVG section manages gap detection, range filtering, extension length, and directional colors. The Order Blocks section controls pivot sensitivity, activation, range filtering, extension, scan depth, and color settings. The Breaker Blocks section manages activation, range filtering, extension, age limits, and directional styling. Finally, the Style / Performance section controls label visibility, label color, mitigation fading, faded opacity, and the maximum number of retained zones per category.
This layout is intentional. The script is meant to remain usable for both visual traders and more process-oriented users who want to adjust sensitivity and chart density. A lower pivot length will make the structure engine more reactive, while a higher pivot length will usually produce cleaner but slower structural responses. A shorter range lookback will make the dealing range more adaptive, while a larger one will emphasize broader price boundaries. FVG filtering, zone retention, and fading options can all be adjusted depending on how minimal or information-dense the chart should be.
A practical workflow is to first identify the active dealing range and its equilibrium. That establishes the structural frame. From there, the user can observe which imbalances and reaction zones are forming inside that range, whether price is operating above or below equilibrium, and whether recent liquidity events are producing valid structure shifts. Bullish or bearish FVGs can then be evaluated in the context of current price location, while Order Blocks and Breaker Blocks can be interpreted as more conditionally derived zones that reflect structural responses rather than raw candle patterns. If price later invalidates an FVG and flips it into an IFVG, that polarity change remains visible and can be studied as part of the evolving delivery process.
Key features:
• Rolling dealing range with optional equilibrium line
• Optional dealing-range filter for FVG, IFVG, OB, and BB zones
• ATR-based Fair Value Gap thickness filter
• Sweep + close-based Market Structure Shift logic for Order Blocks
• Structure-based Breaker Block detection
• Inverted Fair Value Gap polarity flips after invalidation
• Zone extension, cleanup, fading, and age controls
• Per-category retention limits for better chart clarity
• Organized input groups for range, FVG/IFVG, OB, BB, and style/performance settings
How to use:
Use the dealing range to define the current structural window, then use equilibrium as the internal reference point of that range. Monitor which FVGs, OBs, and BBs form inside that context, and pay attention to whether price respects, mitigates, invalidates, or flips those zones. The script is most useful when its zones are read as contextual structural areas rather than as automatic signals.
Notes:
This indicator is a chart analysis tool, not a promise of outcome. It does not guarantee direction, entries, or performance. Past market behavior does not guarantee future results. Like any structure- or imbalance-based model, it should be used together with confirmation, risk management, and broader market context.
This script is published as open-source so users can inspect the logic, study the implementation, and adapt the framework for their own research and education. 指标

指标

CAN SLIM Market Direction Monitor (India)How to use it
Open TradingView → load NSE:NIFTY on Daily timeframe.
Pine Editor (bottom panel) → paste contents → Save → Add to chart.
Cross-check on BSE:SENSEX and your sectoral indices.
What it computes
Distribution Days — full (≥0.2% down on rising vol) and stalling (0.5x weight). Auto-expires after 25 sessions or on a 5% rally from the DD's intraday low.
Follow-Through Day — Day 4–13 of a rally attempt with ≥1.5% gain on rising volume.
Phase — Green / Yellow / Red driven by DD count and price-vs-MA structure (the framework's logic, not just one trigger).
Weinstein Stage — 1–4 from the 30-week SMA and its slope.
Dashboard — phase, DD count, % vs 50/200 DMA, drawdown from 60-day high, MA structure, stage, rally-day counter, and posture text.
Alerts — DD, stalling, FTD, and zone transitions.
Caveats to keep in mind
DD logic requires volume. Some sectoral indices on TradingView lack volume — the script flags this on-chart. Use NSE:NIFTY as the primary tape.
Breadth metrics (% of Nifty 500 above 50/200-DMA) and FII/DII flows aren't in Pine's data — those still need to be brought in manually per the project's output protocol.
FTD detection is mechanical; always confirm the rally context (genuine correction preceding it) before treating the signal as actionable. 指标

指标

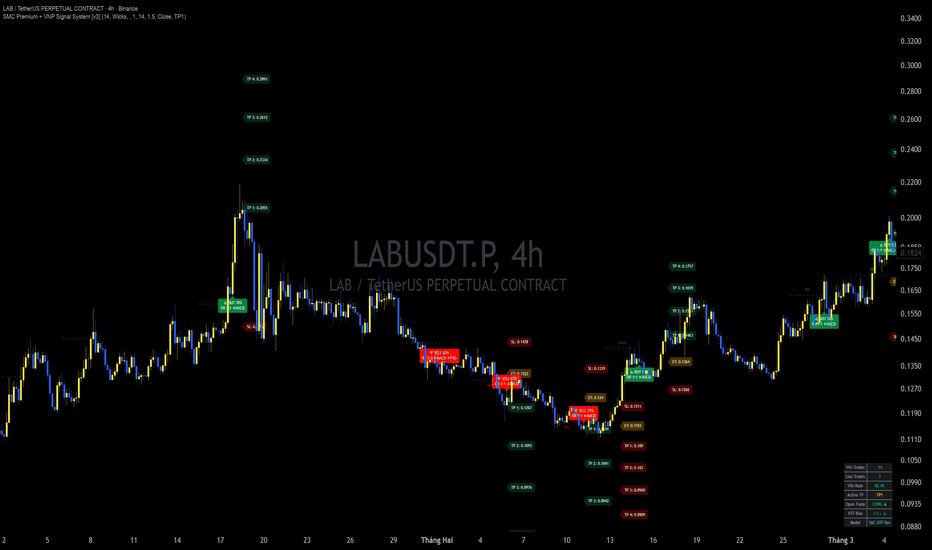
Hungpixi MACD Enhanced MTF with Signal Filter & Anti-SidewayDescription:
This is an enhanced multi-timeframe (MTF) MACD strategy for TradingView, built with signal filters, anti-sideway logic, and a detailed stats table. It identifies buy/sell opportunities with trend-following or counter-trend signals and provides Bybit-ready JSON alerts for automated trading.
Key Features:
Multiple signal modes: Buy Trend, Buy Counter, Sell Trend, Sell Counter, Strong Buy, Strong Sell. Toggle each signal type to suit your testing needs.
Anti-Sideway Filter: EMA 34 & 89 on 30-min chart plus ATR filter to eliminate sideways market noise.
Multi-Timeframe Analysis (MTF): Automatically calculates signals from higher timeframes and combines with current timeframe for more reliable entries.
Dynamic ATR Stop Loss: Stop-loss levels adapt to market volatility using ATR.
Visual Stats Table: Tracks Equity, Net %, Closed Trades, Win Rate, Profit, and Max Drawdown directly on the chart.
Bybit JSON Alerts: Fully formatted alerts for direct use with trading bots or alert systems.
Customizable Parameters:
- MACD Fast/Slow/Signal lengths
- Cross Score, Indicator Direction Score, Histogram Score
- ATR Stop Multiplier & Period
- EMA Periods, ATR Filter, Minimum ATR for entries
How to Use:
- Import the script into TradingView (Pine Script v6).
- Enable/disable the signal modes as needed.
- Set up JSON alerts to connect with Bybit or your trading bot.
- Monitor the stats table to evaluate strategy performance over time.
Notes:
Works on all TradingView symbols, especially crypto, forex, and stock markets. Always backtest thoroughly before trading live. Give feedback on adjustments for better performance in different markets or timeframes. Telegram contact: @hungpixi 策略

指标