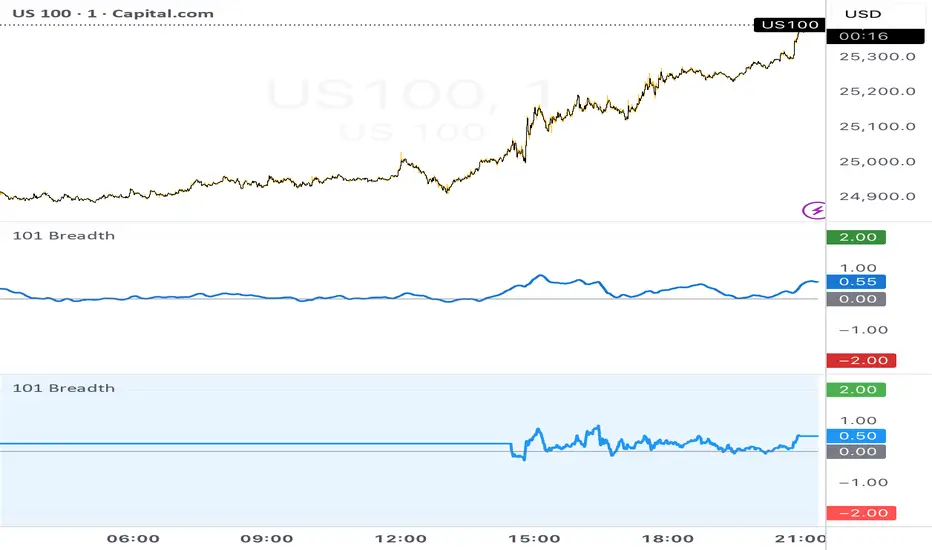
Multi-Indicator Screener: 30 Assets🎯 Multi-Indicator Screener: 30 Assets
Catagories:
Stocks & ETFs (default), Cryptocurrency, Commodities, Global Indices, or Custom.
Indicators:
RSI, MACD, EMA Slope, OBV Trend, Supertrend, VWAP, ADX/DMI, BB %B, Stoch RSI, Vol Delta
OVERVIEW
This indicator simultaneously monitors 30 customizable assets across a single chart panel, classifying each asset's momentum as Strong Bullish, Weak Bullish, Weak Bearish, or Strong Bearish — updated bar by bar. It does this across 10 selectable technical indicators, giving you a real-time breadth map of the entire market without switching charts.
Every asset is displayed as a horizontal color-coded zone stacked vertically, so you can read the mood of the full market in a single glance.
The screener is designed for traders who want to understand market-wide momentum — not just one symbol — so they can make higher-conviction decisions based on whether the broader market is confirming or diverging from their trade thesis.
Asset Categories & Watchlists
The screener includes 4 built-in asset categories that you can switch between instantly: Stocks & ETFs (default), Cryptocurrency, Commodities, and Global Indices. Each category loads a carefully curated list of 30 relevant tickers with meaningful group breakdowns in the detailed table (e.g., Mega Cap / Large Cap for crypto, Energy / Precious Metals for commodities, USA / Europe / Asia for global indices). You can also select Custom mode to manually enter any 30 symbols you want to monitor. This makes the indicator extremely versatile whether you trade stocks, crypto, futures, or international markets.
THE 10 INDICATOR MODES
You select one active indicator from the settings panel. That indicator is applied identically to all 30 assets simultaneously. The following describes exactly how each indicator classifies an asset into its four states:
RSI (Relative Strength Index)
The RSI is calculated using a user-defined length (default: 14 periods) and then compared against its own Simple Moving Average (default: 14-period SMA of the RSI).
Strong Bull — RSI is above both the 50 midline and its SMA
Weak Bull — RSI is above only one of those conditions
Strong Bear — RSI is below both the 50 midline and its SMA
Weak Bear — RSI is below only one of those conditions
This two-condition filter removes many of the false signals that a raw RSI threshold produces.
MACD (Moving Average Convergence Divergence)
Uses the standard MACD histogram (default 12/26/9).
Strong Bull — histogram is positive and increasing bar-over-bar (accelerating bullish momentum)
Weak Bull — histogram is positive but flat or declining
Strong Bear — histogram is negative and decreasing bar-over-bar (accelerating bearish momentum)
Weak Bear — histogram is negative but flat or recovering
The directional change of the histogram is the key differentiator here.
EMA Slope
Calculates a 20-period EMA and measures the actual geometric slope angle (in degrees), normalized against the asset’s 200-bar price range.
Formula: atan(ema_change / (pts_per_bar × slope_period)) × 180 / π
Strong Bull — slope angle ≥ Reference Angle (default: 45°)
Weak Bull — slope angle positive but below the threshold
Strong Bear — slope angle ≤ -Reference Angle
Weak Bear — slope angle negative but above the negative threshold
Tip: The default 45° is aggressive. Lower it to 10–15° for more frequent Strong signals. Includes division-by-zero protection for flat markets.
OBV Trend (On-Balance Volume)
Applies short and long moving averages to raw OBV (default Short=2, Long=14). MA type is user-selectable (SMA, EMA, SMMA, WMA, VWMA).
Strong Bull — short OBV MA > long OBV MA and long MA is rising
Weak Bull — short > long, but long MA is flat or declining
Strong Bear — short < long and long MA is declining
Weak Bear — short < long, but long MA is flat or rising
Pure volume-flow based momentum detection.
Supertrend
Uses Pine’s built-in Supertrend (default Factor=3.0, ATR Length=10).
Strong Bull — price above Supertrend line and rising (moving away)
Weak Bull — price above line but falling (drifting toward it)
Strong Bear — price below line and falling
Weak Bear — price below line but rising
VWAP (Volume Weighted Average Price)
Uses session VWAP (resets daily).
Best on intraday charts (1min–4H). On daily+ charts it only reflects that session’s VWAP.
Strong Bull — price > VWAP and rising
Weak Bull — price > VWAP but falling
Strong Bear — price < VWAP and falling
Weak Bear — price < VWAP but rising
ADX / DMI
Manual Wilder's calculation for independent ADX per asset (default threshold 25).
Strong Bull — +DI > -DI and ADX ≥ 25
Weak Bull — +DI > -DI but ADX < 25
Strong Bear — -DI > +DI and ADX ≥ 25
Weak Bear — -DI > +DI but ADX < 25
BB %B (Bollinger Band Percent B)
Shows where price sits inside the Bollinger Bands (default 20,2).
Strong Bull — %B ≥ 1.0 (above upper band)
Weak Bull — %B between 0.5 and 1.0
Strong Bear — %B ≤ 0.0 (below lower band)
Weak Bear — %B between 0.0 and 0.5
Stochastic RSI
Stochastic applied to RSI (defaults: RSI 14, Stoch 14, Smooth K=3, D=3).
Strong Bull — K > D and K > 50
Weak Bull — K > D or K > 50
Strong Bear — K < D and K < 50
Weak Bear — K < D or K < 50
Vol Delta
A bar-level volume delta approximation: normalized delta = (2×close − high − low) / (high − low). This value is smoothed with an EMA (default length 3) and ranges roughly from -1 to +1.
Strong Bull — smoothed delta > threshold (default 0.3) and accelerating upward
Weak Bull — smoothed delta > 0 but below threshold or decelerating
Strong Bear — smoothed delta < -threshold and accelerating downward
Weak Bear — smoothed delta < 0 but above -threshold or decelerating
This mode approximates institutional buying/selling pressure within each bar and becomes more accurate on higher-resolution charts.
THE VISUAL SYSTEM
Stacked Zone Layout: 30 horizontal step-lines with adjustable height and gap.
Streak-Based Color Intensity: Color strength reflects how many consecutive closed bars an asset has stayed in its current state.
4 Color Palettes: Classic, Colorblind Safe, Ice & Fire, Monochrome.
3 Color Styles: Standard, Traffic Light, Hue Shift.
Divergence Highlighting: Assets moving against the overall market are highlighted in gold (solid for strong, semi-transparent for weak).
Total Market Line: Thick line at the top showing aggregate market momentum.
Dashboard Table: Momentum score (0–100), market status (including true “MIXED”), counts with delta arrows, and optional detailed sector/group breakdown.
Mini Heatmap: Compact 30-cell color strip at the bottom with ticker labels.
ALERTS
Four configurable alerts (all individually togglable):
Strong Bullish momentum (minimum number of assets)
Strong Bearish momentum
Market sentiment shift
Extreme conditions (≥60% assets in Strong Bull or Strong Bear)
Alerts fire only on confirmed bars.
DEFAULT ASSETS
The built-in presets include Stocks & ETFs (default), Cryptocurrency, Commodities, and Global Indices. In “Stocks & ETFs” mode you get a balanced mix of broad market, sectors, Magnificent 7, key stocks, thematic, and macro assets. All 30 tickers are fully customizable.
INTENDED USE
This is a market breadth and momentum classification tool, not a direct signal generator. Use it to:
Confirm broad market support for your trade direction
Spot early sector rotation
Identify diverging assets
Compare how different indicators are reading the same market
Time entries/exits based on momentum score and delta changes
Works on any timeframe. For best results with VWAP and Vol Delta, prefer intraday charts. 指标

指标

指标

指标
指标

指标

Swing + Value Setup [Marcos]Swing + Value Setup — Descripción para TradingView
Título sugerido
Swing + Value Setup — Multi-Filter Entry Signal
Descripción (inglés — recomendado para mayor alcance)
🎯 What is this indicator?
Swing + Value Setup is a multi-condition entry filter designed for swing traders looking for high-quality setups in stocks with strong technical and structural foundations. Instead of relying on a single signal, this indicator requires 6 simultaneous conditions to be met before printing an entry label — dramatically reducing false signals and noise.
It also features a real-time status panel that shows exactly which conditions are passing or failing on any given bar, so you always know how close a setup is to triggering.
⚙️ How it works
The indicator combines trend, momentum, volume, and structure analysis into a single unified signal:
✅ 6 Required Conditions (all must be true simultaneously):
Price above EMA 200 — confirms the stock is in a long-term uptrend
Supertrend bullish — active trend filter, eliminates choppy/sideways markets
RSI between 40–55 — entry during healthy pullback, not extreme oversold
MACD signal — bullish crossover OR histogram rising below zero (momentum recovering)
OBV above its EMA — confirms institutional accumulation behind the move
Pullback to EMA 21 or EMA 50 (±1.5%) — optimal entry zone, not chasing price
⭐ High Conviction Bonus:
When a bullish RSI divergence is also detected (price making lower lows while RSI makes higher lows), the label upgrades to a High Conviction signal — historically the strongest setups.
📊 Visual elements
EMA 21 / 50 / 200 plotted directly on price
Supertrend line changes color with trend direction
Green background shading when a valid setup is active
Brighter shading for high conviction entries
Labels printed at signal candles (standard ✅ or high conviction 🎯)
Status table (top-right corner) showing live ✅/❌ for each condition
🔔 Built-in Alerts (3 total)
AlertTriggerSetup Swing/ValueAll 6 conditions met for the first timeSetup ALTA CONVICCIÓN ⭐Full setup + RSI divergence confirmedDivergencia RSI BullishBullish divergence in uptrend (early warning)
Set alerts from the indicator menu → Add Alert → select the condition.
🕐 Recommended Timeframes
TimeframePurposeWeeklyOverall bias and macro structureDailyPrimary signal timeframe (recommended)4H / 1HEntry timing and fine-tuning
Best results on Daily charts for swing positions of 5–30 days.
📐 Trade Management (suggested)
Stop Loss: Below the signal candle low or EMA 50
Target 1: Prior resistance / VPVR high-volume node
Target 2: Fibonacci 1.272 or 1.618 extension
Minimum R:R: 1:2.5
⚠️ Disclaimer
This indicator is a technical analysis tool only. It does not constitute financial advice. Always manage your risk, use stop losses, and do your own research before entering any trade. Past performance of any indicator does not guarantee future results.
Descripción (español — versión alternativa)
🎯 ¿Qué es este indicador?
Swing + Value Setup es un filtro de entrada multi-condición diseñado para swing traders que buscan setups de alta calidad en acciones con estructura técnica sólida. En lugar de depender de una sola señal, el indicador exige que 6 condiciones se cumplan simultáneamente antes de generar una señal — reduciendo drásticamente las falsas entradas y el ruido del mercado.
Incluye un panel de estado en tiempo real que muestra exactamente qué condiciones están activas o fallando en cualquier vela, para que siempre sepas qué tan cerca está un setup de activarse.
⚙️ Cómo funciona
✅ 6 Condiciones obligatorias (todas deben cumplirse a la vez):
Precio sobre EMA 200 — confirma tendencia alcista de largo plazo
Supertrend alcista — filtra mercados laterales y tendencias bajistas
RSI entre 40 y 55 — entrada en pullback sano, sin sobreventa extrema
Señal MACD — cruce alcista O histograma subiendo bajo cero
OBV sobre su media — confirma acumulación institucional detrás del movimiento
Pullback a EMA 21 o EMA 50 (±1.5%) — zona de entrada óptima sin perseguir precio
⭐ Bonus Alta Convicción:
Cuando además se detecta una divergencia bullish en RSI (precio haciendo mínimos más bajos mientras el RSI hace mínimos más altos), la señal se convierte en Alta Convicción — históricamente los setups más fuertes.
🔔 Alertas incluidas
Setup Swing/Value — cuando se cumplen las 6 condiciones
Setup Alta Convicción ⭐ — setup completo + divergencia RSI
Divergencia RSI Bullish — aviso temprano de posible giro
⚠️ Aviso legal
Este indicador es únicamente una herramienta de análisis técnico. No constituye asesoramiento financiero. Gestiona siempre tu riesgo y realiza tu propio análisis antes de operar.
swing trading value ema supertrend rsi macd obv multi-condition stocks entry signal divergence trend following pullback screener alerts 指标

指标

指标

指标

指标

Skyline Ventures SMI//@version=5
// Stochastic Momentum Index
// Author: Surjith S M (sudia arabia)
// Copyright: CC 3.0
// Thanks MR:Ahmed Moussa
// Release: v2.1
indicator("Stochastics Momentum Index", shorttitle = "Skyline_SMI")
// Input parameters
a = input.int(10, "Percent K Length", minval=1)
b = input.int(3, "Percent D Length", minval=1)
c = input.int(10, "EMA Signal Length", minval=1)
smooth_period = input.int(5, "Smoothing Period", minval=1)
ob = input.float(40, "Overbought", minval=-100, maxval=100)
os = input.float(-40, "Oversold", minval=-100, maxval=100)
// Range Calculation
ll = ta.lowest(low, a)
hh = ta.highest(high, a)
diff = hh - ll
rdiff = close - (hh+ll)/2
avgrel = ta.ema(rdiff, b)
avgdiff = ta.ema(diff, b)
// SMI calculations
SMI = avgdiff != 0 ? (avgrel/(avgdiff/2)*100) : 0.0
// Apply smoothing to SMI
SMI_smoothed = ta.sma(SMI, smooth_period)
SMIsignal = ta.ema(SMI_smoothed, b)
emasignal = ta.ema(SMI_smoothed, c)
// Plotting
plot(SMI_smoothed, "Stochastic", color=color.rgb(154, 157, 167))
plot(emasignal, "EMA", color=color.red)
h0 = hline(ob, "Overbought", color=color.gray)
h1 = hline(os, "Oversold", color=color.gray)
level_ob = ob
level_obsmi = SMI_smoothed > level_ob ? SMI_smoothed : level_ob
level_os = os
level_ossmi = SMI_smoothed < level_os ? SMI_smoothed : level_os
p1 = plot(level_ob, display=display.none)
p2 = plot(level_obsmi, display=display.none)
p3 = plot(level_os, display=display.none)
p4 = plot(level_ossmi, display=display.none)
fill(p1, p2, color=color.new(color.red, 60), title='OverBought')
fill(p3, p4, color=color.new(color.green, 60), title='OverSold') 指标

指标

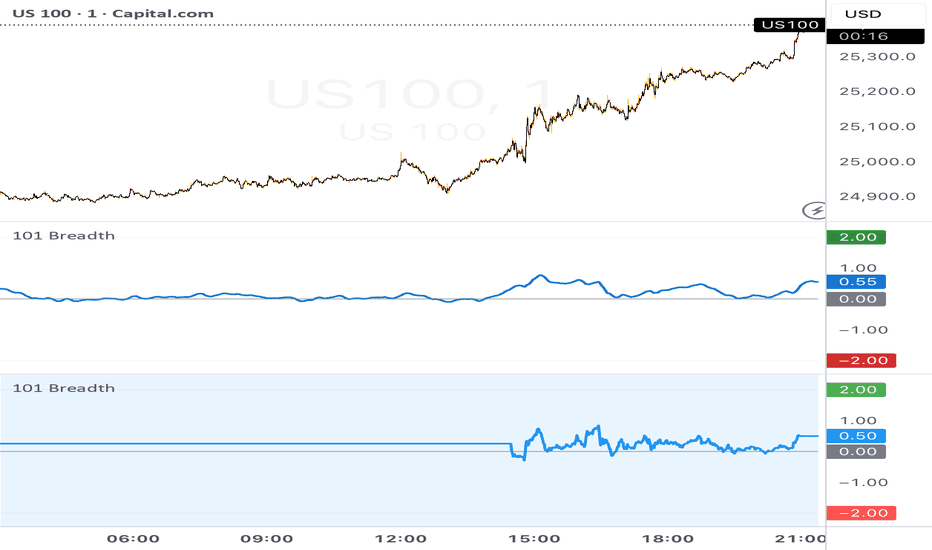
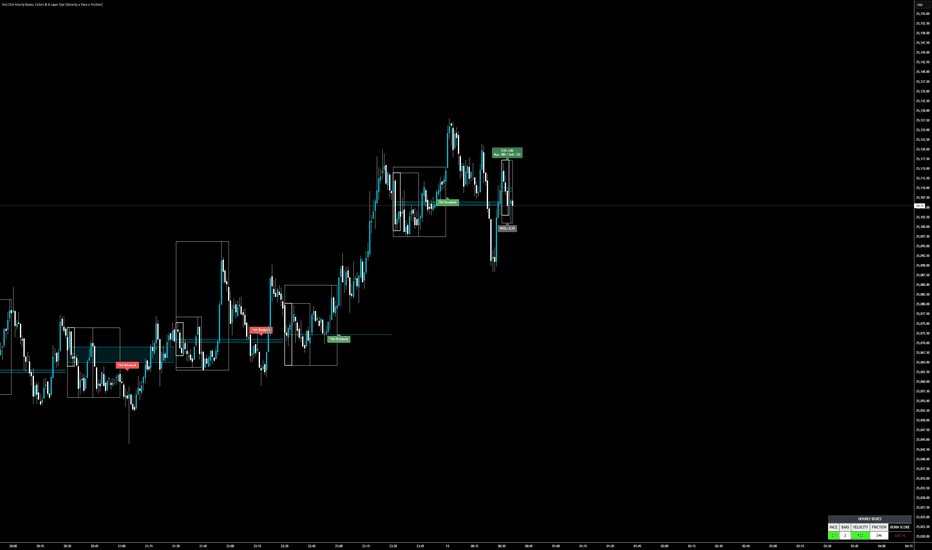
Hourly Structure Boxes & VolumeThis indicator merges micro-session market structure with a localized volume kinematics engine. By anchoring opening range boxes (5m, 15m, and 30m) to a strict hourly cycle, it allows traders to visualize initial balance boundaries while simultaneously measuring the order flow effort required to break out of them.
Core Logic & Mechanics
This script resolves the common issue of Cumulative Volume Delta (CVD) "drifting" over time by forcing it to reset at specific structural boundaries. The mashup of visual price boxes and volume data is justified because the volume calculations are strictly dependent on the structure for their anchor points.
Hourly Micro-Boxing: At the start of every hour, the script begins drawing three nested ranges: the first 5 minutes, 15 minutes, and 30 minutes. It calculates the midlines of the 5m and 15m ranges and highlights the space between them as a "Midline Zone," projecting it forward to the end of the hour as a critical area of structural gravity.
Dynamic CVD Resets: The CVD engine does not run continuously. It resets at the top of the hour, at the completion of each micro-box (5m, 15m, 30m), AND dynamically if the price touches the extended 5m or 15m midlines. This ensures the volume delta is always measuring the immediate push off a structural level.
3-Stage Breakout Engine: The script actively monitors the 15-minute box for a specific exhaustion-breakout pattern. It requires three stages to trigger a signal:
Stage 1: Price wicks or touches outside the 15m box boundary.
Stage 2: Price retreats back inside the 15m box.
Stage 3: A subsequent candle strictly closes outside the box. Only then does it print a "15m Breakout" label, filtering out standard liquidity sweeps.
Volume Kinematics Dashboard: The lower dashboard calculates proprietary metrics:
Pace: Total points moved divided by the bars elapsed since the last structure reset.
Velocity: CVD divided by bars elapsed.
Friction: Absolute Velocity / Absolute Pace. Measures absorption (how much volume is being burned for minimal point gain).
Burn Score: A localized exhaustion metric adjusted by an Auto-Session Divisor to normalize values between the main New York session and overnight trading.
How to Use It
Designed primarily for scalping volatile indices like the Nasdaq 100 on lower timeframes (1m to 5m), this tool provides actionable data for mean-reversion and breakout trading.
Trading the 15m Breakout: Wait for the 3-stage breakout label to print. Before entering, check the dashboard's "Velocity" and "Friction." If the breakout label prints with high Velocity and low Friction, it signals genuine momentum.
Midline Zone Bounces: If price enters the shaded cyan 5m-15m Midline Zone, watch for the CVD reset. If the reset immediately shows heavy opposing volume (a spike in Pace and Velocity in the opposite direction), the midline zone is defending successfully, offering a tight-risk entry back toward the hourly box extremes.
Friction Exhaustion: If price is pushing against the 30-minute box boundary but the dashboard shows extreme "Friction" and a high "Burn Score" (turning purple or red), the move is being absorbed by limit orders. This is a setup for a fade/reversal back to the midlines. 指标
指标
指标
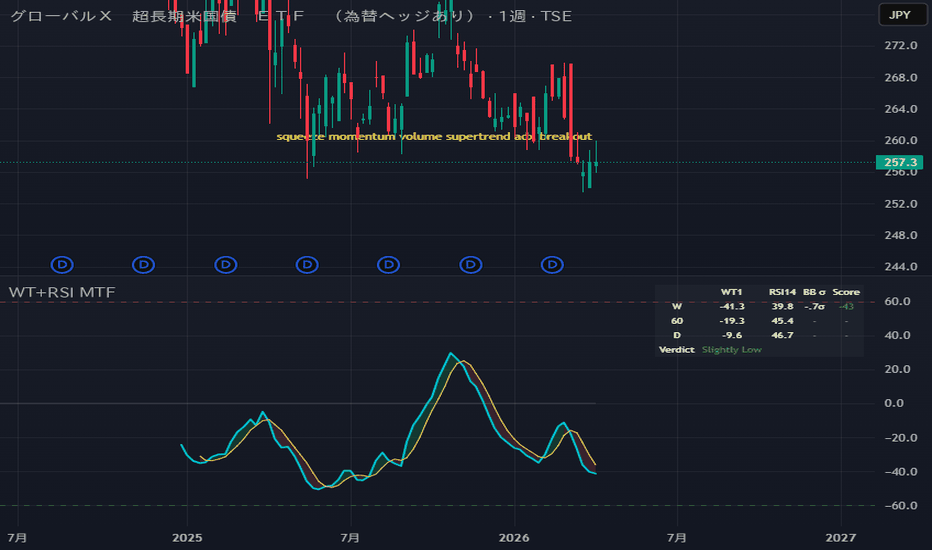
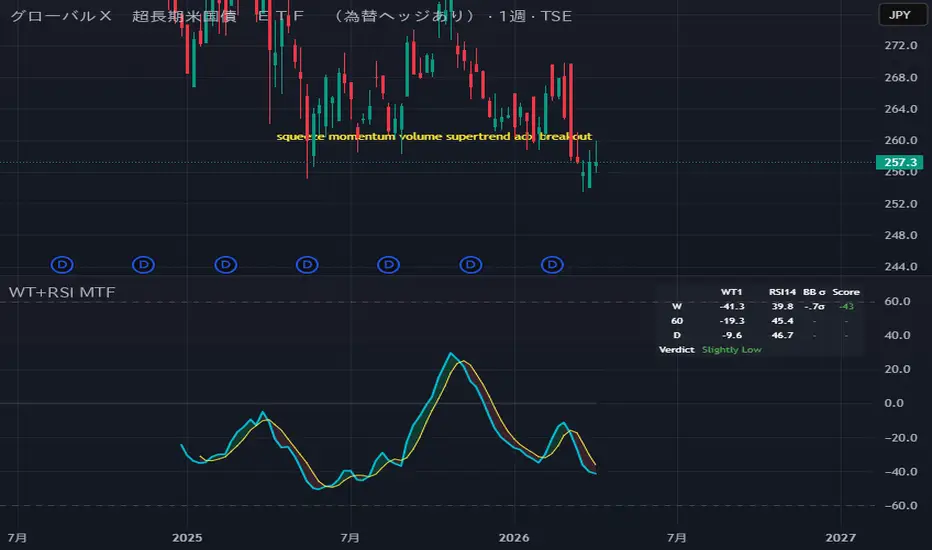
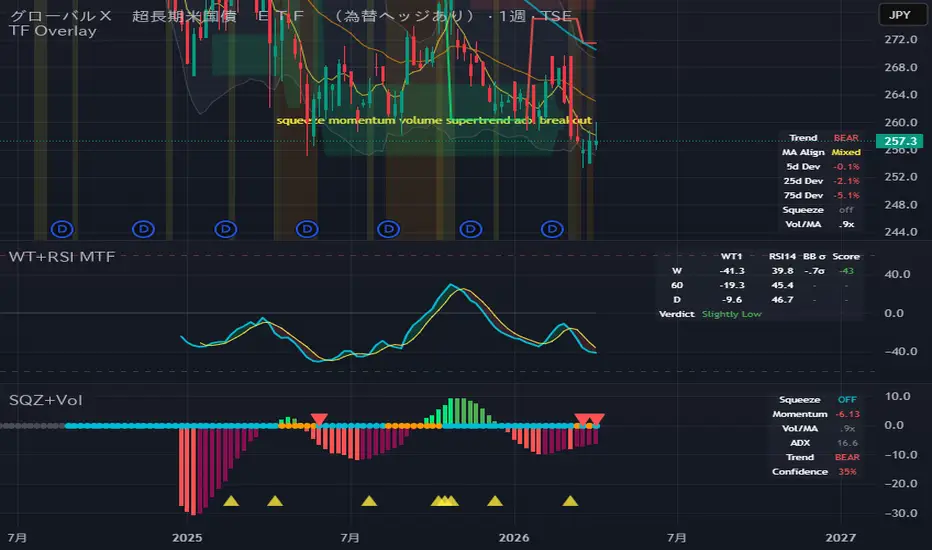
Squeeze Momentum Enhanced [TechnoFunda] Squeeze Momentum with integrated Volume Surge detection, Supertrend directional filter, and
ADX trend strength — unified in a single panel with a composite confidence score.
VOLUME SURGE DETECTION — Flags bars where current volume exceeds the 5-day moving average by a configurable multiplier (default 2x). Volume expansion during a squeeze is one of the most reliable precursors to a breakout.
SUPERTREND + ADX FILTER — ATR-based trend direction combined with ADX trend strength scoring. Reduces false signals by requiring both directional alignment and sufficient trend momentum.
CONFIDENCE SCORE (0-100%) — Proprietary composite metric derived from six independent factors: momentum direction, acceleration, squeeze release timing, volume expansion, Supertrend alignment, and ADX confirmation.
REAL-TIME DASHBOARD — Displays Squeeze status, Momentum value, Volume ratio, ADX reading, Trend direction, and Confidence score at a glance.
Alerts: Buy / Strong Buy / Sell / Volume Surge during Squeeze
Built on the Squeeze Momentum concept originally developed by LazyBear, with substantial
enhancements for institutional-grade signal quality.
Pro version with full integration available — follow for updates. 指标

指标

指标

指标

指标

指标

指标