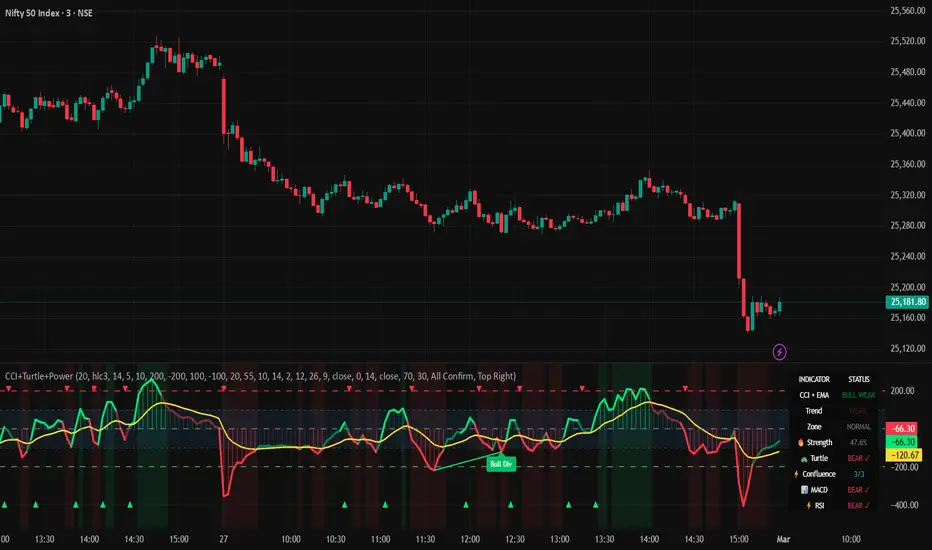
Sassy CCI: Reversion, Divergence, & CompressionSassy CCI
Reading the Mood Behind Price
1. CCI (Commodity Channel Index). At its simplest, CCI measures **how far price has moved away from its normal average**.
Why I like CCI? I believe CCI often **moves before the larger price move becomes obvious**.
That makes it difficult to use CCI alone for traditional alerts—because it can move quickly and create signals before price has actually confirmed anything.
But that same characteristic makes CCI extremely useful for:
* 👀 **Seeing movement early**
* ⚡ **Scalping**
* 🔄 **Spotting reversals**
* 📦 **Recognizing compression**
* 🧠 **Understanding the relationship between momentum and price**
That is where **Sassy CCI** comes in.
---
2. Why "Sassy"?
Stock trading is ultimately about **psychology**.
Price moves because people make emotional decisions about the future.
Someone thinks:
> "This is going higher."
They buy.
Someone else thinks:
> "This move is over."
They sell.
Fear, confidence, excitement, uncertainty, greed, hesitation and exhaustion all become reflected in the movement of price.
So instead of looking at CCI as simply **overbought or oversold**, I wanted to think about it differently:
### What mood is the market in right now?
Sassy CCI combines CCI, price movement, compression and divergence with additional formulas designed to focus on the **important moments where that relationship changes.**
It isn't designed to predict the future.
It is designed to help **confirm what the market is already beginning to reveal.**
---
3. The Six Moods
### 🔵 CALM
**"Nothing important is happening yet."**
Price and momentum aren't showing a strong relationship or developing pressure.
**Response:**
🧘 **Wait.**
Don't force a trade just because the market is moving.
---
### 🟦 BUILDING
**"Something is starting to develop."**
Price is becoming compressed and conditions are tightening.
Think of it like a spring beginning to load.
**Response:**
👀 **Watch closely.**
This isn't necessarily the entry.
It means the market may be preparing for a larger move.
---
### ⭐ INTENSE
**"Pressure is building inside compression."**
The market has entered a significant compression state.
Price isn't necessarily moving much yet—but something is happening underneath the surface.
**Response:**
🎯 **Prepare for expansion.**
Watch for price, CCI and other confirmation to agree on the direction of the eventual move.
---
### 🩷 GROOVING
**"Price and momentum are working together."**
This is alignment.
Price and CCI are moving in the same general direction rather than fighting each other.
**Response:**
➡️ **Look for continuation.**
This can be especially useful for scalping because the momentum and price action are cooperating.
---
### 🟧 AGITATED
**"Price and momentum aren't agreeing."**
This is where things get interesting.
Price may be moving one way while CCI is telling us something different.
That disagreement can indicate:
* ⚠️ weakening momentum
* 🔄 a possible reversal
* 🪤 a failed move
* ⏳ a move that needs confirmation
**Response:**
🛑 **Slow down.**
Don't chase the move.
Look for confirmation before entering—or consider whether the current move is losing strength.
---
### 🔴 EXHAUSTED
**"The pressure has reached an extreme."**
This corresponds with the strongest pressure zone in Sassy CCI.
The move may still continue, but the market is showing signs that the current emotional push has become extreme.
**Response:**
🔄 **Look for a reaction.**
This is where reversal setups become especially interesting.
---
# 4. The Big Picture
Sassy CCI isn't saying: BUY or SELL.
Instead, it asks: "What is the market doing—and how are momentum and price responding to each other?"
Think of the moods as a progression:
**🔵 CALM**
↓
**🟦 BUILDING**
↓
**⭐ INTENSE**
↓
**🩷 GROOVING**
↓
**🟧 AGITATED**
↓
**🔴 EXHAUSTED**
The indicator is not trying to force a story onto the market.
It is trying to help identify **when the market's behavior changes.**
---
# 5. How I Use It
My goal isn't to use Sassy CCI as a standalone trading system.
I use it as a **confirmation tool**.
I want price action, important levels and Sassy CCI to tell a similar story.
Sassy CCI Alerts
---
# The Most Important Rule
### Don't trade the alert.
### Investigate the alert.
Sassy CCI is designed to **get my attention at important moments.**
Once it does, I look at:
**1. Price action**
**2. Key levels**
**3. Volume / participation**
**4. Market direction**
**5. Sassy CCI confirmation**
The indicator helps answer:
> **"Is something important happening right now?"**
Price action helps answer:
> **"Is there actually a trade here?"**
---
# A Simple Hierarchy
If I had to simplify the entire alert system:
| Signal | Attention Level | My Response |
| ----------------------- | --------------: | --------------------- |
| 🔵 Calm / no alert | Low | Wait |
| 🟦 Compression Start | Medium | Start watching |
| ⭐ Compression / Intense | High | Prepare |
| 🟢 Compression Bias | High | Watch that direction |
| 🩷 Grooving | High | Look for continuation |
| 🟧 Agitated | High | Be cautious |
| 🟡 Pressure 1 | Medium | Momentum increasing |
| 🟠 Pressure 2 | High | Momentum is intense |
| 🔴 Pressure 3 | Very High | Watch for exhaustion |
| 🔄 Divergence | High | Look for a change |
| ⭐ Divergence+ | Very High | Look for confirmation |
### The goal isn't more alerts.
The goal is **better attention.**
Sassy CCI is designed to reduce the amount of time I spend staring at charts and increase the chance that I look at the chart **when something meaningful is developing.**
指标

CCI Divergence Volume Breakout [josseliani]CCI Divergence Volume Breakout combines confirmed CCI divergence with a relative-volume candle level. It waits for a confirmed close beyond that candle's high or low before displaying a BUY or SELL signal, and it can optionally map Entry, a volume-candle-based stop, 1R, and historical R-reach statistics.
The default settings are tuned for XAUUSD on the 7-minute chart, but the indicator can be adapted to other instruments and timeframes. The statistics dashboard updates for the current symbol, timeframe, loaded chart history, and selected inputs, making it easy to see how different settings affect the sample size and historical R-reach rates.
→ HOW I USE IT
The default settings are the configuration I currently use for XAUUSD on the 7-minute chart.
Seven minutes is the favorite timeframe of my wonderful wave-analysis teacher. I built this version around the way he studies the market: first CCI divergence, then a meaningful volume spike. After that, he moves on to his own wave-analysis methods, including trendlines, wave count, structure, and broader market context. This indicator does not reproduce or replace his complete method. I use it as a supporting tool within my own wave analysis.
With the default settings, the script first searches for a confirmed CCI divergence. It then selects a qualifying volume candle connected to that divergence. The first search covers the divergence span; if necessary, it checks the area around the second pivot and then watches the post-confirmation candidate window. A qualifying candle must have volume of at least 1.5 times its 20-bar average.
For a bullish divergence, the high of the selected volume candle becomes the confirmation level. A BUY signal appears only after a candle closes above that high within the permitted breakout window.
For a bearish divergence, the low of the selected volume candle becomes the confirmation level. A SELL signal appears only after a candle closes below that low within the permitted breakout window.
The optional trade map starts from the open of the candle after the signal. It displays an Entry line, a stop behind the opposite edge of the exact volume candle plus the selected ATR delta, and a 1R reference target.
I use the dashboard to compare configurations rather than to treat one historical percentage as a promise. For example, changing the minimum volume multiple, pivot-matching radius, maximum distance between pivots, candidate-search window, or breakout window changes how often historical observations reached 0.5R, 1R, 2R, and 3R. This helps me see the trade-off between signal selectivity and historical excursion.
→ HOW THE INDICATOR WORKS
→ 1. Automatic CCI pivot scan
The script evaluates confirmed CCI pivots using strengths 3, 5, 7, and 9. The first pivot must be beyond the selected extreme threshold. The second pivot may form closer to the center of the oscillator.
A bullish divergence requires price to form a lower low while CCI forms a higher low. A bearish divergence requires price to form a higher high while CCI forms a lower high.
CCI pivots require bars on the right to become confirmed. For that reason, divergence lines are anchored to their historical pivot candles only after confirmation. They do not represent information that was available on the original pivot candle. BUY and SELL signals are evaluated only on confirmed closes after the divergence has been confirmed.
→ 2. Price-pivot matching
CCI and price do not always turn on exactly the same candle. Price Pivot Match Radius searches on both sides of each CCI endpoint for the corresponding price high or low.
Maximum Price/CCI Span Difference then checks that the two price pivots and the two CCI pivots describe approximately the same market swing. Lower values require tighter alignment; higher values allow more flexibility.
→ 3. Relative-volume candle selection
When a divergence becomes confirmed, the script first searches its pivot-to-pivot span for qualifying volume candles and selects the qualifying candle with the greatest reported volume. If that search finds none, it also checks the area around the second pivot. Search After Divergence then defines how many new bars after confirmation may supply a qualifying candidate. Volume is measured relative to its moving average:
Relative volume = candle volume / average volume
The default requirement is 1.5 times the 20-bar average. Candle direction is not used. For a bullish setup, the selected candle's high becomes the level. For a bearish setup, its low becomes the level.
Maximum Candidates controls how many qualifying volume levels one divergence may create. You can use up to three qualifying volume-candle candidates for each confirmed divergence. The default is one to keep the chart and signal source unambiguous. With this default, an already selected historical candidate fills the single slot; otherwise, the first qualifying post-confirmation candidate can fill it.
→ 4. Breakout confirmation and signal window
The volume level begins as gray. It changes to the bullish or bearish color only when price closes beyond it on a confirmed candle:
Bullish divergence: confirmed close above the selected volume candle's high.
Bearish divergence: confirmed close below the selected volume candle's low.
Breakout Signal Window defines how many bars that exact volume level is permitted to produce a BUY or SELL signal. The count begins when the level is created. Once the window expires, the level cannot trigger a late signal and cannot add a late observation to the statistics.
→ 5. Expired levels
Keep Expired Levels Visible separates signal validity from visual analysis.
When it is enabled, an unbroken level continues as a gray reference after its signal window expires. The expired line is visual only: it cannot produce a BUY or SELL signal and is not reactivated by a new calendar day, exchange day, or session. It remains visible until a newer qualifying volume level replaces it.
When Keep Expired Levels Visible is disabled, the gray line ends when its breakout signal window expires.
This indicator does not carry or re-arm levels according to a calendar boundary or timezone.
→ OPTIONAL TRADE MAP
The trade map is a visual measurement tool, not an automated order-placement system.
Entry: open of the candle following the confirmed BUY or SELL signal.
Stop: opposite edge of the exact volume candle that produced the signal, plus the selected ATR delta.
1R: one initial-risk unit from Entry.
The map helps compare the signal with the user's own execution, market structure, and risk plan. It is not financial advice and does not account for spread, slippage, commissions, or individual position sizing.
→ STATISTICS DASHBOARD
The dashboard reports historical reach rates for the current symbol, timeframe, loaded chart history, and selected inputs. It is designed for configuration comparison.
Completed: observations that reached the stop, reached 3R, or reached the maximum evaluation window.
Reached >=0.5R: completed observations whose maximum favorable excursion reached at least half of the initial risk.
Win Rate >=1R: completed observations that reached at least 1R before the stop.
Reached >=2R / >=3R: completed observations that reached those excursion levels before the stop.
Average MFE: average maximum favorable excursion, expressed in R, across completed observations.
Active / Invalid: observations still being evaluated and observations rejected because a valid positive risk distance could not be constructed.
Only breakouts confirmed while their volume level is inside its active signal window create statistical observations. An expired gray reference does not create a trade in the dashboard.
If the stop and a target fall inside the same historical candle, the script gives the stop priority because OHLC data cannot reveal the intrabar sequence. This is intentionally conservative.
These figures are descriptive historical measurements, not a backtest equity curve, not a profit factor, and not a forecast of future results. They can change with the data provider, symbol, timeframe, available history, and settings.
→ DEFAULT XAUUSD 7-MINUTE PRESET
CCI Length: 20
CCI Source: Typical Price (HLC3)
First Pivot Extreme Level: +/-150
Maximum Bars Between Pivots: 60
Price Pivot Match Radius: 7
Maximum Price/CCI Span Difference: 35%
Volume Average Length: 20
Minimum Volume x Average: 1.5
Search After Divergence: 15 bars
Maximum Candidates per Divergence: 1
Breakout Signal Window: 40 bars
Keep Expired Levels Visible: On
Show Entry / SL / 1R Markup: On
→ ALERTS
Bullish CCI Divergence: fires when a bullish divergence becomes confirmed.
Bearish CCI Divergence: fires when a bearish divergence becomes confirmed.
CCI Volume Long Signal: fires after a confirmed close above an active bullish volume level.
CCI Volume Short Signal: fires after a confirmed close below an active bearish volume level.
→ ORIGINALITY
This script is not a standard CCI divergence plot and not a generic volume-spike marker. Its purpose is to connect four separate stages in one workflow: multi-strength confirmed CCI divergence, price-pivot alignment, relative-volume candle mapping, and close-confirmed breakout authorization.
Candidate search, signal lifetime, visual reference lifetime, trade measurement, and historical R-reach analysis are kept separate. This makes it possible to change one part of the workflow and see how it affects signal frequency and the historical statistics without confusing an expired visual level with an active signal source.
→ LIMITATIONS
CCI, volume, and divergence are analytical tools, not guarantees of reversal or continuation. Pivot confirmation introduces an intentional delay. Historical volume and results can differ between data providers. Signals should be evaluated with market structure, liquidity, volatility, wave context, and personal risk management. The default preset was developed for how I analyze XAUUSD on 7 minutes; other markets and timeframes require independent testing.
指标

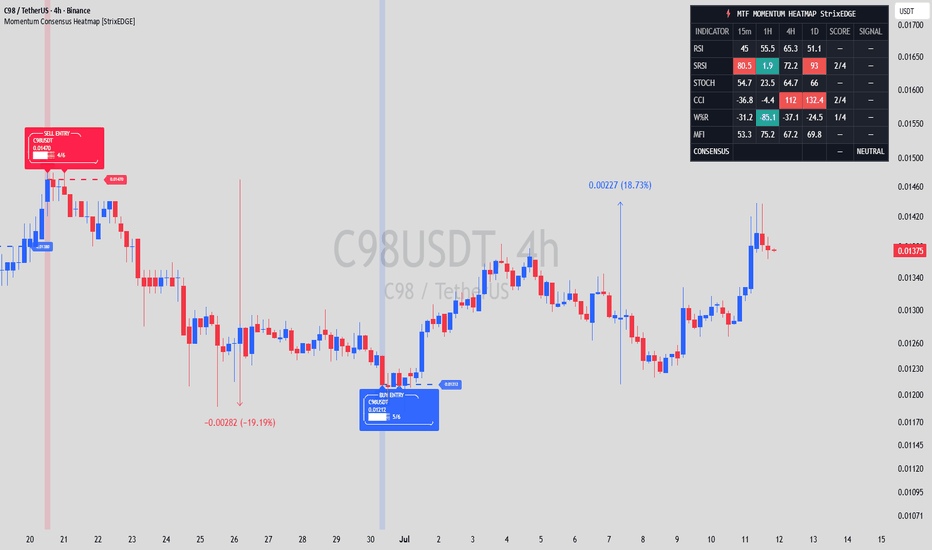
Momentum Consensus Heatmap [StrixEDGE]█ MOMENTUM CONSENSUS HEATMAP
A multi-timeframe momentum aggregation system that scans 6 oscillators across 4 customizable timeframes and fires high-conviction BUY/SHORT signals only when a critical mass of indicators reach overbought or oversold consensus simultaneously.
█ CONCEPT
Most momentum-based strategies rely on a single oscillator on a single timeframe — a setup prone to false signals and noise. This indicator solves that by requiring cross-timeframe and cross-indicator agreement before generating a signal.
The core logic works in two layers:
Layer 1 — Timeframe Consensus (per indicator):
Each oscillator is evaluated across 4 timeframes (default: 15m, 1H, 4H, 1D). An indicator only qualifies as "Overbought" or "Oversold" when at least 3 out of 4 timeframes agree (configurable: 2/4, 3/4, or 4/4).
Layer 2 — Indicator Consensus (overall signal):
A chart signal fires only when a user-defined number of indicators (default: 4 out of 6) have all independently reached Layer 1 consensus in the same direction.
This dual-filter architecture dramatically reduces noise and isolates moments of genuine, broad-based momentum exhaustion.
█ OSCILLATORS USED
• RSI (Relative Strength Index) — Classic momentum oscillator measuring speed and magnitude of price changes. Default OB/OS: 70/30.
• Stochastic RSI — Stochastic formula applied to RSI values, more sensitive to short-term momentum shifts than raw RSI. Default OB/OS: 80/20.
• Stochastic Oscillator — Compares closing price to the high-low range over a lookback period. Independent from Stoch RSI. Default OB/OS: 80/20.
• CCI (Commodity Channel Index) — Measures deviation from the statistical mean. Unbounded, making it useful for detecting extreme momentum. Default OB/OS: +100/−100.
• Williams %R — Reflects where the current close sits relative to the highest high. Inverted scale (−100 to 0). Default OB/OS: −20/−80.
• MFI (Money Flow Index) — Volume-weighted RSI. Adds a volume confirmation dimension that pure price-based oscillators lack. Default OB/OS: 80/20.
█ HEATMAP TABLE
The on-chart heatmap table provides a real-time dashboard of all 24 data points (6 indicators × 4 timeframes):
• Each cell shows the live oscillator value with color-coded background:
🔴 Red = Overbought zone
🟢 Green = Oversold zone
⚫ Gray = Neutral
• SCORE column shows how many timeframes agree for each indicator (e.g., "3/4 OB").
• SIGNAL column shows whether that individual indicator has reached consensus ("SHORT ▼" / "BUY ▲" / "—").
• CONSENSUS row at the bottom shows the overall verdict with a percentage score of indicator agreement.
Table position and text size are fully customizable through the settings panel.
█ CHART SIGNALS
When the overall consensus threshold is met:
▲ Green triangle below bar = BUY signal (oversold consensus)
▼ Red triangle above bar = SHORT signal (overbought consensus)
Signals fire only on the first bar of a new consensus event (no repeated signals while conditions persist). A subtle background color flash highlights the signal bar.
█ OPTIONAL TREND FILTER (EMA)
When enabled, signals are filtered by an EMA trend bias:
• BUY signals require price above the EMA (buying in an uptrend)
• SHORT signals require price below the EMA (shorting in a downtrend)
This is disabled by default to keep the indicator pure momentum-based, but can significantly improve signal quality in trending markets.
█ SETTINGS OVERVIEW
⏱ Timeframes — All 4 timeframes are independently configurable.
⚙ Indicator Lengths — Full control over each oscillator's lookback period.
📊 OB/OS Thresholds — Adjust overbought/oversold levels for every oscillator independently.
🎯 Signal Rules:
• Min TF Consensus: How many timeframes must agree per indicator (2-4, default 3).
• Min Indicators: How many indicators must reach consensus for a chart signal (1-6, default 4).
🎨 Table Appearance — Position, size, and full color customization (OB color, OS color, neutral, header, text).
🔔 Alerts — Native TradingView alerts with detailed messages including ticker, timeframe, and consensus count.
█ HOW TO USE
1. Apply the indicator to any chart (works on all instruments and timeframes).
2. The heatmap table updates in real time — use it as a momentum dashboard.
3. Watch for chart signals:
• When 4+ indicators show oversold consensus across 3+ timeframes → BUY signal.
• When 4+ indicators show overbought consensus across 3+ timeframes → SHORT signal.
4. Set up TradingView alerts to get notified when signals fire.
5. For higher conviction:
• Increase "Min Indicators" to 5 or 6 (fewer but stronger signals).
• Require 4/4 timeframe agreement instead of 3/4.
• Enable the EMA trend filter.
█ IMPORTANT NOTES
• This indicator uses request.security() to fetch multi-timeframe data. On the current timeframe, values update in real time. Higher timeframe values reflect the last closed bar of that timeframe.
• Signals are non-repainting once the bar closes. Intrabar, the table values and potential signals update as new ticks arrive (expected behavior for a real-time dashboard).
• This tool is designed for identifying momentum exhaustion zones. It does not predict direction — use it in confluence with price action, support/resistance, and your broader trading plan.
• Past performance is not indicative of future results. Always use proper risk management.
█ CREDITS & LICENSE
Open source under Mozilla Public License 2.0.
Built with Pine Script™ v6. 指标
指标

Hybrid OscillatorHybrid Oscillator
Hybrid Oscillator is a visual oscillator designed to read momentum pressure, overbought conditions, oversold conditions, oscillator crosses, extreme zones and directional fading inside a separate chart pane.
the indicator combines a selected oscillator engine with a smoothed wave, a secondary cross line, gradient zones, level dots and alert conditions.
the goal is to help traders understand when momentum is expanding, when it is reaching an extreme area, when it is cooling down, and when the main oscillator line crosses its reference line.
this tool is not a trading strategy. it does not place trades, does not guarantee reversals and does not predict future price movement. it is a technical analysis tool for market context, momentum reading and visual confirmation.
main concept
the oscillator moves between 0 and 100.
values near the upper zone show stronger upside pressure or overbought conditions.
values near the lower zone show stronger downside pressure or oversold conditions.
the main oscillator line is the active momentum wave.
the real cross line is a smoother reference line.
when the main oscillator crosses above the real cross line, momentum may be recovering or shifting upward.
when the main oscillator crosses below the real cross line, momentum may be weakening or shifting downward.
what the indicator displays
main oscillator line
real cross line
upper and lower gradient zones
overbought level
oversold level
extreme overbought level
extreme oversold level
mid upper level
mid lower level
top extreme dots
bottom extreme dots
real cross dots
level lines
alert conditions
oscillator engines
the script includes several oscillator calculation modes.
rsi
uses relative strength index behavior.
this mode is useful for reading classic momentum strength and overbought or oversold behavior.
stochastic
uses stochastic positioning.
this mode focuses on where price is closing compared to its recent high and low range.
hybrid rsi plus stochastic
uses rsi first, then applies a stochastic calculation to the rsi behavior.
this mode focuses on momentum position inside the rsi range and gives a more reactive exhaustion style.
cci normalized
uses commodity channel index behavior and normalizes it into a 0 to 100 style range.
this mode can be useful for reading broader deviation and momentum pressure.
how the real cross line works
the real cross line is a smoothed version of the active oscillator.
it is not a separate oscillator type. it follows the selected engine.
if rsi mode is selected, the cross line follows the rsi-based oscillator.
if stochastic mode is selected, the cross line follows the stochastic-based oscillator.
if hybrid mode is selected, the cross line follows the hybrid oscillator.
if cci normalized mode is selected, the cross line follows the normalized cci oscillator.
the cross dots are based on the actual intersection between the main oscillator and the real cross line.
orange cross dots show an upward cross.
magenta cross dots show a downward cross.
input guide
source
selects the price source used by the oscillator.
common choices are close, hl2, hlc3 or ohlc4.
close is simple and reactive.
hlc3 is smoother because it includes high, low and close.
length
controls the base oscillator calculation period.
a lower value makes the oscillator faster and more sensitive.
a higher value makes the oscillator smoother and slower.
smoothing
controls the smoothing applied to the final oscillator.
a lower value reacts faster.
a higher value reduces noise but adds more delay.
oscillator type
selects the calculation engine.
rsi is classic momentum.
stochastic is range position.
hybrid rsi plus stochastic is a more sensitive momentum range model.
cci normalized is a deviation-based momentum model.
extreme overbought
sets the upper extreme zone.
when the oscillator reaches this area, upside momentum is considered stretched.
overbought
sets the main upper warning level.
crossing this level can mark a strong bullish extension.
mid upper
sets the upper midline reference.
this can be used to detect smaller upward crosses around the upper balance area.
mid lower
sets the lower midline reference.
this can be used to detect smaller downward crosses around the lower balance area.
oversold
sets the main lower warning level.
crossing this level can mark a strong bearish extension.
extreme oversold
sets the lower extreme zone.
when the oscillator reaches this area, downside momentum is considered stretched.
enable gradient fills
turns the upper and lower visual gradient zones on or off.
when enabled, the oscillator pane becomes easier to read visually.
gradient layers
controls the number of visual layers used for the gradient style.
more layers create a smoother visual feel.
show level cross dots
shows or hides the dots created by cross conditions and extreme conditions.
show real cross line
shows or hides the smoother cross reference line.
this line is useful when you want to see exactly where the oscillator cross dots come from.
show level lines
shows or hides the horizontal reference lines.
these lines help identify overbought, oversold, extreme and midpoint areas.
oscillator line width
controls the thickness of the main oscillator line.
higher values make the oscillator more visible.
lower values keep the chart cleaner.
how to read the dots
top extreme dots
these appear when the oscillator is inside the extreme overbought zone.
they indicate strong upside extension.
they do not mean price must reverse immediately.
bottom extreme dots
these appear when the oscillator is inside the extreme oversold zone.
they indicate strong downside extension.
they do not mean price must reverse immediately.
orange cross dots
these appear when the main oscillator crosses above the real cross line.
they can show a possible upward momentum shift.
magenta cross dots
these appear when the main oscillator crosses below the real cross line.
they can show a possible downward momentum shift.
important note about dots
cross dots are not automatic buy or sell signals.
they show technical events inside the oscillator.
always confirm with trend, support and resistance, candle close, volume and risk management.
alerts
the script includes alert conditions for:
cross above the real cross line
cross below the real cross line
cross above overbought
cross below oversold
cross above extreme overbought
cross below extreme oversold
recommended beginner alert use
start with real cross up and real cross down.
use overbought and oversold alerts only as context.
use extreme alerts as exhaustion warnings, not direct trade signals.
avoid activating every alert at once if you want a clean workflow.
beginner tutorial
step 1: start with the default oscillator type
begin with hybrid rsi plus stochastic.
this mode gives a balanced view between momentum and range behavior.
step 2: keep the default levels
use the default overbought, oversold and extreme levels first.
do not change too many settings before understanding the oscillator behavior.
step 3: enable the real cross line
turn on the real cross line to see where cross dots come from.
when the oscillator crosses above the line, upward momentum may be improving.
when the oscillator crosses below the line, momentum may be weakening.
step 4: read the zones
above overbought, the market is showing strong upside momentum.
below oversold, the market is showing strong downside momentum.
inside the middle area, the market is more balanced.
step 5: read extremes carefully
extreme overbought can show strong bullish pressure.
extreme oversold can show strong bearish pressure.
an extreme does not guarantee a reversal.
strong markets can stay extreme longer than expected.
step 6: confirm with price action
before using any oscillator event, check the main chart.
look for:
trend direction
support and resistance
market structure
candle close
volume reaction
higher timeframe context
risk to reward
step 7: keep the chart clean
do not use every signal as an entry.
focus on the main oscillator, real cross line, extreme zones and a few important dots.
example 1: upward cross from the lower zone
the oscillator is near the oversold area.
then it crosses above the real cross line.
an orange dot appears at the real cross.
this can suggest that downside momentum is cooling and upward pressure may be starting.
a beginner should wait for price confirmation, such as a higher low, bullish candle close or break of short-term resistance.
example 2: downward cross from the upper zone
the oscillator is near the overbought area.
then it crosses below the real cross line.
a magenta dot appears at the real cross.
this can suggest that upside momentum is weakening.
a beginner should wait for price confirmation, such as rejection, lower high or break of short-term support.
example 3: extreme overbought continuation
the oscillator reaches the extreme overbought zone.
top extreme dots appear.
this means momentum is very strong to the upside.
it does not mean a sell signal is confirmed.
in a strong trend, the oscillator can remain high while price continues moving upward.
example 4: extreme oversold continuation
the oscillator reaches the extreme oversold zone.
bottom extreme dots appear.
this means momentum is very strong to the downside.
it does not mean a buy signal is confirmed.
in a strong downtrend, the oscillator can remain low while price continues moving downward.
example 5: using the cross line for timing
price is near support.
the oscillator is low.
the oscillator crosses above the real cross line.
an orange dot appears.
this can be used as an early momentum recovery warning, but the trader should still wait for price structure confirmation before making a decision.
example 6: using overbought as context
price is in an uptrend.
the oscillator crosses above the overbought level.
this confirms strong bullish pressure.
instead of shorting immediately, a beginner can watch for continuation or wait for a later loss of momentum.
best use cases
momentum reading
overbought and oversold context
detecting oscillator cross events
watching exhaustion zones
supporting reversal analysis
supporting trend continuation analysis
building alert-based watchlists
confirming price action with momentum context
recommended beginner setup
oscillator type: hybrid rsi plus stochastic
length: 14
smoothing: 3
show real cross line: on
show level cross dots: on
show level lines: on
enable gradient fills: on
use cross dots as warnings
use extreme dots as context
confirm every idea on the price chart
practical workflow
first, identify the current trend on the main chart.
second, check whether the oscillator is near the upper, middle or lower zone.
third, watch the real cross line.
fourth, note any orange or magenta cross dot.
fifth, check whether price confirms the oscillator event.
sixth, define invalidation and risk before any trade idea.
seventh, avoid taking signals against a strong trend without extra confirmation.
limitations
the oscillator is based on historical price data.
signals can appear late during fast moves.
extreme zones can stay extreme during strong trends.
cross dots are momentum events, not guaranteed reversals.
the tool should not be used alone.
risk note
this indicator is designed for technical analysis and educational market study. it does not provide financial advice, investment advice or guaranteed trading signals. all dots, levels, crosses, alerts and visual zones are references that require independent confirmation and proper risk management.
指标

[3Commas] Trail Hunter - Indicator Trail Hunter - Indicator
🔷 What it does:
This indicator visualizes a long-only mean-reversion signal framework on liquid instruments. It marks dual-confluence entry signals (MA cross-under + CCI oversold), tracks a virtual deal lifecycle on the chart with trailing take-profit and hard stop loss management, and exposes webhook-ready alerts for automated execution through an external DCA Bot. No orders are placed by the indicator itself — it is a pure signal and visualization layer.
Base Order signal: SMA(24) crosses below SMA(31) on 1h (default) AND CCI(11) on 1h crosses below −80
Exit signal: trailing take-profit activated at +1.5% with 0.05% trailing deviation, or hard stop at −3.25%
Single entry per cycle — no averaging, no safety order ladder
On-chart virtual P&L tracker: Net Profit, Max Drawdown, Trades, Win Rate, Profit Factor
🔷 Who is it for:
Bot operators who need a visual confirmation layer for automated mean-reversion execution.
Discretionary traders who use dual-indicator confluence logic manually and want clear on-chart triggers.
Free-tier TradingView users who want access to the same signal logic as the Strategy version without requiring backtest functionality.
Cross-instrument testers who run the same signal framework across crypto perpetuals, spot pairs, and equity tickers.
🔷 How does it work:
Long Entry: A long signal fires when two conditions align within a configurable keep-alive window — SMA(24) crosses below SMA(31) on the signal timeframe AND CCI(11) drops below −80 on the same timeframe. The indicator marks the entry with a green "L" triangle below the bar and stores the entry price as the reference for the trailing exit.
Short Entry: Not used — long-only signal framework by design.
Exit Management: Two exit conditions are armed simultaneously after entry. The trailing exit activates when price reaches Entry × (1 + Take Profit %), then follows the highest price reached with the deviation gap; if price retraces by the deviation amount from peak, the indicator marks the exit with a cyan diamond. The hard stop closes the virtual deal if price drops to Entry × (1 − Stop Loss %). Whichever condition fires first wins. The virtual P&L tracker captures the realized return at the actual fill price (peak − deviation for trail; SL price for stop).
🔷 Why it's unique:
Dual-indicator confluence — neither signal acts alone. The MA cross-under confirms short-term momentum exhaustion against the medium-term trend, and the CCI extreme confirms statistical oversold conditions. Requiring both filters out single-indicator false positives common to either condition during sideways regimes. Configurable keep-alive window (default 3 bars) lets the two confirmations align without requiring exact same-bar synchronization.
Trailing-exit architecture with full peak-tracking — the indicator computes the running peak from entry and triggers exit only when price retraces by the configured deviation from that peak. This is a true trailing simulation, not a fixed take-profit shortcut, and produces stats that match the underlying Strategy version closely.
Bot Integration — entry and exit alerts ship with webhook-ready JSON payloads, enabling direct trigger of a connected DCA Bot. Bot ID, Email Token, and pair label are exposed as inputs and automatically embedded into the alert message format.
🔷 What you'll see on the chart:
Cyan line — Fast MA on the signal timeframe (default SMA 24)
Orange line — Slow MA on the signal timeframe (default SMA 31)
Orange triangle (above bar) — MA cross-under signal fired
Cyan triangle (below bar) — CCI cross-under −80 signal fired
Green "L" triangle (below bar) — Combined entry signal armed; virtual deal opens
Cyan diamond — Trailing TP, fixed TP, or hard SL triggered; virtual deal closes
Cyan line (when in deal) — Entry price reference
Lime line (when in deal) — Trailing TP activation level
Red line (when in deal) — Stop Loss level
Stats card (top-left, configurable) — Live virtual backtest results: Net Profit, Max Drawdown, Total Trades, Win Rate, Profit Factor
🔷 Considerations Before Using the Indicator:
Market & Timeframe: Designed for 1-hour base charts on liquid instruments with frequent MA crossings — major crypto perpetuals (BTC, ETH, SOL), spot pairs on Coinbase and Bybit, and high-volume equities. The signal timeframe is independent of the chart timeframe — you can run on a 15m chart with 1h signals if you want fine-grained visualization with structural signal timing.
Limitations: The indicator does not place orders. It tracks a "virtual deal" state on the chart for visualization purposes only — actual execution must be performed through a connected bot or manually. This is a single-entry framework with no averaging, so a wrong entry caps at the −3.25% hard stop without recovery. The strategy carries no higher-timeframe regime filter, so it can signal long entries during sustained downtrends. For deployment in bearish regimes, consider gating the alerts manually with a higher-timeframe trend filter.
Virtual P&L Accuracy: The on-chart stats card uses a simplified internal accounting model — it does not factor exchange commission or slippage. The trailing exit simulation uses peak-tracking on the chart bar's high, which is an approximation of real intra-bar execution. Use the Strategy version for fee-adjusted backtest results.
Backtesting & Demo Testing: Always validate the signal framework on historical data before connecting to a live bot. The companion Strategy version of this script is available on the same profile for full backtest analysis with realistic commissions and slippage. Demo-trade for at least one month to observe behavior in conditions not represented in historical data. Past performance is not indicative of future results.
Parameter Adjustments: MA lengths, CCI threshold, signal timeframe, take-profit activation, trailing deviation, and stop loss should all be tuned per instrument volatility profile. Lower-volatility instruments work better with tighter MA pair, lower CCI threshold, and smaller trailing deviation. Higher-volatility instruments need wider parameters.
🔷 Backtest Validation:
This indicator shares identical signal logic with the Strategy version of the same framework, available on this profile for full historical performance review with realistic commission and slippage:
Strategy version:
Reference results from the Strategy version on COINBASE:BTCUSD, 1h chart, tested period May 12, 2025 — May 12, 2026:
Net Profit: +13.09 USD (+0.13%) | Max Drawdown: 7.91 USD (0.08%) | Total Trades: 66 | Win Rate: 69.70% (46/66) | Profit Factor: 1.254
The strategy is positioned as a capital-preservation framework — extreme drawdown control (under 0.1% on the tested window) with positive expectancy. Refer to the Strategy publication for the complete equity curve, trade-by-trade breakdown, and Strategy Tester report.
🔷 How to Use It:
🔸 Adjust Settings: Configure the MA lengths, CCI threshold, signal timeframe, and exit parameters for the instrument you intend to trade. Defaults are calibrated for 1-hour BTC Spot on Coinbase. For lower-volatility instruments, tighten the MA pair and lower the trailing deviation; for higher-volatility instruments, do the opposite. The Initial Capital input (default 10,000) is used only for percentage calculations in the stats card — it does not affect signal logic.
🔸 Visual Confirmation: Use the on-chart projections (entry line, TP activation, SL level) to verify that the active virtual deal aligns with your bot's actual position. The indicator's virtual deal state is a 1-to-1 mirror of the Strategy version's signal logic, so any divergence between chart visuals and bot position is a flag for investigation. The MA and CCI signal triangles let you trace exactly when each condition fired in the entry stack.
🔸 Create alerts to trigger the DCA Bot: Two alert events are exposed by the indicator — "Deal Start" fires on each new combined entry signal, and "Deal Close" fires when any of the three exit conditions (trailing TP, fixed TP, or stop loss) triggers. Configure both alerts in TradingView with the webhook URL pointing to your DCA Bot's signal endpoint. The Bot ID, Email Token, and Pair label can be set in the script's inputs and are automatically embedded into the alert JSON payload.
🔷 INDICATOR SETTINGS
MA Type — Moving average type for entry calculation (SMA or EMA).
Fast MA Length — Period of the fast moving average (default 24).
Slow MA Length — Period of the slow moving average (default 31).
MA Cross Timeframe — Timeframe on which the MA cross is computed.
Use MA Cross signal — Toggle the MA condition on or off in the entry stack.
CCI Length — Period for the CCI indicator (default 11).
CCI Oversold Threshold — Value below which CCI must cross to qualify as oversold (default −80).
CCI Timeframe — Timeframe on which the CCI cross is computed.
Use CCI signal — Toggle the CCI condition on or off.
Combine Signals — AND requires both conditions within the keep-alive window; OR fires on either alone.
Signal Keep-Alive (bars) — Number of bars within which both signals must align for AND mode (default 3).
Base Order Volume (USDT, ref) — Reference notional for virtual P&L calculation.
Take Profit % (activation) — Profit level at which the trailing exit arms.
Enable Trailing — Toggle trailing behavior on the take-profit exit.
Trailing Deviation % — Distance from the peak price at which the trailing exit fires.
Enable Stop Loss — Toggle the hard stop loss on or off.
Stop Loss % (from entry) — Maximum acceptable loss from entry price.
Initial Capital (ref for % calc) — Reference capital base for percentage metrics in the stats card.
Visual Layer toggles — Show/hide MA lines, entry line, TP/SL lines, signal triangles.
Stats card / Watermark — Display layer controls for on-chart virtual backtest summary and branding.
Webhook — Bot ID, Email Token, and Pair label for DCA Bot signal routing.
👨🏻💻💭 We hope this tool helps enhance your trading. Your feedback is invaluable, so feel free to share any suggestions for improvements or new features you'd like to see implemented.
__
The information and publications within the 3Commas TradingView account are not meant to be and do not constitute financial, investment, trading, or other types of advice or recommendations supplied or endorsed by 3Commas and any of the parties acting on behalf of 3Commas, including its employees, contractors, ambassadors, etc. 指标

Flow-RegimeFlow-Regime
A multi-source flow oscillator. It normalizes three independent measures of
market flow to a unified ±100 scale and combines them into a conviction-
weighted composite line, so you can see at a glance whether OBV, A/D, and
price flow are agreeing or diverging.
▌ What's plotted
Three normalized lines, each computed through the same pipeline
(CCI → percentrank → linear map to ±100):
• OBV-Flow — On-Balance Volume (signed cumulative volume)
• AD-Flow — Chaikin Accumulation/Distribution
• Price-Regime — price flow (ohlc4)
Plus a Fitted composite — the average of the three, amplified by |conviction|,
where conviction = average ÷ mean(|x|, |y|, |z|). When all three lines agree
the composite is amplified; when they conflict it is suppressed toward zero.
The Fitted line uses 5-tier coloring driven by how many of the three exceed
the neutral threshold (default ±20): solid green/red = all three agree, lighter
shades = two of three, gray = no consensus.
▌ Two lookback modes
Linear (default) — TF-specific lookback with sensible per-timeframe defaults
(1m=60, 5m=24, 15m=16, 1h=24, 4h=18, 1d=7, 1w=12, 1M=12), all editable.
Anchored — pick an anchor timestamp; the percentrank window grows from 0 at
that bar to (current_bar − anchor_bar) at the right edge of the chart. Use
this to lock the statistical baseline to a specific event — a regime start,
a major breakout, a news release. The anchor bar is marked with a yellow
diamond at fitted = 0.
▌ How to read it
The OB zone (≥ +70) and OS zone (≤ −70) are shaded — these are statistically
stretched conditions. Bars where the Fitted line reaches ±99 get a soft red/
green background tint as an "at the extreme" warning. Two corresponding alert
conditions are exposed for use with TV alerts.
This indicator does NOT emit trade signals. Per-line reversal dots and
confluence triangles are intentionally absent: those patterns can fit
historical noise convincingly without generalizing forward. Treat extremes
as flags to investigate, not entries to take.
Useful interpretive frames:
• All three lines extreme in the same direction = strongest evidence of
flow consensus.
• One or two lines diverging from the others at extremes = a divergence
worth examining on the chart.
• Fitted approaching ±99 = statistical extreme, regardless of direction.
▌ Notes
In Anchored mode, the first few bars after the anchor have very few historical
points to rank against, so percentrank values can swing to ±100 from sparse
data — read these bars with caution. CCI itself always uses the full real
price history regardless of mode, so its 20-bar internal window is never
distorted by the anchor.
Enable the Debug label in settings to verify which mode and lookback are
currently active on the chart. 指标

SHK CCI RSI StochRSI Fisher Blended Oscillator divergence╔══════════════════════════════════════════════════════════════╗
SHK Blended Oscillator
CCI + RSI + Stoch RSI + Fisher
╚══════════════════════════════════════════════════════════════╝
A professional-grade momentum oscillator that blends four powerful
indicators — CCI, RSI, Stochastic RSI, and Fisher Transform — into
one single weighted signal line. No clutter, no multiple panes.
Just one clean oscillator with maximum confluence.
━━━━━━━━━━━━━━━━━━━━━━━━━━━━━━━━━━━━━━━━
🔷 HOW IT WORKS
━━━━━━━━━━━━━━━━━━━━━━━━━━━━━━━━━━━━━━━━
Each indicator is normalized to the CCI scale (±100/±200) and
blended using user-defined weights. The result is a single line
that represents the combined momentum of all four indicators.
A signal MA line is plotted over the blended line for crossover
confirmation.
━━━━━━━━━━━━━━━━━━━━━━━━━━━━━━━━━━━━━━━━
📊 4 BLENDED INDICATORS
━━━━━━━━━━━━━━━━━━━━━━━━━━━━━━━━━━━━━━━━
① CCI — Commodity Channel Index (core base, always active)
② RSI — Relative Strength Index (normalized to CCI scale)
③ Stoch RSI — Stochastic RSI K line (normalized to CCI scale)
④ Fisher Transform — Price distribution oscillator (normalized)
Each indicator can be enabled/disabled independently.
Each has its own blend weight (0.1 to 3.0) to control influence.
━━━━━━━━━━━━━━━━━━━━━━━━━━━━━━━━━━━━━━━━
📐 11 SIGNAL MA TYPES
━━━━━━━━━━━━━━━━━━━━━━━━━━━━━━━━━━━━━━━━
Choose any of 11 moving average types for the signal line:
▸ SMA — Simple MA
Equal weight to all bars. Slowest. Best for clean baselines.
▸ EMA — Exponential MA
More weight on recent bars. Balanced lag. Best general purpose.
▸ WMA — Weighted MA
Linear weight to recent bars. Slightly faster than SMA.
▸ RMA — Wilder's Smoothed MA
Same smoothing method used inside RSI and ATR. Very smooth,
minimal noise. Best for swing trades.
▸ HMA — Hull MA
Fastest MA with least lag. Reactive to price changes.
Best for intraday Nifty/BankNifty options scalping.
▸ VWMA — Volume Weighted MA
Weights bars by volume. Gives more importance to high-volume
moves. Best for volume-heavy stocks like Reliance, TCS.
▸ SWMA — Symmetrically Weighted MA
Fixed 4-bar symmetric weighting. No length setting needed.
Smooth and balanced.
▸ DEMA — Double EMA
2×EMA − EMA(EMA). Reduces lag significantly compared to EMA.
Good for trend-following entries.
▸ TEMA — Triple EMA
3×E1 − 3×E2 + E3. Very fast, aggressive lag reduction.
Best for strong trending markets.
▸ LSMA — Least Squares MA (Linear Regression)
Fits a regression line to price. Excellent for identifying
clean trend direction. Best for daily/weekly charts.
▸ ALMA — Arnaud Legoux MA
Gaussian-weighted MA with customizable Offset and Sigma.
Low lag + low noise. Best for commodity options (Gold, Crude).
━━━━━━━━━━━━━━━━━━━━━━━━━━━━━━━━━━━━━━━━
🎯 SIGNAL SYSTEM
━━━━━━━━━━━━━━━━━━━━━━━━━━━━━━━━━━━━━━━━
▲ Bull Signal — appears when:
• Blended line is above signal MA (strength confirmed)
• AND any one of these fires:
- Blended crosses above zero
- RSI exits oversold zone
- StochRSI K exits oversold zone
- Fisher exits oversold level
▼ Bear Signal — appears when:
• Blended line is below signal MA (strength confirmed)
• AND any one of these fires:
- Blended crosses below zero
- RSI exits overbought zone
- StochRSI K exits overbought zone
- Fisher exits overbought level
Only ONE ▲ and ONE ▼ symbol per bar — no clutter.
━━━━━━━━━━━━━━━━━━━━━━━━━━━━━━━━━━━━━━━━
🔍 DIVERGENCE DETECTION
━━━━━━━━━━━━━━━━━━━━━━━━━━━━━━━━━━━━━━━━
✦ CCI Divergence — draws solid lines on the blended oscillator
• Bullish: price lower low + blended higher low → Lime line
• Bearish: price higher high + blended lower high → Red line
✦ RSI Divergence — draws dashed lines on RSI (normalized)
• Bullish divergence → Aqua dashed line
• Bearish divergence → Orange dashed line
✦ Labels auto-printed:
"CCI Bull Div" / "CCI Bear Div"
"RSI Bull Div" / "RSI Bear Div"
"CCI&RSI Bull Div" when both confirm together
━━━━━━━━━━━━━━━━━━━━━━━━━━━━━━━━━━━━━━━━
🎨 VISUAL FEATURES
━━━━━━━━━━━━━━━━━━━━━━━━━━━━━━━━━━━━━━━━
• Strength Histogram — color-coded background bars behind the line
• Blended Line Color:
Bright Lime = above zero + above MA (strong bull)
Faded Lime = below zero but above MA (weak bull)
Bright Red = below zero + below MA (strong bear)
Faded Red = above zero but below MA (weak bear)
• Signal MA Color:
Green = Heikin Ashi bullish candle
Red = Heikin Ashi bearish candle
• Extreme Zone BG Highlight:
Green background = blended above +100 and above MA
Red background = blended below -100 and below MA
• Horizontal Levels: ±200 (OB/OS), ±100, Zero line
• Blue filled zone between +100 and -100 (normal range)
━━━━━━━━━━━━━━━━━━━━━━━━━━━━━━━━━━━━━━━━
🔔 30+ ALERT CONDITIONS
━━━━━━━━━━━━━━━━━━━━━━━━━━━━━━━━━━━━━━━━
Blended Alerts:
• Strong Bullish / Strong Bearish
• Zero line cross up / down
• Above +100 / Below -100
• Hit Overbought / Oversold
• Exit Overbought / Exit Oversold
RSI Alerts:
• RSI above OB / below OS
• RSI cross above/below 50
StochRSI Alerts:
• K cross above oversold / below overbought
• K cross above / below D
Fisher Alerts:
• Fisher cross above/below oversold/overbought
• Fisher cross above/below zero
Combined:
• Any Bull Signal fired
• Any Bear Signal fired
Heikin Ashi:
• HA turned Bullish / Bearish
Divergence:
• CCI Bull/Bear Div
• RSI Bull/Bear Div
• CCI & RSI both confirmed
━━━━━━━━━━━━━━━━━━━━━━━━━━━━━━━━━━━━━━━━
⚙️ SETTINGS GROUPS
━━━━━━━━━━━━━━━━━━━━━━━━━━━━━━━━━━━━━━━━
• CCI Settings — length, source, MA type, MA length, ALMA params
• Levels — OB/OS and ±100 levels fully adjustable
• RSI Settings — length, source, OB/OS, blend weight
• StochRSI Settings — RSI len, Stoch len, K/D smooth, OB/OS, weight
• Fisher Settings — length, OB/OS levels, blend weight
• Features — toggle divergences, histogram, signals, extremes
• Divergence — lookback bars and threshold sensitivity
━━━━━━━━━━━━━━━━━━━━━━━━━━━━━━━━━━━━━━━━
🇮🇳 BEST FOR INDIAN MARKETS
━━━━━━━━━━━━━━━━━━━━━━━━━━━━━━━━━━━━━━━━
✔ Nifty 50 / BankNifty intraday options (HMA or TEMA)
✔ Sensex daily swing trades (ALMA or RMA)
✔ MCX Gold / Crude Oil options (ALMA or LSMA)
✔ NSE large-cap stocks (VWMA)
✔ All timeframes — 1m to Monthly
━━━━━━━━━━━━━━━━━━━━━━━━━━━━━━━━━━━━━━━━
⚠️ DISCLAIMER
━━━━━━━━━━━━━━━━━━━━━━━━━━━━━━━━━━━━━━━━
━━━━━━━━━━━━━━━━━━━━━━━━━━━━━━━━━━━━━━━━
⚠️ IMPORTANT DISCLAIMER — READ BEFORE USE
━━━━━━━━━━━━━━━━━━━━━━━━━━━━━━━━━━━━━━━━
FOR EDUCATIONAL PURPOSES ONLY
This indicator is not financial advice, investment advice, or
a recommendation to buy or sell any financial instrument.
All signals, alerts, and visual outputs are informational only.
NO GUARANTEE OF ACCURACY
Technical indicators are mathematical calculations based on
historical price data. They are lagging by nature and cannot
predict future price movements. Signals may be false, delayed,
or unreliable during high volatility, news events, or low
liquidity conditions.
RISK OF LOSS
Trading financial markets involves substantial risk. Options
and derivatives carry even higher risk due to leverage — you
can lose your entire invested capital. Never trade with money
you cannot afford to lose.
YOUR RESPONSIBILITY
• You are solely responsible for all your trading decisions.
• Never use this as your only reason to enter or exit a trade.
• Always apply stop-loss, proper position sizing, and risk
management on every single trade.
• Consult a SEBI-registered advisor before making significant
financial decisions.
• The author accepts NO liability for any losses incurred
from the use or misuse of this indicator.
INDIA MARKET NOTE
NSE, BSE, and MCX markets are subject to SEBI regulations,
RBI policy decisions, Budget announcements, and circuit
breakers — all of which can cause sudden moves that no
indicator can anticipate. Always check news calendars.
Past performance shown on historical charts does NOT
guarantee future results under any circumstances.
─────────────────────────────────────────
© SHK — All rights reserved.
Unauthorized copying or resale of this script is strictly
prohibited under TradingView House Rules.
───────────────────────────────────────── 指标

Divergence Stack Scanner [AGPro Series]Divergence Stack Scanner
🔹 Overview
Divergence Stack Scanner scans five independent momentum and volume oscillators simultaneously — RSI, MACD Histogram, CCI, MFI, and OBV — and grades every confirmed pivot by how many of them show regular divergence at the same time. The result is a 0 to 5 STACK score that isolates rare, high-conviction reversal zones which single-divergence tools simply cannot surface.
Most divergence indicators track one oscillator at a time. Strong reversals, however, tend to leave fingerprints across momentum and volume at once. This tool quantifies that confluence in a single, objective number you can act on.
🔸 Unique Edge
What separates this script from the crowded divergence space:
1. Five-oscillator confluence in one engine — not one divergence, five divergences graded together.
2. Strict versus Window classification — a 5/5 STRICT stack (all five on the exact same pivot) is marked with a star flash, while a 5/5 WINDOW stack (all five within a small bar tolerance) is tagged separately. The distinction matters because strict stacks are statistically rarer and sharper.
3. Pressure Zones — a rectangular, SR-style zone is drawn forward from each qualifying pivot, so the reversal level stays visible long after the signal fires.
4. Rolling win-rate panel — the last N decided signals are evaluated N bars forward, and the win percentage is displayed live on the panel.
5. Per-oscillator live state — you see at a glance which oscillators are already in divergence and how long ago they triggered.
🔹 Methodology
Pivots are detected using the standard TradingView pivot method with a configurable lookback (default 5 bars each side, confirmed, non-repainting).
When a pivot is confirmed, the script compares the current pivot price and oscillator value to the previous same-direction pivot:
- Regular bullish divergence: price prints a lower low while the oscillator prints a higher low.
- Regular bearish divergence: price prints a higher high while the oscillator prints a lower high.
This comparison runs independently for RSI, MACD Histogram, CCI, MFI, and OBV. Each oscillator stores the bar index of its most recent divergence. The stack engine then counts how many oscillators have fired within a tolerance window of the current pivot:
- Strict stack (window = 0): all counted oscillators fired on the exact same pivot bar.
- Window stack (window = 1 to N bars): oscillators fired within N bars of each other.
Pressure zones are drawn only when the stack meets a configurable minimum (default 4/5). Zone height is ATR-scaled so it stays proportional across instruments and timeframes. A proximity filter prevents label clutter: once a label is drawn in a given direction, a new label in the same direction within a short window is only drawn if its stack level is strictly higher.
🔸 Signals & Alerts
On-chart signals:
- ★ N/5 STACK label (filled color) — strict same-bar stack at level N.
- N/5 NEAR label (lighter color) — window stack (near-miss of strict).
- Pressure zone rectangle — drawn forward from the pivot for qualifying stacks.
Alerts available:
- 5/5 Strict Stack (bull and bear, separate) — the rarest and sharpest signal.
- Minimum Stack threshold — fires whenever the stack reaches your configured minimum level.
All alerts use alert.freq_once_per_bar_close and include ticker plus timeframe in the message.
🔹 Key Inputs
Core Engine:
- Pivot Lookback — bars each side to confirm a pivot (default 5).
- RSI, MACD, CCI, MFI lengths — standard defaults, all configurable.
Stack Configuration:
- Minimum Stack Level — display threshold (default 3/5).
- Window Tolerance — bar tolerance for near-stacks (default 3).
- Win-Rate Lookback — number of recent signals used for rolling win rate (default 20).
- Win Evaluation Bars — forward bars to decide win or loss (default 10).
Pressure Zones:
- Minimum Stack for Zone (default 4/5) — keeps the chart premium and uncluttered.
- Zone Extend and Height (ATR%) — tune the visual footprint to your taste.
- Max Active Zones — oldest zones are automatically trimmed.
Panel and Theme:
- Location (6 anchors), Dark or Light theme, font size presets.
- Fully brand-consistent AGPro color palette built in.
🔸 How to Use
- Treat 5/5 STRICT stacks as the headline signal. They are rare by construction and typically appear at genuine inflection points.
- Use 4/5 stacks as early-warning context around support, resistance, or higher-timeframe levels.
- Read the per-oscillator live state on the panel. When RSI, MACD, CCI, MFI are all in the same direction and OBV is the last holdout, a full stack is often imminent.
- Pressure zones work well as re-entry or invalidation levels after the initial signal fires.
- The rolling win rate is a sanity check for the current asset and timeframe — if it degrades meaningfully, raise the minimum stack level or widen the pivot lookback.
🔹 Limitations and Transparency
- This is a confluence tool, not a standalone trading system. Divergence by nature can persist in strong trends before any reversal.
- The engine is pivot-based and therefore delayed by the pivot lookback. Labels appear on the bar the pivot is confirmed, not on the pivot itself.
- Win rate is computed on the last N decided signals on the current chart. It is not a backtest, it is an evolving statistic and it does not include slippage, spread, or position sizing.
- Window stacks are lower-confidence than strict stacks by design. The visual distinction is intentional.
- Session-based "Today's Max" uses calendar-day rollover.
🔸 Risk Disclosure
This indicator is a technical analysis tool for research and education. It is not financial advice, not a signal service, and not a trading strategy. Past patterns do not guarantee future behavior. You are solely responsible for your trading decisions, risk management, and position sizing. Always combine any indicator with independent analysis, higher-timeframe context, and strict risk controls.
🔹 Technical Notes
- Pine Script v6, overlay indicator.
- Fully non-repainting. All divergences are evaluated only on confirmed pivots.
- Drawing objects (labels, boxes) are capped to avoid resource overruns.
- MPL 2.0 licensed — open source. 指标

指标

指标
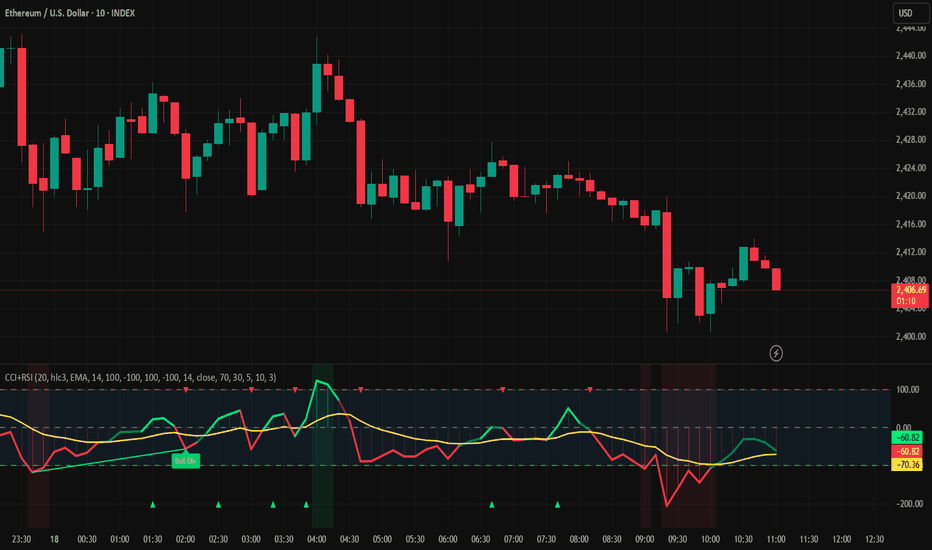
SHK CCI+RSI Merged | HA Signal MA | Dual Divergence | v6// ============================================================================
// DISCLAIMER: This script is for educational purposes only.
// The author is NOT responsible for any trading losses.
// Past performance does not guarantee future results.
// Trade entirely at your own risk.
// ============================================================================
━━━━━━━━━━━━━━━━━━━━━━━━━━━━━━━━━━━━━━━━
🔷 SHK CCI+RSI MERGED — CLEAN 2-LINE OSCILLATOR
Powered by Pine Script v6
━━━━━━━━━━━━━━━━━━━━━━━━━━━━━━━━━━━━━━━━
Stop cluttering your chart with two separate oscillators.
This indicator fuses CCI and RSI into ONE intelligent
blended line — giving you stronger, more reliable signals
with less noise.
━━━━━━━━━━━━━━━━━━━━━━━━━━━━━━━━━━━━━━━━
📐 HOW THE BLEND WORKS
━━━━━━━━━━━━━━━━━━━━━━━━━━━━━━━━━━━━━━━━
RSI is first normalized onto the CCI scale:
• RSI 50 → 0 (neutral / zero line)
• RSI 70 → +100 (overbought boundary)
• RSI 30 → -100 (oversold boundary)
Then both are averaged into one line:
➤ Blended = ( CCI + Normalized RSI ) / 2
The ±100 and ±200 levels now represent overbought
and oversold zones for BOTH indicators at once.
If RSI is disabled, the line falls back to pure CCI.
━━━━━━━━━━━━━━━━━━━━━━━━━━━━━━━━━━━━━━━━
📊 WHAT YOU SEE — ONLY 2 LINES
━━━━━━━━━━━━━━━━━━━━━━━━━━━━━━━━━━━━━━━━
● LINE 1 — CCI+RSI Blended (thick)
Color changes dynamically based on position
relative to the Signal MA and zero line:
🟢 Bright Green → above MA + above zero (strong bull)
🟢 Faded Green → above MA + below zero (weak bull)
🔴 Bright Red → below MA + below zero (strong bear)
🔴 Faded Red → below MA + above zero (weak bear)
● LINE 2 — Signal MA (EMA / SMA / WMA)
Colored by Heikin Ashi candle direction:
🟢 Green MA → HA candle is bullish (trend rising)
🔴 Red MA → HA candle is bearish (trend falling)
The MA color flip is your early trend change warning —
before price confirms the move.
● HISTOGRAM — Strength Bars
Displayed behind the lines. Brighter color = deeper
into overbought / oversold territory.
━━━━━━━━━━━━━━━━━━━━━━━━━━━━━━━━━━━━━━━━
📉 DUAL DIVERGENCE ENGINE
━━━━━━━━━━━━━━━━━━━━━━━━━━━━━━━━━━━━━━━━
Two independent divergence detectors run simultaneously:
🟩 CCI+RSI Divergence (solid lines)
Pivot-based detection on the blended oscillator vs price:
• Lime solid line + "Bull Div" → Bullish divergence
• Red solid line + "Bear Div" → Bearish divergence
🟦 RSI-Only Divergence (dashed lines)
Detected on raw RSI pivots, plotted at normalized scale:
• Aqua dashed + "RSI Bull Div" → RSI bullish divergence
• Orange dashed + "RSI Bear Div" → RSI bearish divergence
Both engines use adjustable lookback and threshold
settings so you can tune sensitivity to your style.
━━━━━━━━━━━━━━━━━━━━━━━━━━━━━━━━━━━━━━━━
⚡ ZERO LINE CROSSES
━━━━━━━━━━━━━━━━━━━━━━━━━━━━━━━━━━━━━━━━
🔼 Green triangle at bottom → crossed above zero (bull)
🔽 Red triangle at top → crossed below zero (bear)
━━━━━━━━━━━━━━━━━━━━━━━━━━━━━━━━━━━━━━━━
🎨 EXTREME ZONE BACKGROUND
━━━━━━━━━━━━━━━━━━━━━━━━━━━━━━━━━━━━━━━━
Background shading activates when blended is in
an extreme zone (beyond ±100 and above/below MA):
🟢 Green background → strong bullish pressure
🔴 Red background → strong bearish pressure
━━━━━━━━━━━━━━━━━━━━━━━━━━━━━━━━━━━━━━━━
🔔 BUILT-IN ALERTS (14 CONDITIONS)
━━━━━━━━━━━━━━━━━━━━━━━━━━━━━━━━━━━━━━━━
✅ Strong Bullish signal (blended > +100 & above MA)
✅ Strong Bearish signal (blended < -100 & below MA)
✅ Zero line cross — bullish & bearish
✅ CCI+RSI crossed above +100
✅ CCI+RSI crossed below -100
✅ Overbought zone entry & exit
✅ Oversold zone entry & exit
✅ RSI crossed overbought / oversold
✅ RSI crossed above / below midline (50)
✅ Heikin Ashi flipped bullish (MA turns green)
✅ Heikin Ashi flipped bearish (MA turns red)
━━━━━━━━━━━━━━━━━━━━━━━━━━━━━━━━━━━━━━━━
⚙️ SETTINGS & CUSTOMIZATION
━━━━━━━━━━━━━━━━━━━━━━━━━━━━━━━━━━━━━━━━
CCI Settings
• Length (default 20), Source (default HLC3)
• Signal MA type: EMA / SMA / WMA
• Signal MA length (default 14)
CCI Levels
• Overbought: +200 | Oversold: -200
• Upper level: +100 | Lower level: -100
RSI Settings
• Enable / disable RSI blend
• Length (default 14), Source (default Close)
• OB / OS levels (default 70 / 30)
Features (each individually toggleable)
• CCI+RSI divergence lines
• RSI-only divergence lines
• Trend strength histogram
• Zero line cross markers
• Extreme zone background shading
Divergence Settings
• Lookback bars (1–20)
• CCI divergence threshold
• RSI divergence threshold
━━━━━━━━━━━━━━━━━━━━━━━━━━━━━━━━━━━━━━━━
💡 WORKS BEST WITH
━━━━━━━━━━━━━━━━━━━━━━━━━━━━━━━━━━━━━━━━
• Key support and resistance levels on price chart
• VWAP or Volume Profile for confluence
• Higher timeframe trend bias confirmation
• All markets: Equities, Futures, Forex, Crypto, Commodities
• All timeframes: Scalping to Swing trading
━━━━━━━━━━━━━━━━━━━━━━━━━━━━━━━━━━━━━━━━
⚠️ DISCLAIMER
━━━━━━━━━━━━━━━━━━━━━━━━━━━━━━━━━━━━━━━━
This indicator is published for EDUCATIONAL and
INFORMATIONAL purposes only.
❌ This is NOT financial advice.
❌ This is NOT a buy or sell recommendation.
❌ Past performance does NOT guarantee future results.
Trading financial instruments including stocks, futures,
forex, commodities and cryptocurrencies involves
SUBSTANTIAL RISK OF LOSS and is not suitable for
every investor or trader.
The creator — SHK — is NOT responsible for any trading
losses, damages or financial consequences resulting
from the use or misuse of this indicator.
All trading decisions are SOLELY YOUR OWN RESPONSIBILITY.
You agree to trade entirely at YOUR OWN RISK.
Always conduct your own due diligence and consult a
qualified financial advisor before making any trading
or investment decisions.
By using this indicator you acknowledge and fully accept
all risks and release the author from any liability.
📌 TRADE SMART. MANAGE YOUR RISK. PROTECT YOUR CAPITAL.
━━━━━━━━━━━━━━━━━━━━━━━━━━━━━━━━━━━━━━━━ 指标
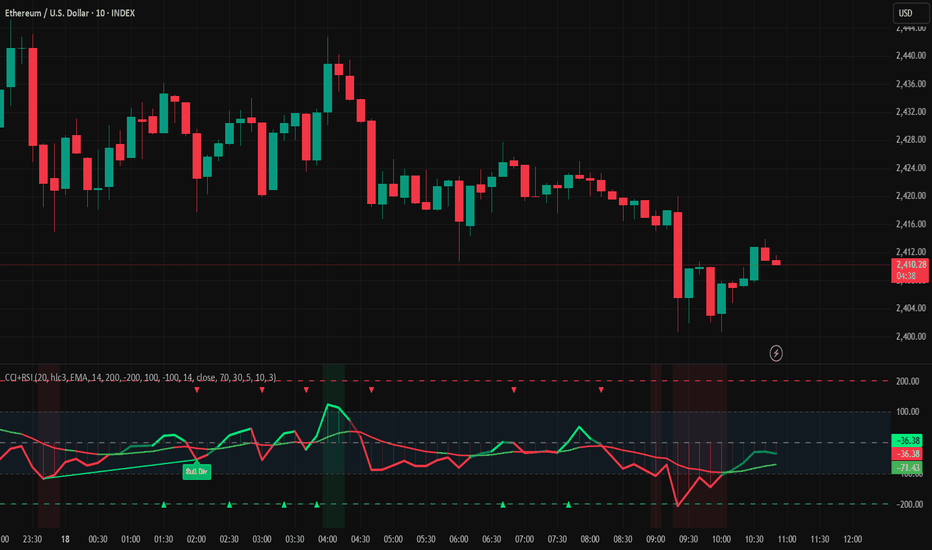
SHK CCI+RSI Merged | ZigZag Swing | HA Signal | Dual Divergence// ============================================================================
// DISCLAIMER: This script is for educational purposes only.
// The author is NOT responsible for any trading losses.
// Past performance does not guarantee future results.
// Trade entirely at your own risk.
// ============================================================================
━━━━━━━━━━━━━━━━━━━━━━━━━━━━━━━━━━━━━━━━
🔷 SHK CCI+RSI MERGED — FULL CONFLUENCE INDICATOR
━━━━━━━━━━━━━━━━━━━━━━━━━━━━━━━━━━━━━━━━
A clean, all-in-one oscillator that merges CCI and RSI into a
single blended line — eliminating indicator clutter while
preserving the best signals from both.
━━━━━━━━━━━━━━━━━━━━━━━━━━━━━━━━━━━━━━━━
📐 HOW THE BLEND WORKS
━━━━━━━━━━━━━━━━━━━━━━━━━━━━━━━━━━━━━━━━
RSI is normalized to the CCI scale before blending:
• RSI 50 → 0 (zero line)
• RSI 70 → +100 (upper level)
• RSI 30 → -100 (lower level)
The two oscillators are then averaged:
Blended = (CCI + Normalized RSI) / 2
This means ±100 is the true overbought/oversold boundary
for BOTH indicators simultaneously.
━━━━━━━━━━━━━━━━━━━━━━━━━━━━━━━━━━━━━━━━
📊 WHAT YOU SEE — 2 LINES ONLY
━━━━━━━━━━━━━━━━━━━━━━━━━━━━━━━━━━━━━━━━
🟢 CCI+RSI Blended Line
Dynamic color based on position vs Signal MA and zero line:
• Bright green → above MA and above zero (strong bull)
• Faded green → above MA but below zero (weak bull)
• Bright red → below MA and below zero (strong bear)
• Faded red → below MA but above zero (weak bear)
🟡 Signal MA Line (EMA / SMA / WMA — your choice)
Colored by Heikin Ashi candle direction:
• 🟢 Green → HA candle is bullish (momentum rising)
• 🔴 Red → HA candle is bearish (momentum falling)
The MA color flip gives early trend change warning.
📊 Histogram bars behind the lines show trend strength
with intensity — brighter = deeper into extreme zone.
━━━━━━━━━━━━━━━━━━━━━━━━━━━━━━━━━━━━━━━━
🔀 ZIGZAG — SWING & INTERNAL
━━━━━━━━━━━━━━━━━━━━━━━━━━━━━━━━━━━━━━━━
ZigZag is drawn directly ON the blended oscillator —
not on price — so you see market structure on the
indicator itself.
✅ Main Swing ZigZag — major HH / HL / LH / LL pivots
✅ Internal ZigZag — minor swings inside the main structure
✅ Labels: HH, HL, LH, LL at every confirmed pivot
✅ Customizable: depth, deviation, backstep, color, style
━━━━━━━━━━━━━━━━━━━━━━━━━━━━━━━━━━━━━━━━
📉 DUAL DIVERGENCE DETECTION
━━━━━━━━━━━━━━━━━━━━━━━━━━━━━━━━━━━━━━━━
Two independent divergence engines running simultaneously:
🟩 CCI+RSI Divergence (solid lines)
Detected on the blended oscillator pivots vs price pivots
• Lime line + "Bull Div" label → bullish divergence
• Red line + "Bear Div" label → bearish divergence
🟦 RSI-Only Divergence (dashed lines)
Detected on raw RSI pivots, drawn at normalized scale
• Aqua dashed + "RSI Bull Div" → RSI bullish divergence
• Orange dashed + "RSI Bear Div" → RSI bearish divergence
━━━━━━━━━━━━━━━━━━━━━━━━━━━━━━━━━━━━━━━━
⚡ ZERO LINE CROSSES
━━━━━━━━━━━━━━━━━━━━━━━━━━━━━━━━━━━━━━━━
🔼 Green triangle (bottom) → blended crossed above zero
🔽 Red triangle (top) → blended crossed below zero
━━━━━━━━━━━━━━━━━━━━━━━━━━━━━━━━━━━━━━━━
🎨 EXTREME ZONE HIGHLIGHTING
━━━━━━━━━━━━━━━━━━━━━━━━━━━━━━━━━━━━━━━━
Background shading activates when blended crosses ±100:
• 🟢 Green background → strong bullish zone
• 🔴 Red background → strong bearish zone
━━━━━━━━━━━━━━━━━━━━━━━━━━━━━━━━━━━━━━━━
🔔 ALERTS INCLUDED
━━━━━━━━━━━━━━━━━━━━━━━━━━━━━━━━━━━━━━━━
✅ Strong Bullish / Bearish signal
✅ Zero line cross (bull & bear)
✅ CCI+RSI above +100 / below -100
✅ Overbought / Oversold zone entry & exit
✅ RSI overbought / oversold / mid cross
✅ Heikin Ashi direction flip (MA color change)
✅ ZigZag swing high / swing low confirmed
━━━━━━━━━━━━━━━━━━━━━━━━━━━━━━━━━━━━━━━━
⚙️ FULLY CUSTOMIZABLE
━━━━━━━━━━━━━━━━━━━━━━━━━━━━━━━━━━━━━━━━
• CCI length and source
• RSI length, source, OB/OS levels
• Signal MA type (EMA / SMA / WMA) and length
• ZigZag depth, deviation, backstep, colors, styles
• Internal ZigZag independently configurable
• Divergence lookback and threshold (separate for CCI & RSI)
• All visual elements individually toggleable
━━━━━━━━━━━━━━━━━━━━━━━━━━━━━━━━━━━━━━━━
💡 BEST USED WITH
━━━━━━━━━━━━━━━━━━━━━━━━━━━━━━━━━━━━━━━━
• Price action / support-resistance levels
• Volume profile or VWAP on the main chart
• Higher timeframe trend confirmation
• Works on all markets: equities, futures, forex, crypto
━━━━━━━━━━━━━━━━━━━━━━━━━━━━━━━━━━━━━━━━
━━━━━━━━━━━━━━━━━━━━━━━━━━━━━━━━━━━━━━━━
⚠️ DISCLAIMER
━━━━━━━━━━━━━━━━━━━━━━━━━━━━━━━━━━━━━━━━
This indicator is published for EDUCATIONAL and
INFORMATIONAL purposes only.
❌ This is NOT financial advice.
❌ This is NOT a buy or sell recommendation.
❌ Past performance does NOT guarantee future results.
Trading financial instruments including stocks, futures,
forex, commodities and cryptocurrencies involves
SUBSTANTIAL RISK OF LOSS and is not suitable for
every investor or trader.
The creator(s) of this script — SHK — are NOT responsible
for any trading losses, damages or financial consequences
resulting from the use or misuse of this indicator.
All trading decisions are SOLELY YOUR OWN RESPONSIBILITY.
You agree to trade entirely at YOUR OWN RISK.
Always conduct your own due diligence. Consult a
qualified and licensed financial advisor before making
any investment or trading decisions.
By using this indicator you acknowledge and accept
all risks associated with trading and release the
author from any and all liability.
📌 TRADE SMART. MANAGE YOUR RISK. PROTECT YOUR CAPITAL.
━━━━━━━━━━━━━━━━━━━━━━━━━━━━━━━━━━━━━━━━
━━━━━━━━━━━━━━━━━━━━━━━━━━━━━━━━━━━━━━━━ 指标

指标

Adaptive Fourier Transform CCI [QuantAlgo]🟢 Overview
The Adaptive Fourier Transform CCI reimagines the classic Commodity Channel Index by replacing its fixed lookback period with one that continuously adjusts to the market's own rhythm. Rather than measuring price deviation against an arbitrary static length, it first isolates the cyclical component of price action through a Discrete Fourier Transform, identifies which cycle period currently holds the most spectral energy, and then tunes the CCI calculation to that dominant period. The result is a momentum oscillator calibrated to the frequency structure of the instrument being traded, naturally tightening during fast, high-frequency regimes and widening during slower, drawn-out cycles without requiring manual timeframe adjustments.
🟢 How It Works
Before any cycle detection occurs, raw price is conditioned through two sequential filters. A high-pass filter strips the slow-moving trend component from the close, leaving only the oscillating portion of price action:
hp := 0.5 * (1 + a1) * (close - close ) + a1 * hp
That residual is then passed through a Super Smoother filter, which removes short-term noise from the cycle signal without introducing the lag that standard moving averages add at this stage:
filt := c1 * (hp + hp ) / 2 + c2 * filt + c3 * filt
This cleaned signal is what the Discrete Fourier Transform (DFT) operates on. The DFT scans across a range of candidate cycle periods and measures how much price energy is concentrated at each one. The period where that energy is strongest is selected as the dominant cycle. An EMA smooths the period output to prevent erratic length switching between bars, and the result is scaled by the Length Multiplier to derive the final adaptive CCI lookback:
adaptiveLen = clamp(round(dominantPeriod × lengthMult), 5, 60)
The CCI is then calculated using the standard Lambert formula over that adaptive length, measuring how far typical price has deviated from its mean relative to its average absolute deviation. An optional output smoothing MA reduces bar-to-bar noise before the final value is plotted.
🟢 Signal Interpretation
▶ Overbought (Above Upper Level, Red): When the Adaptive Fourier Transform CCI (AFT-CCI) rises above the upper threshold, price has deviated significantly above its cycle-adaptive mean. The reading reflects momentum extended relative to the market's current detected rhythm rather than a fixed arbitrary baseline. The signal carries more weight when the dominant cycle is stable and the DFT is locked onto a consistent frequency rather than switching between periods.
▶ Oversold (Below Lower Level, Green): When the AFT-CCI falls below the lower threshold, price has moved an equivalent distance below its cycle-adaptive mean. In strongly trending conditions the AFT-CCI can remain in either zone for extended periods, so the threshold levels should be read as zones of extension rather than automatic reversal points.
▶ Neutral Zone (Between Levels, Grey): When the AFT-CCI sits between the upper and lower thresholds, price deviation relative to the detected cycle is within normal range. Zero-line crosses within this zone indicate the adaptive mean is being reclaimed, which can serve as early directional context before a full threshold break develops.
▶ Zero Line: The zero line represents the adaptive mean itself. A cross above zero indicates typical price has moved above the cycle-adaptive mean; a cross below indicates the opposite. These crosses are lower-conviction reads on their own but become more meaningful when followed by a threshold break in the same direction.
🟢 Features
▶ Preconfigured Presets: Two parameter sets sit alongside the default configuration. "Fast Response" compresses the DFT window and cycle search range while raising the length multiplier, producing faster adaptation suited to intraday charts from 5-minute to 1-hour. "Smooth Trend" expands the window and search range while lowering the multiplier, establishing a more stable cycle read suited to daily and weekly position trading.
▶ Built-in Alerts: Six alert conditions cover the full range of meaningful oscillator events. Separate alerts fire on entering and exiting both overbought and oversold territory, capturing threshold breaks in both directions. Two additional alerts trigger on bullish and bearish zero-line crosses, enabling directional monitoring without requiring constant chart observation.
▶ Visual Customisation: Six colour presets, Classic, Aqua, Cosmic, Cyber, Neon, and Custom, apply consistently across the signal line, glow layers, and threshold level lines so the overbought and oversold colours remain coherent regardless of which preset is active. The optional neon glow effect uses three layered plots at increasing transparency to give the signal line visual depth and make threshold breaks immediately readable at a glance.
指标
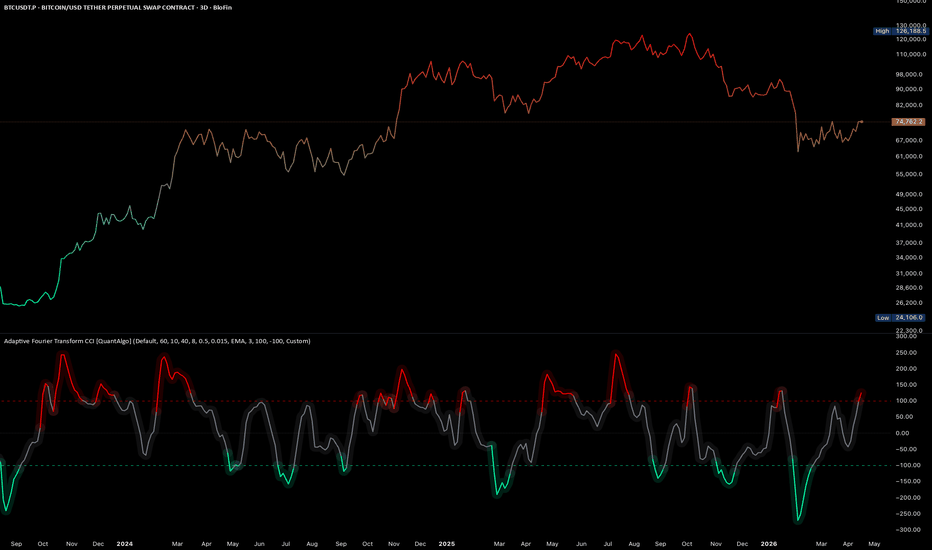
BK AK-Vigilante☠ BK AK-Vigilante ☠
All glory to G-d.
Respect to my mentor AK, whose standard is discipline, confirmation, and execution without noise.
BK AK-Vigilante is a CCI-based momentum and reversal framework built to expose what most traders miss: not just where momentum is, but whether it is accelerating, fading, exhausting, or quietly preparing to reverse.
This indicator does not treat CCI like a basic overbought and oversold tool. It turns CCI into a layered read of market behavior by combining raw CCI structure, slope pressure, smoothing interaction, momentum-state transitions, fast and slow divergence engines, velocity expansion, absorption signals, multi-timeframe alignment, and a confluence intelligence layer that helps separate trend continuation from reversal conditions.
What it does
BK AK-Vigilante tracks the market through multiple stacked reads:
a core CCI engine
optional smoothing and Bollinger structure
instant slope coloring for momentum pressure
crossover fill between CCI and its smoothing average
peak and valley pivot detection
fast divergence for tactical shifts
slow divergence for structural shifts
divergence confluence when both engines align
momentum histogram state changes such as launch, surge, fade, and flip
velocity envelope breaks
absorption and exhaustion detection at extremes
higher-timeframe confluence
a CCI volatility ratio that helps judge signal quality
a compact intelligence layer and status table for live decision support
How it works
The script starts with raw CCI, then builds context around it.
The slope layer measures how aggressively CCI is changing bar to bar. That makes the line react not just to level, but to force. The histogram then compares CCI to its smoothing average so you can see when momentum is launching, accelerating, fading, or flipping. That matters because reversals often begin with deceleration before they appear in price.
The divergence engine is split into two parts. The fast engine is for tactical divergence and shorter-turn behavior. The slow engine is for structural divergence and larger reversals. When both engines align inside the confluence window, the script flags that as a much higher-conviction condition than a single divergence by itself.
On top of that, the script checks for absorption at deep extremes. That helps identify the moments when CCI is still stretched, but the force behind the move is already dying. The velocity envelope adds another layer by showing when CCI is pushing beyond its normal movement range. The volatility ratio then helps filter whether current conditions are expanded and meaningful or compressed and likely to be noisy.
What makes it different
BK AK-Vigilante is not a decorative CCI remake.
Its purpose is to convert CCI from a simple oscillator into a market-state tool.
The difference is in the interaction of its layers:
slope tells you pressure
histogram tells you state
divergence tells you disagreement
absorption tells you exhaustion
velocity tells you acceleration
MTF tells you alignment
confluence intelligence tells you when the layers are working together
That is the edge here. It is built to help answer practical questions:
Is the current move still healthy or already fading?
Is this extreme actually strong, or is it exhausted?
Is divergence tactical noise or structural risk?
Are multiple layers confirming the same direction?
Is this the point to press, reduce, or prepare for reversal?
How to use it
A clean workflow is:
Start with the CCI regime and slope.
Then check the histogram state.
Then check whether divergence is forming.
Then look for absorption or velocity breaks.
Then confirm with MTF and the volatility ratio.
In practice:
SURGE + strong slope + expanded volatility favors continuation.
FADE + absorption at extremes is where reversal risk becomes real.
Fast and slow divergence together is where conviction increases.
Compressed volatility means reduce trust in signals and avoid overcommitting.
MTF agreement gives better directional confidence.
This script is best used as a decision-support tool, not as a blind auto-entry system.
Best fit
BK AK-Vigilante is suited for traders who want momentum and reversal structure in one place, especially for:
intraday scalping
day trading
momentum continuation trades
exhaustion-based reversal setups
confirmation work alongside structure, levels, or price action
It can be used on any market, but it is most useful where momentum shifts matter and where the trader wants to distinguish between a real trend leg and a move that is already starting to fail.
Bottom line
BK AK-Vigilante was built to read momentum with more depth than a standard oscillator.
Not just overbought.
Not just oversold.
Not just divergence.
It is a framework for reading pressure, state, exhaustion, acceleration, and confluence through CCI so the trader can act with more structure and less guesswork.
☠ BK AK-Vigilante ☠ 指标
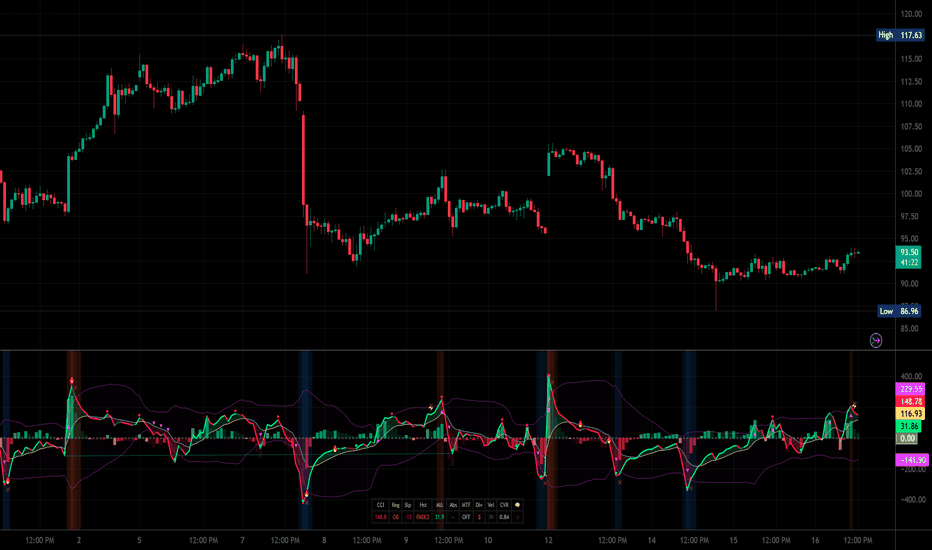
指标

[SSS] ATR x Trend x Volume Signals# ATR x Trend x Volume Signals
---
## ENGLISH
ATR x Trend x Volume Signals is a multi-factor, non-repainting indicator that combines volatility structure, trend direction, and volume expansion into a single decision-support framework. It is primarily designed for futures trading on the Moscow Exchange (MOEX), but can be adapted to any instrument with sufficient volume data. It is built for traders who rely on technical confluence and prefer clear, rule-based setups with built-in position sizing.
🎯 **Purpose**
This tool identifies high-probability moments when three independent analytical layers — ATR-based volatility, CCI-driven higher-timeframe trend, and statistical volume analysis — all align. It helps filter out market noise and focus attention on clean, actionable conditions.
⚙️ **Structure**
The indicator consists of three core analytical layers plus supporting modules:
1️⃣ **ATR Trailing Stop (Dual Layer)** — Two adaptive ATR trailing lines (fast and slow) define the volatility envelope. The fast trail (optional display) responds quickly to price changes, while the slow trail acts as the primary trend filter and dynamic stop-loss reference. When the fast trail is above the slow trail, the structure is bullish (green); otherwise bearish (red).
2️⃣ **Trend Indicator (CCI + ATR, Higher Timeframe)** — A CCI-based directional filter combined with ATR smoothing, calculated on a user-defined higher timeframe. It determines the dominant trend and reduces false signal flips. The indicator uses a confirmed-bar anti-repaint pattern (` ` + `lookahead_on`) to ensure values are locked to the last closed HTF bar and never change retroactively.
3️⃣ **Volume Analysis (Statistical Deviation)** — Volume is evaluated against its historical moving average using standard deviation bands. Bars are classified into three tiers:
- 🟡 Medium volume (> 1.0 σ)
- 🟠 High volume (> 2.5 σ)
- 🔴 Extra-high volume (> 4.0 σ)
All thresholds are fully configurable.
💡 **Signal Logic**
A **Buy Signal** 🟢 appears when ALL of the following conditions are met simultaneously:
- The ATR structure is bullish (fast trail > slow trail).
- The Trend Indicator is blue (CCI ≥ 0 on the higher timeframe).
- A bullish candle closes above both the slow ATR trail and the Trend Indicator line.
- The bar shows at least medium volume (≥ 1.0 σ above average).
- The current bar is within the user-defined trading session.
A **Sell Signal** 🔴 appears when:
- The ATR structure is bearish (fast trail < slow trail).
- The Trend Indicator is red (CCI < 0 on the higher timeframe).
- A bearish candle closes below both the slow ATR trail and the Trend Indicator line.
- The bar shows at least medium volume (≥ 1.0 σ above average).
- The current bar is within the user-defined trading session.
**One signal per ATR phase:** Only one Buy or Sell signal can fire per ATR trend cycle. A new signal is generated only after the ATR direction changes and all conditions re-align.
❌ **Exit Logic**
Exit markers (cross symbols) appear when price crosses the slow ATR trailing line after an entry. This simulates a trailing-stop exit. The exit is suppressed on the entry bar itself to prevent same-bar false exits. A small percentage offset (0.07%) is applied to reduce noise-triggered exits.
⏰ **Session Filter**
Signals are generated only between user-defined start and end times (default: 14:00–18:00 chart time). This allows traders to restrict signal generation to their preferred active trading hours. Additionally, the chart background can be colored to visually separate session zones:
- 🟦 Cold session (default 00:00–14:00)
- 🟩 Work session (default 14:00–18:00)
- 🟥 Hot session (default 18:00–23:59)
📐 **Position Sizing Module**
A built-in position sizing table (bottom-right corner) calculates in real time:
- Risk amount in account currency based on account capital and risk percentage.
- Effective stop distance = ATR stop % + user-defined buffer %.
- Number of contracts (rounded down to whole number).
- Actual risk in currency and as percentage of account.
- Separate row for the last signal's position size at the moment of signal occurrence.
All parameters (account capital, point value, risk %, ATR buffer %) are configurable via inputs.
📊 **ATR TP Table**
A second table (bottom-left corner) displays the current ATR percentage distance from the close to the slow trail, along with calculated take-profit levels at 0.5×, 1×, 1.5×, 2×, and 3× the ATR distance. Each TP level can be individually shown or hidden.
🔔 **Alerts**
The indicator supports TradingView alerts for Buy and Sell signals. Each alert message includes: entry price, stop-loss price, ATR stop %, effective stop (ATR + buffer) %, position size in contracts, and all five TP levels.
🛡️ **Non-Repainting Design**
- The Trend Indicator uses the standard Pine Script anti-repaint pattern: `request.security()` with `lookahead = barmerge.lookahead_on` combined with ` ` offset, ensuring only confirmed (closed) HTF bar data is used.
- All signals are evaluated at bar close (`alert.freq_once_per_bar_close`).
- No future data is referenced at any point.
🧠 **Key Features**
- Dual ATR trailing stop (fast + slow) for volatility structure
- CCI-based higher-timeframe trend filtering (non-repainting)
- Statistical volume deviation heatmap (3 tiers)
- Session-restricted signal generation with visual background zones
- Dynamic trailing-stop exit system
- Built-in position sizing calculator with ATR buffer
- Multi-level take-profit reference table
- Alert-ready with full trade context
- Fully configurable inputs
- Pine Script v6
📈 **Usage Tips**
- For best results, set the Trend Indicator timeframe higher than the chart timeframe (e.g., chart on 1 min → Trend Indicator on 15 min; chart on 5 min → Trend Indicator on 1 hour).
- Combine with support/resistance levels, market structure, or higher-timeframe confirmation for additional context.
- Adjust volume thresholds based on the instrument's typical volume profile.
- Use the position sizing table to maintain consistent risk management across trades.
🔧 **Configurable Parameters**
Almost every aspect of the indicator can be customized through the Settings/Inputs panel:
*ATR Trailing Stop:* Fast ATR Period and Multiplier, Slow ATR Period and Multiplier, option to show/hide the fast trail line.
*Trend Indicator:* Higher timeframe selection, CCI Period, ATR Multiplier and Period for the trend calculation, option to show/hide.
*Volume Analysis:* MA Length, StdDev Length, and three threshold levels (Medium, High, Extra-High) — adjust these to match the volume profile of your instrument. Option to show/hide bar coloring.
*Session Filter:* Signal Start/End time, three session zones (Cold/Work/Hot) with independent start/end times and background colors — all customizable to your exchange schedule.
*Position Sizing:* Account Capital (RUB), Point Value (RUB), Risk per Trade (%), ATR Buffer (%) — these drive the real-time position sizing table.
*TP Table:* Each take-profit level (TP0.5, TP1, TP1.5, TP2, TP3) can be individually shown or hidden. Text size for both tables is selectable.
This flexibility allows the indicator to be tuned for different instruments, timeframes, and trading styles without modifying the code.
💰 **Recommended Risk and Money Management**
It is strongly recommended to use a structured risk and money management system with multi-step exits:
*Risk per trade:* 1% of account capital. The built-in position sizing module calculates the exact number of contracts for this risk level automatically.
*Multi-step exit system:*
- **0.5R reached** — move the stop-loss to breakeven (entry price). This eliminates the risk on the trade.
- **1R reached** — close half of the position to lock in profit. For the remaining half, choose one of two approaches depending on the results of your own backtesting: either trail the stop using the slow ATR line, or hold for a fixed R-multiple target (e.g., 1.5R, 2R, or 3R).
The TP table on the chart displays all these R-levels in real time, making it easy to plan exits visually. Past performance does not guarantee future results — always validate any exit strategy with your own backtesting before trading live.
📈 **Credits**
Inspired by:
- ATR Trailing Stop by Ceyhun
- Trend Magic by Kivanc Ozbilgic
- Heatmap Volume by xdecow
---
## РУССКИЙ
ATR x Trend x Volume Signals — это мультифакторный индикатор без перерисовки, объединяющий анализ волатильности, направления тренда и объёма в единую систему принятия решений. Индикатор предназначен в первую очередь для торговли фьючерсами на Московской бирже (MOEX), но может быть адаптирован для любого инструмента с достаточными данными по объёму. Создан для трейдеров, использующих техническую конфлюэнцию и предпочитающих чёткие, основанные на правилах торговые сетапы со встроенным расчётом позиции.
🎯 **Назначение**
Инструмент определяет моменты высокой вероятности, когда три независимых аналитических слоя — волатильность на основе ATR, тренд на старшем таймфрейме через CCI и статистический анализ объёма — совпадают одновременно. Это помогает отфильтровать рыночный шум и сосредоточиться на чистых, пригодных для торговли условиях.
⚙️ **Структура**
Индикатор состоит из трёх основных аналитических слоёв и вспомогательных модулей:
1️⃣ **ATR Trailing Stop (двойной)** — Две адаптивные линии ATR (быстрая и медленная) формируют контур волатильности. Быстрая линия (отображение опционально) реагирует на цену оперативно, медленная служит основным трендовым фильтром и динамическим уровнем стоп-лосса. Когда быстрая линия выше медленной — структура бычья (зелёная), иначе — медвежья (красная).
2️⃣ **Trend Indicator (CCI + ATR, старший таймфрейм)** — Направленный фильтр на основе CCI в сочетании со сглаживанием ATR, рассчитываемый на заданном пользователем старшем таймфрейме. Определяет доминирующий тренд и снижает ложные переключения. Используется стандартный анти-репейнт паттерн Pine Script (` ` + `lookahead_on`), что гарантирует использование только данных последнего закрытого бара старшего ТФ без ретроспективных изменений.
3️⃣ **Анализ объёма (статистическое отклонение)** — Объём оценивается относительно исторического среднего с помощью стандартного отклонения. Бары классифицируются на три уровня:
- 🟡 Средний объём (> 1.0 σ)
- 🟠 Высокий объём (> 2.5 σ)
- 🔴 Сверхвысокий объём (> 4.0 σ)
Все пороги полностью настраиваемы.
💡 **Логика сигналов**
**Сигнал на покупку** 🟢 появляется при одновременном выполнении ВСЕХ условий:
- Структура ATR бычья (быстрая линия > медленной).
- Trend Indicator синий (CCI ≥ 0 на старшем таймфрейме).
- Бычья свеча закрывается выше медленной линии ATR и линии Trend Indicator.
- Бар показывает как минимум средний объём (≥ 1.0 σ выше среднего).
- Текущий бар находится в пределах заданной торговой сессии.
**Сигнал на продажу** 🔴 появляется при:
- Структура ATR медвежья (быстрая линия < медленной).
- Trend Indicator красный (CCI < 0 на старшем таймфрейме).
- Медвежья свеча закрывается ниже медленной линии ATR и линии Trend Indicator.
- Бар показывает как минимум средний объём (≥ 1.0 σ выше среднего).
- Текущий бар находится в пределах заданной торговой сессии.
**Один сигнал за фазу ATR:** Только один Buy или Sell сигнал может сработать за один цикл тренда ATR. Новый сигнал генерируется только после смены направления ATR и повторного совпадения всех условий.
❌ **Логика выхода**
Маркеры выхода (крестики) появляются при пересечении ценой медленной линии ATR после входа. Это имитирует выход по трейлинг-стопу. Выход подавляется на баре входа для предотвращения ложных закрытий. Применяется небольшой процентный отступ (0.07%) для снижения шумовых срабатываний.
⏰ **Фильтр по сессиям**
Сигналы генерируются только в пределах заданного временного окна (по умолчанию: 14:00–18:00 по времени графика). Это позволяет ограничить генерацию сигналов активными торговыми часами. Дополнительно фон графика может окрашиваться для визуального разделения сессий:
- 🟦 Холодная сессия (по умолчанию 00:00–14:00)
- 🟩 Рабочая сессия (по умолчанию 14:00–18:00)
- 🟥 Горячая сессия (по умолчанию 18:00–23:59)
📐 **Модуль расчёта позиции**
Встроенная таблица расчёта позиции (правый нижний угол) рассчитывает в реальном времени:
- Сумму риска в валюте счёта на основе капитала и процента риска.
- Эффективное расстояние до стопа = ATR стоп % + пользовательский буфер %.
- Количество контрактов (округление вниз до целого числа).
- Фактический риск в валюте и в процентах от счёта.
- Отдельная строка с размером позиции последнего сигнала на момент его возникновения.
Все параметры (капитал, стоимость пункта, % риска, буфер ATR) настраиваются через входные данные.
📊 **Таблица ATR TP**
Вторая таблица (левый нижний угол) отображает текущее процентное расстояние ATR от цены закрытия до медленной линии, а также рассчитанные уровни тейк-профита: 0.5×, 1×, 1.5×, 2× и 3× от ATR-расстояния. Каждый уровень TP можно включить или скрыть индивидуально.
🔔 **Алерты**
Индикатор поддерживает алерты TradingView для сигналов Buy и Sell. Каждое сообщение алерта содержит: цену входа, цену стоп-лосса, ATR стоп %, эффективный стоп (ATR + буфер) %, размер позиции в контрактах и все пять уровней TP.
🛡️ **Защита от перерисовки**
- Trend Indicator использует стандартный анти-репейнт паттерн Pine Script: `request.security()` с `lookahead = barmerge.lookahead_on` в сочетании со сдвигом ` `, что гарантирует использование только подтверждённых (закрытых) данных старшего ТФ.
- Все сигналы оцениваются на закрытии бара (`alert.freq_once_per_bar_close`).
- Будущие данные не используются ни в одном месте кода.
🧠 **Основные возможности**
- Двойной ATR trailing stop (быстрый + медленный) для структуры волатильности
- Трендовый фильтр на CCI со старшего таймфрейма (без перерисовки)
- Тепловая карта объёма по статистическому отклонению (3 уровня)
- Генерация сигналов с ограничением по сессии и визуальным фоном
- Динамическая система выхода по трейлинг-стопу
- Встроенный калькулятор размера позиции с ATR-буфером
- Многоуровневая справочная таблица тейк-профитов
- Готовые алерты с полным торговым контекстом
- Полностью настраиваемые параметры
- Pine Script v6
📈 **Рекомендации по использованию**
- Для лучших результатов устанавливайте таймфрейм Trend Indicator выше таймфрейма графика (например: график на 1 мин → Trend Indicator на 15 мин; график на 5 мин → Trend Indicator на 1 час).
- Комбинируйте с уровнями поддержки/сопротивления, рыночной структурой или подтверждением со старшего таймфрейма.
- Настраивайте пороги объёма в зависимости от типичного профиля объёма инструмента.
- Используйте таблицу расчёта позиции для поддержания последовательного управления рисками.
🔧 **Настраиваемые параметры**
Практически каждый аспект индикатора можно настроить через панель Настройки/Аргументы:
*ATR Trailing Stop:* Период и множитель быстрого ATR, период и множитель медленного ATR, возможность показать/скрыть быструю линию.
*Trend Indicator:* Выбор старшего таймфрейма, период CCI, множитель и период ATR для расчёта тренда, возможность показать/скрыть.
*Анализ объёма:* Длина MA, длина StdDev и три порога (средний, высокий, сверхвысокий) — настраивайте их под профиль объёма вашего инструмента. Возможность показать/скрыть окраску баров.
*Фильтр сессий:* Время начала/окончания сигналов, три зоны сессий (холодная/рабочая/горячая) с независимыми временами начала/окончания и цветами фона — всё настраивается под расписание вашей биржи.
*Расчёт позиции:* Капитал счёта (RUB), стоимость пункта (RUB), риск на сделку (%), буфер ATR (%) — эти параметры управляют таблицей расчёта позиции в реальном времени.
*Таблица TP:* Каждый уровень тейк-профита (TP0.5, TP1, TP1.5, TP2, TP3) можно индивидуально показать или скрыть. Размер текста обеих таблиц выбирается отдельно.
Эта гибкость позволяет адаптировать индикатор под различные инструменты, таймфреймы и торговые стили без изменения кода.
💰 **Рекомендуемый риск- и мани-менеджмент**
Настоятельно рекомендуется использовать структурированную систему управления рисками и капиталом с многоступенчатыми выходами:
*Риск на сделку:* 1% от капитала счёта. Встроенный модуль расчёта позиции автоматически вычисляет точное количество контрактов для этого уровня риска.
*Многоступенчатая система выходов:*
- **Достигнут 0.5R** — перевод стоп-лосса в безубыток (цена входа). Это полностью устраняет риск по сделке.
- **Достигнут 1R** — фиксация половины позиции для закрепления прибыли. Для оставшейся части выберите один из двух подходов в зависимости от результатов вашего собственного бэктеста: либо трейлинг стопа по медленной линии ATR, либо удержание до фиксированного R-мультипла (например, 1.5R, 2R или 3R).
Таблица TP на графике отображает все эти R-уровни в реальном времени, что позволяет визуально планировать выходы. Прошлые результаты не гарантируют будущих — всегда проверяйте любую стратегию выхода собственным бэктестом перед реальной торговлей.
📈 **Благодарности**
Создано на основе идей:
- ATR Trailing Stop — Ceyhun
- Trend Magic — Kivanc Ozbilgic
- Heatmap Volume — xdecow 指标

CCI Stoic Continuation - Crossing SignalsDescription
The CCI Stoic Continuation is a refined take on the classic Commodity Channel Index, designed specifically for traders who prioritize clarity and trend persistence over chasing volatile swings. Instead of viewing the CCI as a simple overbought/oversold oscillator, this indicator treats it as a momentum thermometer .
By utilizing a multi-layered threshold system, the indicator helps traders distinguish between a nascent trend (Early Momentum) and a confirmed, high-velocity move (Strong Momentum).
How It Works
The script visualizes four distinct phases of price action based on the relationship between the CCI and key threshold levels ($10$ and $80$):
1 Early Bullish (Teal) : CCI crosses above $+10$. This suggests momentum is beginning to shift upward.
2 Strong Bullish (Cyan) : CCI crosses above $+80$. This indicates high-velocity trend continuation.
3 Early Bearish (Light Orange) : CCI crosses below $-10$. The first sign of downside pressure.
4 Strong Bearish (Red) : CCI crosses below $-80$. Indicates significant conviction in the downward move.
Key Features
• Heat Fills : The background of the indicator pane is shaded to provide an immediate psychological "feel" for the current market environment.
• Bar Coloring : Trend colors are applied directly to your price bars, allowing you to stay focused on the price action while monitoring momentum shifts.
• Transition Markers : Vertical dashed lines appear in the indicator pane whenever a momentum state changes, highlighting the exact moment a "Stoic" entry or exit might be considered.
• Precision Alerts : Built-in alert logic for both "Early" and "Strong" signals in both directions.
Usage Tips
• Trend Alignment (CRITICAL) : Do not take every signal. Only execute entries aligned with the higher-timeframe trend or overall market bias. This indicator is designed for continuation, not reversals.
• The Stoic Entry : Use the "Early" signal to prepare, and look for "Strong" confirmation to enter once the trend is clearly established.
• The Zero Line : The yellow zero line acts as the "Neutral Zone." Price action staying consistently above or below this line validates the broader trend bias.
• Timeframes : While optimized for standard settings, it performs exceptionally well on the 15m, 1h, and 4h timeframes.
Technical Settings
• CCI Length : Default 20 (Adjustable for sensitivity).
• Early Level: 10 (Customizable for tighter or looser entries).
• Strong Level: 80 (The threshold for confirmed momentum).
Author : Konstantinos Trovas
Version : 6.0 (Pine Script)
指标

AG Pro CCI Reversion Quality [AGPro Series]AG Pro CCI Reversion Quality
Overview
AG Pro CCI Reversion Quality is a chart-based analysis framework designed to evaluate the quality of potential mean reversion conditions after meaningful CCI displacement. The script is not built around the simplistic idea that every overextended reading should immediately reverse. Instead, it focuses on whether a stretch condition begins to mature into a more structured, readable, and context-aware reversion environment.
The core objective is to separate raw CCI extremes from higher-quality reversion candidates. In many conventional oscillator workflows, a high positive or negative CCI reading is treated as a direct trigger. This script does not follow that approach. A strong stretch may still reflect healthy continuation, trend persistence, or unstable counter-trend conditions. For that reason, the script evaluates the quality of the reversion setup rather than the existence of a threshold breach alone.
The indicator is built for users who want a more selective framework around mean reversion. It examines whether price has deviated enough from an EMA-based reference mean, whether the reversion path remains meaningful, whether trend pressure is working against the setup, and whether recent structure suggests a cleaner or more crowded return path. The output is a contextual quality view rather than a one-dimensional overbought or oversold label.
This means the script should be understood as a decision-support tool for chart study and workflow organization. It is intended to help users distinguish between conditions that are immature, weak, blocked, developing, or stronger within a mean reversion context. It does not guarantee that price will reverse, and it does not assume that every stretch condition deserves a fade.
What the script does
The script monitors CCI displacement and then evaluates whether that displacement is beginning to convert into a more credible reversion environment. In practical terms, the workflow asks a sequence of questions. First, is there a meaningful stretch? Second, is the move beginning to lose directional quality or show reversion readiness? Third, is there enough room back toward the mean to matter? Fourth, is dominant trend pressure still strong enough to reduce the attractiveness of fading the move? Fifth, is nearby structure relatively clean, or is the path crowded by congestion and repeated mean interaction?
By combining those layers, the script attempts to reduce the noise associated with raw oscillator threshold logic. A positive stretch does not automatically imply a short setup. A negative stretch does not automatically imply a long setup. The script instead checks whether the overall reversion context is becoming more coherent.
This framework can be useful in discretionary workflows where users want to prioritize cleaner mean reversion candidates over mechanically reacting to every extreme oscillator reading. It is also useful for users who prefer a visual structure that summarizes context rather than one that continuously emits aggressive directional prompts.
Unique edge
The unique edge of this script is that it treats CCI as the starting point of the analysis, not the end point. Many oscillator-based studies stop at the detection of an extreme value. AG Pro CCI Reversion Quality continues beyond that stage and asks whether the extreme is maturing into a higher-quality reversion environment.
This makes the tool different from a basic CCI threshold script, a classic overbought/oversold marker, or a simple cross-based reversal detector. The script is not designed to label every extreme. It is designed to grade the environment around the extreme.
The indicator also keeps a clear distinction between stretch direction and stretch intensity. A market may be in a positive stretch or a negative stretch, but the degree of that stretch can still vary between mild, extended, and extreme conditions. In parallel, the script separately estimates reversion quality, trend pressure against the reversion idea, distance back to the reference mean, and structural friction. This multi-layered structure is meant to help users avoid treating all extreme readings as equivalent.
Another important difference is that the script explicitly accounts for context that can weaken a counter-trend reversion idea. Strong directional pressure, repeated interactions with the mean, and crowded local structure can all reduce the clarity of a fade. Instead of ignoring those conditions, the model reflects them in the displayed quality state.
Methodology
The script begins with a CCI calculation and identifies whether price is in a neutral regime, a positive stretch regime, or a negative stretch regime. It then classifies stretch intensity according to threshold-based displacement logic. The purpose of this stage is to define whether the market is extended enough for reversion analysis to become relevant.
From there, the indicator evaluates reversion readiness. This layer looks for signs that the stretch may be beginning to lose directional quality. Rather than relying on one isolated condition, the readiness component blends several pieces of information, such as directional change in CCI behavior, body structure, wick behavior, and simple stalling characteristics. This is meant to produce a broader view of whether reversion conditions are starting to organize.
The model then evaluates distance to mean. This matters because a reversion concept is less meaningful if price is already too close to the reference mean, while a more meaningful opportunity may exist when displacement remains materially extended. The reference anchor used here is an EMA-based mean, and the script also visualizes an ATR-based reversion zone around that mean.
Trend pressure is treated as a separate contextual penalty. This is a key design choice. A mean reversion idea that opposes strong directional pressure may be materially weaker than a similar stretch in a less forceful trend environment. The script therefore estimates how much prevailing directional pressure works against the reversion idea and reduces the effective quality view accordingly.
Structure friction is also included. This component is intended to reflect whether the recent path is relatively clean or crowded. Repeated interaction with the mean, compression, and congestion can reduce the clarity of a reversion path. Instead of assuming that all distance from the mean is equally attractive, the script attempts to reflect when the path back toward the mean is noisy or structurally inefficient.
All of these elements are combined into a composite Reversion Quality view. The final output is then expressed through panel information, chart labels, the zone display, and state logic.
State model
The state model is intentionally selective. It is meant to help users read context, not flood the chart with constant directional calls.
NEUTRAL indicates that there is no active stretch regime currently qualifying for reversion analysis.
WATCH indicates that a stretch exists and some reversion characteristics are forming, but the overall quality remains in an earlier or less mature stage.
READY indicates that the reversion quality has advanced enough to meet the preferred threshold defined by the user inputs. This does not imply certainty or guaranteed reversal. It simply means that the model sees a stronger monitored reversion context than it did at lower-quality states.
WEAK indicates that a stretch may exist, but the quality remains below the preferred threshold. This state is intentionally treated with caution.
BLOCKED indicates that the environment is materially impaired by elevated opposing pressure or structural friction. In other words, the stretch may exist, but the model does not consider the reversion context clean enough.
These states are designed to provide a workflow hierarchy rather than a promise hierarchy. The purpose is to help users prioritize and interpret, not to replace judgment.
Visual structure
The reference mean is displayed as an EMA-based mean line. Around it, the script plots an ATR-based reversion zone. This zone is intended to help users see the region surrounding the mean that is being used as the reversion anchor. The zone becomes more visually expressive when an active stretch context is present and more neutral when no active stretch is in focus.
The on-chart labels are designed to show the dominant local state when relevant. Depending on user settings, the script can display WATCH, READY, BLOCKED, and optionally WEAK labels. The label system is filtered by spacing logic so the chart remains more readable and does not endlessly repeat the same message on adjacent bars.
The information panel summarizes the active context. It is designed to show state, current reversion side, stretch direction, stretch intensity, reversion quality, trend pressure versus reversion, distance to mean, structure friction, setup bias, and a short risk note. The panel can also be repositioned from the settings, allowing the user to adapt placement to chart layout and personal preference.
The chart guide labels are included to make the mean and zone easier to identify visually. Their role is descriptive, not predictive.
Signals and alerts
The alert structure is built around monitored reversion states rather than trading promises. The available alert conditions include Ready Long Reversion, Ready Short Reversion, Watch Long Reversion, Watch Short Reversion, Reversion Quality Upgrade, and Reversion Quality Breakdown.
These alerts are designed to notify the user that the modeled reversion environment is changing. They should not be interpreted as guaranteed turning points. The script does not know future price behavior and does not claim to identify all reversals. It only identifies conditions that fit its internal reversion-quality logic.
Because different assets, sessions, and volatility structures behave differently, users should always validate whether the alert behavior matches their own chart-reading process and timeframe preference.
Key inputs
The script includes inputs for CCI length, reference mean length, multiple stretch thresholds, READY and WATCH thresholds, trend pressure filter strength, structure friction lookback, reversion zone width, label spacing, background highlight transparency, and visual display controls.
These inputs are intended to let users adapt the framework to different instruments and chart conditions. The script is not presented as universally optimal out of the box for all markets or all styles. Some users may prefer a more selective threshold structure, while others may prefer earlier WATCH states. Similarly, different assets may respond differently to the same mean length or zone width.
The visual controls are included to help users keep the chart readable. Users can enable or disable signal labels, WATCH labels, WEAK labels, background highlights, guide labels, and the information panel. Label size and panel text size are also configurable.
How to interpret the tool
A useful way to interpret the script is to think of it as a contextual filter around reversion conditions. A high stretch value alone is not enough. The quality concept becomes more meaningful when stretch, readiness, distance to mean, and contextual penalties begin to align.
If the script is neutral, it is signaling that no active stretch regime is currently in focus. If it is in WATCH, the script sees an emerging reversion environment, but one that may still be early or incomplete. If it reaches READY, the model is identifying a stronger monitored reversion context according to its current thresholds. If the state is BLOCKED, the model is emphasizing that pressure or structure is reducing the attractiveness of the reversion idea.
The panel is especially helpful for separating why a setup is weak. In some cases, quality may be limited because distance to mean is too thin. In other cases, trend pressure may still be high. In others, structure friction may be elevated even if displacement exists. This decomposition is intentional because it gives the user a more transparent framework than a single opaque signal.
What this script is not
This script is not a simple CCI threshold indicator. It is not designed to mark every move above or below a fixed level as a reversal opportunity.
It is not a guaranteed turning-point detector. Markets can remain extended for longer than expected, and strong trends can continue even after oscillator readings become extreme.
It is not a standalone execution system. The script does not account for all trade management variables, liquidity considerations, news catalysts, slippage, or user-specific risk parameters.
It is not a substitute for independent chart reading. It is intended to support analysis, not replace it.
Limitations and transparency
Like any chart-based model, this script has limitations. CCI extremes can persist, and a stretch can remain extended longer than a reversion-focused framework may prefer. In strong continuation phases, what appears to be a mature stretch can still fail to revert meaningfully.
The reversion-quality approach is also sensitive to the interaction between volatility, price structure, and trend behavior. Different markets can produce different behavior profiles. A configuration that feels balanced on one asset or timeframe may feel too early or too conservative on another.
The structure friction layer is an estimate, not an objective statement of future path quality. The trend pressure component is likewise a contextual model, not a certainty model. The script uses observable chart information to organize conditions, but it does not predict future order flow.
Users should also understand that visualization choices are meant to improve readability, not imply certainty. The mean line, reversion zone, state labels, and background highlights are interpretive aids.
Risk disclosure
This script is provided for chart analysis, research, and workflow support. It does not provide financial, investment, legal, or tax advice. Nothing displayed by the script should be interpreted as a promise of outcome or a guarantee of reversal.
All markets involve risk. Mean reversion concepts can fail, continuation can persist, and volatility conditions can change rapidly. Users should apply independent judgment, appropriate risk controls, and broader market context before acting on any chart-based interpretation.
The script should be used as one analytical layer among many, not as a self-sufficient decision engine.
Summary
AG Pro CCI Reversion Quality is a selective mean reversion quality framework built around CCI displacement, EMA-based mean reference logic, distance-to-mean context, trend pressure, and structure friction. Its purpose is not to say that every extreme should fade. Its purpose is to help identify when an extreme begins to organize into a more structured reversion environment.
The model is intended for users who want a cleaner, more context-aware interpretation of stretch conditions than a traditional threshold-only oscillator can provide. By separating stretch direction, stretch intensity, reversion quality, and contextual penalties, the script aims to make mean reversion analysis more structured, more transparent, and more selective.
指标

Double Commodity Channel Index - DCCI | TR🎯 Overview
Double Commodity Channel Index - DCCI | TR is an advanced oscillator developed by Tiagorocha1989 that enhances the classic Commodity Channel Index (CCI) by applying the CCI formula twice. This “double CCI” approach amplifies trend signals, reduces lag, and helps traders identify acceleration, deceleration, and potential turning points earlier than traditional CCI. With dual‑mode operation (zero‑line or moving‑average crossovers), an extensive selection of moving average types, and comprehensive visual customization, DCCI provides a powerful tool for momentum and reversal analysis.
🔧 How It Works
The standard CCI measures the current price level relative to an average price over a given period, normalized by the mean deviation. Double CCI applies this same logic to the CCI values themselves, creating a “momentum of momentum” effect that highlights changes in the underlying CCI’s behaviour.
Core Calculation Logic:
First CCI:
CCI = (Typical Price - SMA of Typical Price) / (0.015 × Mean Deviation)
where the period is user‑defined Length DCCI and the source is Source DCCI.
Double CCI (DCCI):
DCCI = 2 × CCI - ta.cci(CCI, Length_DCCI)
i.e., the current CCI minus the CCI of CCI (applied to the CCI series) and then doubled, effectively smoothing and amplifying changes in CCI.
Reference Line (Entry_DCCI):
The indicator compares DCCI to a reference line that can be either:
Zero Line (classic mode) – signals occur when DCCI crosses above or below zero.
DCCI MA (enhanced mode) – the reference line becomes a moving average of DCCI itself, providing smoother, filtered signals.
The moving average type and length are fully customizable, with support for 12 different MA variants (see Key Features).
The resulting oscillator oscillates around the chosen reference line:
DCCI above reference → upward acceleration in CCI (bullish momentum)
DCCI below reference → downward acceleration in CCI (bearish momentum)
Magnitude indicates the strength of the acceleration. Values above/below the traditional ±100 or ±200 levels often signal strong momentum, but DCCI is unbounded.
✨ Key Features
🔹 Dual Operating Modes
Zero Line Mode: Classic signals when DCCI crosses above or below zero – simple and intuitive.
DCCI MA Mode: Smoother signals when DCCI crosses its own moving average – reduces whipsaws in choppy markets.
🔹 Extensive Moving Average Selection
Choose from 12 MA types for the DCCI MA line, each with its own characteristics:
EMA, SMA, RMA, WMA, VWMA, HMA, DEMA, TEMA, TRIMA, FRAMA, SWMA, T3.
The T3 MA includes an adjustable T3 Factor for fine‑tuning smoothness.
🔹 Customizable CCI Parameters
Length DCCI: Lookback period for both CCI calculations (default 55).
Source DCCI: Price source for the first CCI (default Close).
(The typical price used in CCI is internally derived from high, low, close.)
🔹 Extended Range Visualization
Gradient fills are drawn between DCCI and the reference line, with fixed bounds at +300 and -300. These zones help visualise extreme readings, referencing classic CCI overbought/oversold levels while accommodating DCCI’s unbounded nature.
🔹 Customizable Color Themes
Eight distinct color schemes to match your chart aesthetics:
Classic, Modern, Robust, Accented, Monochrome, Moderate, Aqua, Cosmic
Each theme defines separate colors for bullish and bearish states.
🔹 Comprehensive Visual Feedback
Colored DCCI Line: Changes colour based on its position relative to the reference line.
Signal Line: Yellow line representing the zero or MA reference.
Gradient Fill Zones: Semi‑transparent fills showing extreme momentum areas (overbought/oversold zones).
Dynamic Zone Fills: Additional fill between DCCI and the reference line, coloured by the prevailing bias.
Color‑Coded Candles: Bars reflect the current DCCI bias (above or below reference).
Signal Markers: Triangle up/down symbols at crossover points.
Live Value Display: Current DCCI value shown in a floating label near the last bar.
Trend Table: Bullish/Bearish status displayed in a table on the chart.
🔹 Ready‑to‑Use Alerts
Built‑in alert conditions trigger LONG when the DCCI is above the reference line (bullish bias) and SHORT when below the reference line (bearish bias), for both operating modes.
⚙️ Settings Summary
Setting Description Default
Color Choice Select from eight visual themes Classic
Length DCCI Lookback period for both CCI calculations 55
Source DCCI Price source for the first CCI Close
Entry/Exit Signal Choose between zero‑line or DCCI MA mode 0
Length MA Moving average period for DCCI MA mode 365
Moving Average Type of moving average for the signal line (12 options) EMA
T3 Factor Factor for T3 moving average (0–1) 0.7
📈 Practical Applications
🔹 Trend Acceleration Detection
The slope and position of DCCI relative to the reference line quickly reveal whether CCI momentum is accelerating or decelerating. Steeply rising DCCI indicates bullish acceleration; steeply falling DCCI signals bearish acceleration.
🔹 Zero‑Line Crossovers
In Zero Line mode, crossovers provide clear signals:
Crossover above zero → bullish acceleration, potential trend reversal up.
Crossunder below zero → bearish acceleration, potential trend reversal down.
🔹 Signal‑Line Crossovers
In DCCI MA mode, crossovers between DCCI and its moving average generate filtered signals:
DCCI crosses above its MA → bullish signal.
DCCI crosses below its MA → bearish signal.
These signals work well in trending markets by reducing false entries.
🔹 Overbought / Oversold Conditions
Although DCCI is unbounded, traditional CCI levels (e.g., +100, -100, +200, -200) can be referenced. Extreme DCCI readings (above +300 or below -300) often coincide with strong momentum and may precede reversals or pullbacks.
🔹 Divergence Trading
Double CCI is excellent for spotting divergences:
Bullish Divergence: Price makes a lower low while DCCI forms a higher low → possible upside reversal.
Bearish Divergence: Price makes a higher high while DCCI forms a lower high → possible downside reversal.
Divergences are most reliable after extended trends or when DCCI is at extreme levels.
🔹 Momentum Confirmation
The magnitude of DCCI confirms trend strength:
Large positive values → strong bullish acceleration.
Large negative values → strong bearish acceleration.
Values nearing the reference line → momentum slowing, potential trend change.
🔹 Centerline Rejections
When DCCI approaches the reference line (zero or MA) but reverses before crossing, it can signal trend continuation – a common pattern in strong trends.
🔹 Multiple Timeframe Analysis
Compare DCCI readings across timeframes: higher‑timeframe DCCI defines the primary trend, while lower‑timeframe DCCI helps pinpoint entry and exit timing.
🎯 Ideal For
✅ CCI Enthusiasts looking for a more responsive, smoothed version of the classic indicator.
✅ Trend Traders seeking confirmation of trend strength and direction.
✅ Momentum Traders wanting an early view of acceleration and deceleration.
✅ Divergence Traders looking for leading reversal signals.
✅ Swing Traders capturing medium‑term momentum shifts.
✅ System Developers needing a robust, customisable crossover‑based strategy.
✅ Beginner Traders who appreciate clear visual signals and multiple learning modes.
📌 Key Takeaways
Double CCI Logic: Applying the CCI formula twice amplifies trend signals and reduces lag compared to standard CCI.
Dual‑Mode Flexibility: Choose zero‑line simplicity for clear entries or MA‑smoothed signals for filtered trades.
Unbounded Nature: DCCI has no fixed upper/lower limits, making it suitable for strongly trending instruments; traditional levels (e.g., ±100, ±200, ±300) serve as useful reference zones.
Extensive MA Options: 12 moving average types give you complete control over the smoothness and responsiveness of the signal line.
Rich Visuals: Colour themes, gradient fills for extreme zones, candle colouring, and live value labels provide immediate market context.
Divergence Capability: The double calculation often reveals divergences earlier than simple CCI.
Alert‑Ready: Pre‑built alerts for both LONG and SHORT signals based on bias.
⚠️ Important Notes
Because DCCI is unbounded, its scale can vary significantly between instruments and timeframes. The gradient fills at ±300 are arbitrary reference points derived from classic CCI overbought/oversold levels; they may not represent actual extreme conditions for all instruments.
The default Length DCCI of 55 offers a medium‑term perspective. Shorter lengths (e.g., 20) produce more responsive signals, while longer lengths (e.g., 100) are better for identifying major trends.
The default Length MA of 365 in DCCI MA mode is designed for a long‑term context on daily charts; adjust it to match your trading horizon.
Divergences are most reliable when they occur after extended trends and are confirmed by other tools.
Always combine Double CCI with proper risk management and additional confirmation before live deployment.
Disclaimer: This indicator is provided for educational and informational purposes only. Past performance does not guarantee future results. Always test thoroughly and align with your personal risk management strategy. 指标
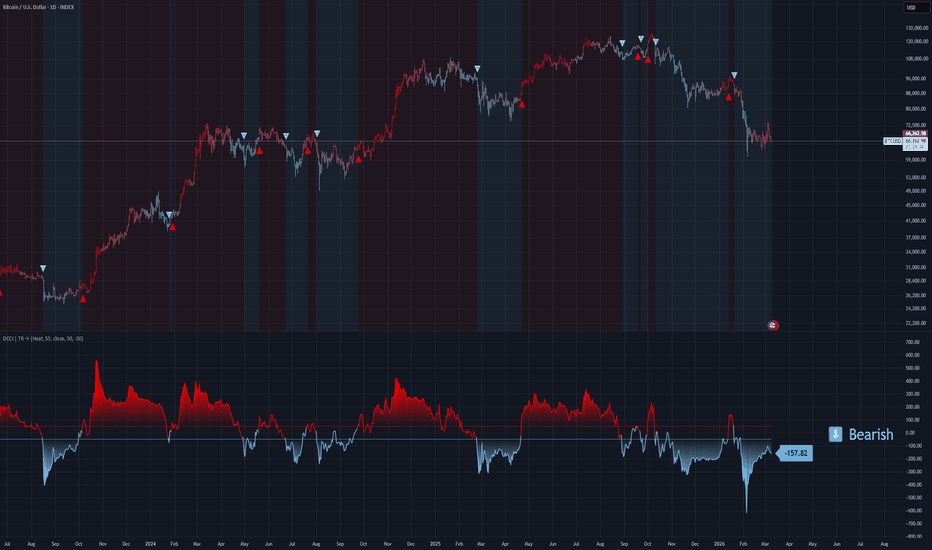
CCI Pro + Turtle + MACD/RSI Power📊 CCI Pro + Turtle Strength + MACD/RSI Power
🔥 Multi-Indicator Confluence Momentum System
CCI Pro + Turtle + MACD/RSI Power is an advanced trend strength and momentum confirmation indicator designed for traders who want high-probability entries using multi-layer confirmation instead of relying on a single indicator.
This system intelligently combines CCI momentum, Turtle breakout logic, MACD trend power, and RSI strength filtering into one clean and distraction-free chart.
Built especially for intraday, index, options, and swing traders.
✅ Core Concept
Markets move strongly only when momentum, trend, and strength align together.
This indicator detects those moments using a Power Confluence Engine that evaluates:
Momentum (CCI)
Breakout Strength (Turtle System)
Trend Acceleration (MACD)
Market Pressure (RSI)
When multiple systems agree → probability increases.
⚙️ Indicator Components
📈 CCI Pro Engine
Enhanced Commodity Channel Index (CCI)
EMA trend alignment filter
Zero-line momentum detection
Overbought / Oversold zones
Dynamic strength histogram
Automatic divergence detection
Helps identify:
✅ Trend direction
✅ Momentum expansion
✅ Potential reversals
🐢 Turtle Strength Filter
Inspired by the classic Turtle Trading System.
Features:
Donchian channel breakout detection
Short & long trend channels
ATR-based strength evaluation
Breakout momentum confirmation
Used internally to validate real trend movement instead of false signals.
📊 MACD Power Filter
Measures trend acceleration and momentum quality.
Includes:
Histogram strength validation
Trend alignment confirmation
Optional recent crossover filter
Momentum intensity calculation
Removes weak trend entries.
⚡ RSI Power System
Adds market pressure confirmation:
Bull/Bear zone filtering
Midline trend validation
Extreme momentum boost (>80 / <20)
Divergence awareness
Prevents entries against market strength.
🔥 Power Confluence Modes
Choose how strict confirmations should be:
✅ All Confirm
All systems must align
➡ Highest accuracy, fewer signals
✅ Majority (2/3)
At least two confirmations
➡ Balanced trading mode
✅ Any Confirm
Fast signals
➡ Aggressive trading style
💪 Strength Engine
The indicator calculates a dynamic strength score using:
CCI momentum
Turtle breakout pressure
MACD expansion
RSI extremes
Perfect confluence multiplier
This produces a real-time trend strength percentage.
📋 Smart Information Table
Clean on-chart dashboard displaying:
CCI + EMA Status
Trend Direction
Market Zone
Strength %
Turtle Confirmation
Confluence Score
MACD Status
RSI Status
No need to monitor multiple indicators separately.
🚨 Built-In Alerts
Ready for live trading automation:
🔥 MEGA Bullish / Bearish Alignment
⚡ Power Confluence Signals
Ultra Trend Signals
CCI Zero Cross + Confirmation
MACD + RSI Momentum Signals
Overbought / Oversold Alerts
Momentum Expansion Alerts
🎯 Best Used For
✅ Index Trading (NIFTY / BANKNIFTY)
✅ Options Trading
✅ Intraday Trading
✅ Momentum Breakouts
✅ Trend Following
✅ Swing Trading
Works well on 5m, 15m, 1H, and higher timeframes.
💡 Trading Idea
Typical bullish condition:
CCI above zero & EMA
Turtle breakout detected
MACD momentum positive
RSI confirms strength
→ Indicates strong trend continuation probability.
⚠️ Disclaimer
This indicator is a decision-support tool and does not guarantee profits. Always use proper risk management and confirmation with price action. 指标

Commodity Channel Index Pullback (CCI/P) v1Commodity Channel Index Pullback (CCI/P) v1
CCI/P v1 is a pullback-style oscillator built around two Commodity Channel Index calculations:
CCI #1 (Primary): identifies momentum extremes using an adjustable Absolute Level (± level).
CCI #2 (Secondary) or MA of CCI #2: acts as a simple regime filter based on whether it’s above or below 0.
What you’ll see
CCI #1 plotted as the primary line.
Fixed reference levels at ±100 and ±200, with subtle gray background zones.
Dynamic “plot zones” when CCI #1 exceeds ±Absolute Level:
Overbought plot (red)
Oversold plot (green)
Optional CCI #2 / MA2 area (plotted behind everything), colored:
Above 0: #089981
Below 0: #b2b5be
Optional candle coloring based on CCI #2 / MA2 regime (toggle in settings).
Triangle logic
Triangles flag “pullback + regime alignment” conditions:
Green triangle: CCI #1 < -Absolute Level AND CCI #2/MA2 > 0
Red triangle: CCI #1 > +Absolute Level AND CCI #2/MA2 < 0
Alerts
Alert conditions are included for:
Green / Red triangle setups (fires on the first bar the condition becomes true)
CCI #1 crossing above/below ±Absolute Level (and returning inside)
CCI #2/MA2 crossing above/below 0 (based on Plot Mode)
How I use it
This is a pullback framework, so I treat CCI #2/MA2 as the “environment” and CCI #1 as the “stretch”:
Pick your regime filter
Use MA of CCI #2 if you want a steadier filter (fewer flips).
Use CCI #2 if you want it more responsive.
Let CCI #1 reach an extreme
I’m generally looking for CCI #1 to push beyond the Absolute Level threshold, then watch for the pullback condition to align with the regime.
Use the triangle as a “checklist complete” marker
The triangle is not a guarantee—just a structured moment where stretch + regime align.
I still validate with structure/levels/volatility context (e.g., key highs/lows, prior range boundaries, session context).
Risk is external
Stops/targets aren’t built in—position sizing and exits depend on your instrument and volatility.
If you automate alerts, consider triggering alerts on bar close for more stable signals.
Notes
This script does not use higher-timeframe security() calls. Values may update during the currently-forming bar until it closes (standard TradingView behavior).
Disclaimer
This indicator is for educational/informational purposes only and is not financial advice. Always test on your market and timeframe and manage risk appropriately.
Changelog / v1 Notes
v1 (initial public release): Dual-CCI pullback framework with optional CCI #2 or MA(CCI #2) regime area, dynamic OB/OS plot zones, triangle conditions, candle-color toggle, and a full alert set (triangles + CCI #1 threshold crosses + CCI #2/MA2 zero crosses). 指标