指标
指数移动平均线(EMA)

Support/Resistance & EMA Crossovers with AlertsPublic Script for Support/Resistance & EMA Crossovers with Alerts
指标

6 Moving Averages (SMA, WMA, EMA etc.)6 Moving Averages is a simple and flexible overlay indicator that lets you plot up to six moving averages on the price chart. Each moving average can be customized by type (SMA, EMA, WMA, etc.), length, color, and visibility, making it ideal for trend analysis, dynamic support and resistance, and moving-average confluence across any market or timeframe.
指标

Dual EMA (9 & 16) Customizable 📈 Dual EMA Indicator (Customizable & Preset Based)
The Dual EMA Indicator is a simple yet powerful trend-following tool that plots two Exponential Moving Averages (EMAs) on the price chart. It is designed for scalpers, intraday traders, and swing traders who rely on EMA crossovers and trend direction for decision-making.
This indicator allows full customization of both EMAs, including length, color, source, line width, and offset. Users can also enable or disable each EMA individually, keeping the chart clean and focused.
To make trading faster and easier, built-in preset EMA combinations such as 5–9, 9–21, and 16–34 are provided, which are commonly used for scalping and trend trading. A Custom mode is also available for traders who prefer their own EMA settings.
🔑 Key Features
Two EMAs in a single indicator
Preset EMA pairs for scalping and intraday trading
Fully customizable EMA lengths and sources
Change colors, line width, and offset
Enable/disable each EMA with a checkbox
Clean and lightweight with no lag
📊 How to Use
Fast EMA above Slow EMA → Bullish trend
Fast EMA below Slow EMA → Bearish trend
EMA crossovers can be used for entry and exit confirmation
Works well on 1m, 3m, 5m, 15m, and higher timeframes
This indicator is ideal for traders who want a simple, flexible, and reliable EMA setup without cluttering their charts.
指标

策略

指标

NeuraEdge ORB - Opening Range Breakout IndicatorOVERVIEW
NeuraEdge ORB is an open-source Opening Range Breakout indicator that automates the classic 15-minute ORB strategy. The indicator tracks the first 15 minutes of market action (9:30-9:45 AM ET), identifies breakouts above or below this range, and generates trading signals with automated stop loss and take profit calculations.
The Opening Range Breakout concept is based on the observation that the initial price action after market open often establishes directional bias for the trading session, as institutional order flow and overnight gap reactions manifest during this window.
CORE METHODOLOGY
Opening Range Construction:
The indicator uses session-based time detection to identify the 9:30-9:45 AM Eastern Time window. During this period, it tracks the highest high and lowest low to establish the opening range boundaries. The range is marked complete when the 15-minute window closes.
Calculation process:
OR High = Maximum high value during the 15-minute window
OR Low = Minimum low value during the 15-minute window
OR Midpoint = (OR High + OR Low) / 2
Range Size = OR High - OR Low (compared to 14-period ATR for context)
Breakout Detection:
The indicator identifies breakouts using close-price confirmation to reduce false signals from wicks:
Bullish breakout: Close above OR High (with previous close at or below OR High)
Bearish breakout: Close below OR Low (with previous close at or above OR Low)
The indicator tracks whether each direction has already broken to prevent duplicate signals on the same range.
Entry Type Logic:
Two entry methodologies are supported:
Breakout Mode - Signals immediately upon range break. Enters on the breakout bar when close confirms direction.
Retest Mode - Waits for price to break the range, then pullback to touch the range level before entering. Cancels if price moves too far beyond midpoint. This provides better entry prices with tighter stop losses.
Volume Confirmation:
Optional volume filter compares current bar volume to 20-period simple moving average. Requires volume > 1.2x average to validate breakout strength and filter low-conviction moves.
Fair Value Gap (FVG) Integration:
Optional confluence filter that checks for unfilled FVG in the breakout direction:
Bullish FVG detected when: current bar's low > two bars ago high (creating gap)
Bearish FVG detected when: current bar's high < two bars ago low (creating gap)
Minimum FVG size: 0.3x ATR to filter noise
FVG considered filled when price retraces to gap midpoint
Signals only generate when an unfilled FVG exists in the breakout direction, adding institutional order flow confluence.
Risk Management Calculations:
Three stop loss placement methods:
Opposite Side - SL at opposite end of opening range (classic ORB approach)
Midpoint - SL at range midpoint (tighter risk, lower reward potential)
ATR Based - SL at 1.5x ATR from entry (adaptive to volatility)
Take profit calculated as: Entry ± (Entry - Stop Loss) × Risk:Reward Ratio
Default 1.5:1 R:R ratio, adjustable from 1.0 to 5.0.
Performance Tracking:
The indicator maintains a trade history using Pine Script's type system:
Records entry price, stop loss, take profit, and direction for each signal
Tracks outcome when price hits stop loss or take profit levels
Auto-closes after 80 bars if neither level hit
Calculates rolling win rate from last 50 trades maximum
Displays W/L record in real-time dashboard
VISUAL COMPONENTS
Opening Range Box:
Semi-transparent blue box drawn from range start bar to current bar + 20, showing the established range boundaries visually.
Range Levels:
Green line at OR High (potential long entry level)
Red line at OR Low (potential short entry level)
Gray dotted line at OR Midpoint (reference level)
All lines extend 50 bars forward for anticipation.
Trade Signals:
Green up arrow with "LONG ORB Break" label below price
Red down arrow with "SHORT ORB Break" label above price
Dashed lines showing SL and TP levels extending 30 bars
Small labels marking SL and TP endpoints
Real-Time Dashboard:
Top-right panel displaying:
OR formation status (Forming / Complete / Waiting)
Current OR High, Low, and Range size (with ATR multiple)
Breakout status (Long / Short / None)
Volume status (High / Normal)
FVG presence (Bull / Bear / None)
Entry settings (Breakout/Retest, R:R, SL type)
Win rate percentage and W/L record
PRACTICAL APPLICATION
Ideal Market Conditions:
Liquid instruments: SPY, QQQ, IWM, high-volume stocks
Recommended timeframes: 1-minute or 5-minute charts for precise entries
Most effective during trending days with clear directional bias
Range size between 0.5-1.5x ATR typically provides best risk:reward
Usage Workflow:
Apply indicator at market open (9:30 AM ET)
Observe range formation during first 15 minutes
Wait for "Complete" status in dashboard
Monitor for breakout signals with volume/FVG confirmation
Enter on signal, place stop loss and take profit as marked
Avoid taking opposing signals on same day (trend following approach)
Retest vs Breakout Selection:
Use Breakout mode on high-momentum days with strong overnight gaps
Use Retest mode on slower days or when seeking better entry prices
Retest mode reduces signal frequency but improves entry quality
Time-of-Day Considerations:
The indicator includes a trading cutoff setting (default 3:00 PM ET) to avoid late-day chop and reduced liquidity. First-hour breakouts (10:00-11:00 AM) historically show strongest follow-through.
SETTINGS & CUSTOMIZATION
Display Options:
Toggle signals, opening range box, and dashboard independently
Clean visual design to reduce chart clutter
Opening Range Settings:
Opening range duration (5-60 minutes in 5-minute increments)
Default 15 minutes aligns with classic ORB methodology
Trading cutoff hour (10-16, representing 10:00 AM - 4:00 PM ET)
Entry Configuration:
Entry type (Breakout / Retest)
Volume confirmation toggle (requires 1.2x average volume)
FVG confluence toggle (requires unfilled gap in breakout direction)
Risk Management:
Stop loss placement (Opposite Side / Midpoint / ATR Based)
Risk:reward ratio (1.0 - 5.0, default 1.5)
Future: Trail stop after partial TP (currently placeholder)
Alert System:
Five alert conditions available:
Opening Range Complete
ORB Long Signal
ORB Short Signal
Breakout Up (range broken, regardless of signal)
Breakout Down (range broken, regardless of signal)
BEST PRACTICES
Recommended Usage:
Focus on highly liquid instruments with tight spreads
Use 1-5 minute charts for entry precision
Respect calculated stop losses (range defines maximum risk)
Typically 1-2 quality setups per day maximum
Consider overall market trend (SPY/QQQ direction)
Risk Considerations:
Very small ranges (< 0.3x ATR) prone to false breakouts
Very large ranges (> 2x ATR) may indicate gap day requiring adjusted expectations
Low volume breakouts fail more frequently
Avoid trading both directions on same day (pick strongest setup)
IMPORTANT DISCLOSURES
This indicator is provided free and open-source for educational purposes. The Opening Range Breakout strategy is a well-documented public domain trading concept. This implementation adds automation, visual clarity, and optional confluence filters.
No indicator guarantees profitable trades. Past performance does not predict future results. Traders are responsible for their own trading decisions and risk management. Always use appropriate position sizing and never risk more than you can afford to lose.
指标

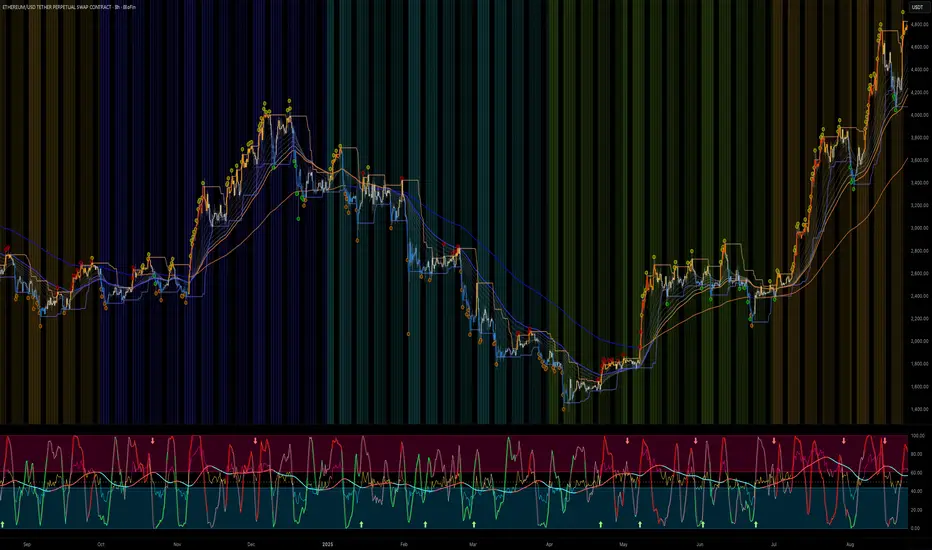
AlgoYields - AAlgoYields A — Everyday Overlay for Clean, Actionable Context
Please follow — more indicators & ideas coming soon!
Equipped with alerts and customizable styles, this overlay is designed for daily use: attractive look for fast reads, low noise, high signal. It blends a few trusted tools into a single, elegant view so you can track trend, momentum, and breakouts without overcrowding.
What’s inside
Trading Session Backdrop
Quarter-tinted background (distinct color per quarter) for quick macro orientation; subtle week-to-week transparency shifts; CME pre-market, regular session, and post-market shading; weekends left clear.
Includes multiple curated color palettes. Ask if you want a custom theme.
EMA Cloud
A staircase of short EMAs for trend strength + two macro EMAs (defaults: 80 & 200). Macro EMAs auto-tint: blue when price is above, orange when below.
All lengths are user-configurable.
RSI-Derived Bar Colors
Contextual bar coloring by RSI level/zone to make strength/weakness instantly visible.
Comes with multiple palettes optimized for light/dark charts.
Price Channel & Breakouts
Select band source: Close (tight), HLC3 (medium), or High/Low (widest). Breakout dots print above/below bars and are color-coded by trend context:
Green : break below lower band in an uptrend (buy-the-dip candidates).
Yellow : break above upper band in an uptrend (potential exhaustion / quick scalp).
Orange : break below lower band in a downtrend (continuation shorts).
Red : break above upper band in a downtrend (fade-the-pop entries).
Buffer values can be tuned to reduce noise or enhance reactivity
How to use it
––––––––––
Bullish Breakdowns ( green dots) — often attractive dip-buys within uptrends.
Confirm with macro-EMA slope: steeper = stronger follow-through; flatting slope = take quicker profits and watch for potential rollover.
Bullish Breakouts ( yellow dots) — be selective. If RSI confirms strength, these can be solid for quick scalps; otherwise, beware “touch-and-fade” at the upper band.
Apply the same logic in reverse for shorts:
Bearish Breakouts ( red ) and Bearish Breakdowns ( orange ) favor short entries/continuations.
Inputs worth tweaking
EMA lengths (short stack + macro 80/200 defaults).
RSI bar-color palette (pick for light/dark themes).
Channel source (Close / HLC3 / High-Low) and breakout buffer.
Session/quarter palette selection.
Alerts
Choose from built-in signals (channel breaks, EMA crosses, significant RSI levels).
Notes & best practices
Backtest breakouts per asset/timeframe to tune buffers and TP/SL targets.
Use level + slope together: RSI/EMA levels flag conditions; slope confirms impulse/continuation.
Let the EMA cloud and macro EMAs set bias; use RSI bars and breakout dots for timing.
指标
EMA 8 48 System v1Short Description:
A trend-following indicator using EMA crossovers, ATR-based volatility filter, and a cooldown period to reduce false signals. Designed for clear buy/sell signals in trending markets.
Full Description:
What is this indicator?
This script implements a dual EMA crossover system (8-period and 48-period EMAs) with a trend filter (EMA200), ATR-based volatility filter, and a cooldown period to avoid overtrading.
It visually plots EMAs, buy/sell signals, and ATR-based stop loss/target levels.
Why is it useful?
Helps traders identify high-probability trend entries and avoid choppy, low-volatility conditions.
Reduces false signals by requiring trend confirmation, sufficient volatility, and spacing out trades.
Suitable for intraday and swing trading on most liquid assets.
When to use:
Best used in markets showing clear trends (not sideways).
Works on most timeframes, but higher timeframes (15m, 1h, 4h, daily) tend to give more reliable signals.
How to spot buy and sell:
Buy: Green “BUY” label appears when EMA8 crosses above EMA48, price is above EMA200, and ATR is above the minimum threshold.
Sell: Red “SELL” label appears when EMA8 crosses below EMA48, price is below EMA200, and ATR is above the minimum threshold.
ATR-based stop loss and target levels are plotted for each signal.
Additional tips:
Adjust the minimum ATR and cooldown settings to match your asset’s volatility and your trading style.
Use in conjunction with price action or higher timeframe analysis for best results.
Avoid trading during low volatility or sideways markets, as signals may be less reliable.
Always backtest and forward-test before using live.
How to add signals and update settings:
Use the script’s input panel to adjust EMA lengths, ATR settings, minimum ATR, and cooldown period.
To add alerts, use TradingView’s “Add Alert” feature and select the buy or sell conditions from the script’s alert options.
For further customization, you can edit the script to add additional filters or notification logic.
This indicator is for educational purposes only. Always use proper risk management and do your own research before trading.
Disclaimer:
This script is for informational and educational purposes only and does not constitute financial advice or a recommendation to buy or sell any financial instrument.
Trading involves risk. Past performance is not indicative of future results. Always do your own research and use proper risk management.
The author is not responsible for any losses incurred from the use of this script. By using this script, you agree to take full responsibility for your trading decisions.
指标

ULTIMATE SMC FUSION HIGHER TIME FRAMES🔥 ULTIMATE SMC FUSION ADAPTED FOR HIGH TIME FRAMES
━━━━━━━━━━━━━━━━━━━━━━━━━━━━━━━━━━━━━━━━━━━━━━━━━━━━━━━━━━━━━━━━━
The high-performance, refined edition of the v4.1 Fusion suite. This Core version brings the signature "Balanced Entry" logic to your charts with enhanced HTF optimization and a zero-latency interface.
🚀 KEY FEATURES:
• BALANCED SIGNAL ENGINE: A proven mix of structure breaks and momentum-based institutional entries.
• HTF TURN DETECTION: Enhanced logic for Higher Timeframes to find major swing reversal opportunities.
• ON-CHART PERFORMANCE PANEL: Live tracking for win rates and growth stats to keep you in the flow.
• DYNAMIC ATR TARGETS: Take Profit and Stop Loss levels that adapt automatically to market volatility.
• OPTIMIZED SMC OVERLAYS: Clean, professional structure lines and order block visualizers.
• PURE LOCAL PROCESSING: No external API overhead—maximum responsiveness for fast decision making.
BEST FOR: Forex Scalp/Swing, Professional Charting, and Multi-Asset Analysis.
━━━━━━━━━━━━━━━━━━━━━━━━━━━━━━━━━━━━━━━━━━━━━━━━━━━━━━━━━━━━━━━━━
Feel free to adjust the settings to your own needs.
Make your own decisions when you trade, do not put all confidence into a script, it may fail also.
指标

EMABu indikatör; EMA 3, 5, 8, 10, 13, 20, 50, 88, 100 ve 200 periyotlu üstel hareketli ortalamaları tek bir seferde grafiğinize ekler ve her ortalama için ayrı ayrı alarm kurma imkanı sunar.
This indicator plots 10 different Exponential Moving Averages (EMA 3, 5, 8, 10, 13, 20, 50, 88, 100, and 200) simultaneously on your chart. It features individual alert conditions for each moving average, allowing you to set specific notifications for price crossovers at any period.
Main Features:
Multiple EMA Periods: Includes short, medium, and long-term averages.
Alerts: Individual alert conditions for all 10 EMA lines.
Visuals: Each line is colored differently for easy identification.
Price Labels: Values are visible on the right-hand price scale.
指标

Purra Buy Sell Signalsindicator.lk's purra buy sell is a precision-tuned indicator designed specifically for XAU/USD (Gold) 5-minute scalping. It combines a smoothed trend-filter (based on a multi-stage EMA cascade with adaptive smoothing) and an ATR-based trailing stop logic to generate high-confidence Buy and Sell signals directly on the price chart.
Ideal for short-term traders seeking clean, responsive entries with minimal lag, this tool helps you:
Catch early trend reversals
Avoid choppy false signals
Execute fast scalps during active gold sessions (London & Asian overlap)
Built with risk-aware logic and visual clarity in mind—green labels = long opportunities, red labels = short setups. Fully compatible with alerts for automated trade execution.
Optimized for XAUUSD on the 5-minute timeframe. Works best during high-liquidity hours.
🛠️ How to Use (for Gold 5-Minute Scalping)
Apply to Chart: Add the indicator to XAU/USD (Gold) on the 5-minute timeframe.
Signal Interpretation:
Green "Buy" label below bar: Strong bullish momentum—consider long entry.
Red "Sell" label above bar: Strong bearish momentum—consider short entry.
Confirmation Tips:
Trade only when the background ribbon or trend line (if enabled) aligns with the signal direction (green = uptrend, red = downtrend).
Avoid signals during major news events or low volatility (e.g., late NY session).
For higher accuracy, combine with price action (e.g., rejection candles, break of micro structure).
Risk Management:
Use tight stop-losses just beyond recent swing points.
Target 1:1 or 1:2 risk-reward; gold moves fast on 5M!
Alerts: Enable TradingView alerts on “Purra Long” / “Purra Short” conditions for real-time notifications.
指标

Air Gap Value for ScreenerAir Gap Value for Screener on 4 hours time frame which screen stock that have potential gap
指标

Trend Harmony🚀 Trend Harmony: Multi-Timeframe Momentum & Trend Dashboard
Trend Harmony is a sophisticated multi-timeframe (MTF) analysis tool designed to help traders identify high-probability setups by spotting "Market Harmony." Instead of flipping through charts, this indicator synthesizes RSI momentum and EMA trend structures from four different time horizons into a single, intuitive dashboard.
🔍 How It Works
The core philosophy of this indicator is that the most powerful moves happen when short-term momentum aligns with long-term trend structure. The script tracks four user-defined timeframes simultaneously.
1. The Trend Scoring Engine
The indicator evaluates the relationship between a Fast EMA (default 20) and a Slow EMA (default 50) across all active timeframes.
Bullish Alignment: Fast EMA > Slow EMA.
Bearish Alignment: Fast EMA < Slow EMA.
2. The Harmony Summary
At the bottom of the dashboard, the "Summary" status calculates the total "Harmony" of the market:
🚀 FULL BULL HARMONY: All selected timeframes are in a bullish trend.
📉 FULL BEAR HARMONY: All selected timeframes are in a bearish trend.
⚠️ CAUTION (Overbought/Oversold): Triggered when the market is in "Full Harmony" but RSI levels suggest the price is overextended (>70 or <30). This warns you not to "chase" the trade.
Neutral/Mixed: Timeframes are in conflict (e.g., 15m is bullish but Daily is bearish).
🛠 Key Features
Unified RSI Pane: View four RSI lines on one chart to spot divergences or "clusters" where all timeframes bottom out at once.
Dynamic Table: Real-time tracking of:
Price vs EMA: Instant visual (▲/▼) showing if price is above/below your key averages.
Smart RSI Coloring: RSI values turn Green during "Power Zones" (0–30 or 50–70) and Red otherwise.
Full Customization: Change timeframes (1m, 5m, 1H, D, etc.), EMA lengths, and RSI parameters to fit your strategy.
📈 Trading Strategy Tips
Wait for the Sync: The "Full Harmony" status is your signal that the "tide" is moving in one direction. Look for long entries when the status is Green and short entries when it is Red.
The Pullback Entry: When the summary says "Caution (Overbought)," wait for the RSI lines to cool down toward the 50 level before entering the trend again.
RSI Clustering: When all four RSI lines converge at extreme levels (30 or 70), a massive volatility expansion is usually imminent.
指标

指标

The Systemtable viewed bullish/bearish indicator. uses 9 & 20 ema crossings along with macd & rsi to identify the bullish/bearish trend. ability to toggle vwaps + emas.
Goal to consolidate the various indicators for users that don't pay for premium ++
指标

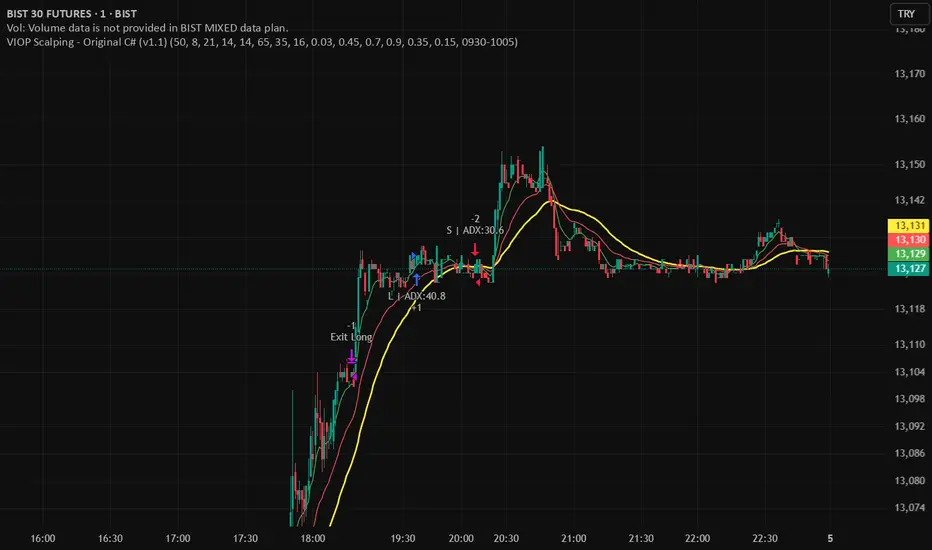
VIOP Scalping - OriginalVIOP Scalping – Original is a rule-based scalping strategy ported from an original C# logic set. It aims to trade only when trend direction, momentum, and trend strength align, then manages the position using fixed take-profit/stop-loss percentages with an optional trailing mechanism to protect gains during favorable moves.
This strategy is provided for educational and backtesting purposes only. It is not financial advice and does not guarantee profitability. Always test thoroughly before any live usage.
Core Concept
Follow the dominant WMA trend, confirm momentum with EMA separation, filter conditions with RSI + ADX, then exit using fixed TP/SL with trailing behavior after a defined profit threshold.
How the Strategy Works
Trend Direction is defined by WMA: above WMA = long bias, below WMA = short bias.
Momentum is measured via Fast EMA vs Slow EMA and the EMA difference.
Trend Strength is confirmed using ADX (must exceed a threshold).
RSI filters trades to avoid entering when momentum is likely overextended or weak.
A no-trade session blocks entries during a predefined time window (default 09:30–10:05).
Exit logic uses fixed percent TP/SL, with an optional trailing mechanism that activates after a profit threshold.
Inputs and Settings
Trend and Indicator Settings
Main Trend WMA: Determines directional bias (price above = long, price below = short).
Fast EMA / Slow EMA: Used to measure momentum and directional separation.
RSI Period: Filters entries based on RSI range constraints.
ADX Period: Measures trend strength (must exceed threshold to allow entries).
Threshold Settings
EMA Difference Threshold: Minimum EMA separation required to validate momentum.
ADX Threshold: Minimum ADX required to confirm trend strength.
RSI Long Ceiling: RSI must remain below this value for long entries.
RSI Short Floor: RSI must remain above this value for short entries.
Risk Management Settings
Take Profit %: Default TP distance in percent.
Strong Trend Take Profit %: Higher TP used when a “strong trend” condition is detected.
Stop Loss %: Fixed SL distance in percent.
Trailing Activation %: Profit threshold at which trailing starts.
Trailing Distance %: Trailing offset distance used once trailing is active.
Time Filter
No-Trade Hours: Default session is 09:30–10:05. During this window, the strategy does not open new trades.
Entry Logic
No-Trade Time Filter
If the current bar falls inside the no-trade session, entries are blocked.
Long Entry Conditions
Price is above the WMA trend line.
EMA difference is positive and greater than the EMA Difference Threshold.
EMA momentum is increasing (current EMA diff > previous EMA diff).
RSI is within the defined range (RSI > 48 and RSI < RSI Long Ceiling).
Close is higher than the previous close.
ADX is above the ADX Threshold.
Short Entry Conditions
Price is below the WMA trend line.
EMA difference is negative and lower than -EMA Difference Threshold.
Bearish momentum is increasing (current EMA diff < previous EMA diff).
RSI is within the defined range (RSI < 52 and RSI > RSI Short Floor).
Close is lower than the previous close.
ADX is above the ADX Threshold.
Strong Trend Logic (Dynamic TP Selection)
If price is far from the WMA (absolute distance > 20 points) AND EMA separation is strong (absolute EMA diff > 1.5 points), the strategy treats the environment as a strong trend.
In strong trend mode, the strategy uses “Strong Trend Take Profit %” instead of the default “Take Profit %”.
Exit Management (TP/SL + Trailing)
The strategy uses fixed percentage-based TP and SL levels.
Trailing logic is enabled via strategy.exit and activates only after price moves in profit by the defined Trailing Activation %.
Once activated, trailing follows price using the defined Trailing Distance % offset.
This is designed to secure partial gains during extended moves while still allowing room for continuation.
What You See on the Chart
WMA Trend Line (Main Trend Filter).
Fast EMA and Slow EMA (Momentum Confirmation).
Strategy entry/exit markers generated by TradingView.
Recommended Use
Scalping systems that rely on trend-following and momentum confirmation.
Markets where ADX filtering helps avoid choppy conditions.
Traders who want a simple, parameter-driven TP/SL system with trailing after confirmation.
Important Notes
The no-trade session depends on your chart/session settings. Ensure your symbol/session configuration matches your intended market hours.
Percent-based exits scale with price; results will vary across instruments and volatility regimes.
Always validate behavior using bar replay, forward testing, and realistic commission/slippage assumptions.
策略
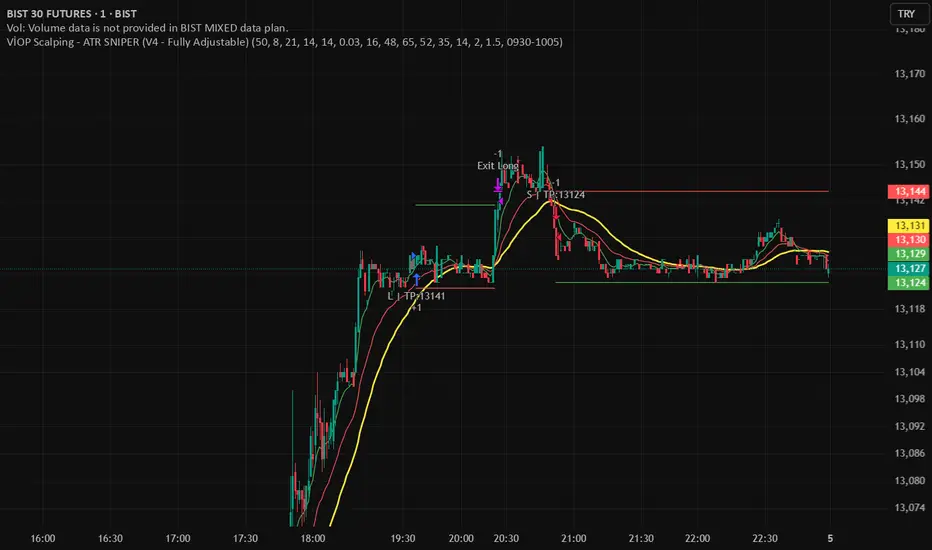
VIOP Scalping - ATR SNIPERVIOP Scalping – ATR SNIPER is a momentum-based scalping strategy designed to capture short, high-probability moves while keeping risk strictly defined using ATR-based stop-loss and fixed risk/reward targets. The strategy trades only when trend direction, momentum, and strength are aligned.
This script is provided for educational and testing purposes only. It does not guarantee profitability and must be used with proper risk management.
Core Idea
Trade in the direction of the dominant trend, confirm momentum acceleration, and manage risk using ATR-based dynamic stops and targets.
How the Strategy Works
The main trend is defined using a Weighted Moving Average (WMA).
Momentum is measured by the distance and direction between a fast EMA and a slow EMA.
Trend strength is confirmed using ADX.
RSI is used as a filter to avoid weak or overextended market conditions.
Entries are blocked during a predefined no-trade time window to avoid high-noise periods.
Long Entry Conditions
Fast EMA is above Slow EMA and the EMA difference is greater than the minimum threshold.
EMA momentum is increasing compared to the previous bar.
RSI is within the user-defined long range.
Current close is higher than the previous close.
ADX is above the minimum strength threshold.
Price is above the WMA trend line.
The current bar is not inside the no-trade session.
Short Entry Conditions
Fast EMA is below Slow EMA and the EMA difference is below the negative threshold.
Bearish EMA momentum is increasing.
RSI is within the user-defined short range.
Current close is lower than the previous close.
ADX is above the minimum strength threshold.
Price is below the WMA trend line.
The current bar is not inside the no-trade session.
Risk Management – ATR Sniper Logic
Stop-loss distance is calculated as ATR multiplied by the ATR Multiplier.
Take-profit distance is calculated using the defined Risk/Reward ratio.
Stop-loss and take-profit levels are dynamically calculated per trade.
Only one position can be open at any given time.
What You See on the Chart
Weighted Moving Average (WMA) trend line.
Fast EMA and Slow EMA lines.
Dynamic stop-loss line during active trades.
Dynamic take-profit line during active trades.
Recommended Use
Intraday scalping on VİOP instruments.
Momentum-based short-term trading.
Traders who prefer rule-based systems with strict risk control.
Always backtest and forward-test on your own instruments and timeframes before using this strategy in live markets.
策略
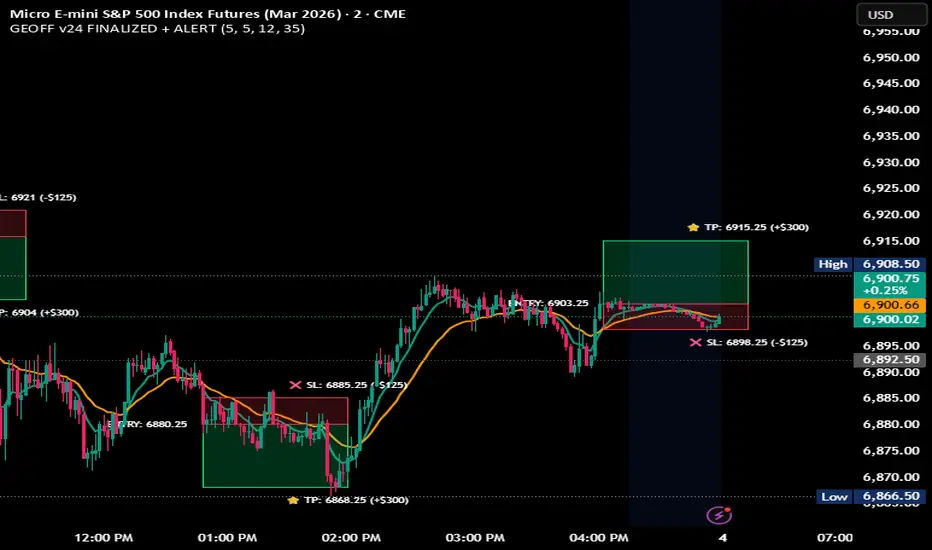
GEOFF LONG/SHORT ENTRY + STOP + TP / FINALIZED + ALERT / EMA
This professional-grade scalper is engineered specifically for the Micro E-mini S&P 500 (MES) and focuses exclusively on high-probability "A+" setups. By stripping away secondary noise, the indicator identifies surgical entries where momentum, trend, and institutional value converge.
### THE "PERFECT SETUP" LOGIC (4-LAYER FILTER)
To ensure the highest strike rate, a trade is only triggered when all four of the following conditions align:
1. TREND: 8 EMA crossing the 21 EMA (Short-term momentum shift).
2. VALUE: Price must be above VWAP for Longs or below VWAP for Shorts (Institutional bias).
3. MOMENTUM: RSI must be > 55 for Longs or < 45 for Shorts (Confirming the "Flush").
4. VOLATILITY: The entry candle must close outside the EMA spread to confirm strength.
### KEY FEATURES
* IRON-CLAD ANCHORING: Uses Pine Script v6 'chart.point' math to mathematically weld boxes and labels to the price bars. Drawings will NOT drift or lag when zooming or panning.
* DYNAMIC RISK CALCULATOR: Automatically calculates Take Profit and Stop Loss levels based on your input points. It displays the real-time dollar gain/loss ($5 per point for MES) directly on the chart.
* SURGICAL VISUALS: Features a 3-label system (Entry Price, Target Price, and Stop Price) positioned externally to keep the candlestick price action clear and visible.
* COLOR-SYNC LOGIC: Intuitively designed so that the Profit Target is ALWAYS Lime/Green and the Risk/Stop is ALWAYS Red, regardless of whether you are in a Long or Short position.
* INTEGRATED ALERTS: Includes built-in alert conditions for "Perfect Long" and "Perfect Short" to sync with phone or browser notifications.
### BEST USED ON:
Optimized for the 1m, 2m, and 5m timeframes for MES Futures.
指标
W/D/4HR OTE Aligner (V6) - Alerts This indicator is a multi-timeframe (MTF) alignment and Optimal Trade Entry (OTE) alert tool designed for discretionary manual trading on the 15-minute timeframe.
Here is a description of its core functionality:
W/D/4HR OTE Aligner (V6) - Alerts
This custom TradingView indicator assists manual traders by identifying high-probability trading setups that meet specific structural and momentum criteria across multiple timeframes. It does not place trades automatically but generates a "Trade Signal" used for setting up reliable alerts.
Key Features:
Multi-Timeframe Bias Confirmation: The indicator uses a 50-period Exponential Moving Average (EMA) to confirm that the Weekly, Daily, and 4-Hour timeframes are all aligned in the same direction (all above for bullish, all below for bearish). This provides a strong directional bias.
OTE Zone Identification: It dynamically calculates recent swing highs and lows on the 4-hour chart (using reliable pivot detection) and highlights the Optimal Trade Entry (OTE) zone, typically centered around the 0.618 Fibonacci Retracement level.
15-Minute Entry Signal: Once price enters the OTE zone within the aligned trend direction, the indicator looks for a confirmation entry signal on the 15-minute chart, specifically a 9-period EMA crossing the 20-period EMA.
Manual Alert System: A transparent "Trade Signal" plot provides the trigger source for a manual TradingView alert, notifying the user exactly when all criteria are met for a potential long or short trade entry.
This indicator is a tool for finding precise entry points within dominant, confirmed trends.
for clarity i built this using Google AI to help with being away from the charts it reflects how i wish to progress on my journey so any tips or feed back with me much appreciated
指标

Kalman Exponential SuperTrendThe Kalman Exponential SuperTrend is a new, smoother & superior version of the famous "SuperTrend". Using Kalman smoothing, a concept from the EMA (Exponential Moving Average), this script leverages the best out of each and combines it into a single indicator.
How does it work?
First, we need to calculate the Kalman smoothed source. This is a kind of complex calculation, so you need to study it if you want to know how it works precisely. It smooths the source of the SuperTrend, which helps us smooth the SuperTrend.
Then, we calculate "a" where:
n = user defined ATR length
a = 2/(n+1)
Now we calculate the ATR over "n" period. Classical calculation, nothing changed here.
Now we calculate the SuperTrend using the Kalman smoothed source & ATR where:
kalman = kalman smoothed source
ATR = Average True Range
m = Factor chosen by user.
Upper Band = kalman + ATR * m
Lower Band = kalman - ATR * m
Now we just smooth it a bit further using the "a" and a concept from the EMA.
u1 = Upper Band a bar ago
l1 = Lower Band a bar ago
u = Upper Band
l = Lower Band
Upper = u1 * (1-a) + u * a
Lower = l1 * (1-a) + u * a
When the classical (not Kalman) source crosses above the Upper, it indicates an uptrend. When it crosses below the Lower, it indicates a downtrend.
Methodology & Concepts
When I took a look at the classical SuperTrend => It was just far too slow, and if I made it faster it was noisy as hell. So I decided I would try to make up for it.
I tried the gaussian, bilateral filter, but then I tried kalman and that worked the best, so I added it. Now it was still too noisy and unconsistent, so I revisited my knowledge of concepts and picked the one from the EMA, and it kinda solved it.
In the core of the indicator, all it does is combine them in a really simple way, but if you go more deeply you see how it fits the puzzlé really well.
It is not about trying out random things´=> but about seeking what it is missing and trying to lessen its bad side.
That is the entire point of this indicator => Offer a unique approach to the SuperTrend type, that lessen the bad sides of it.
I also added different plotting types, this is so everyone can find their favorite
Enjoy Gs!
Thanks @BackQuant for making a open source Kalman code <3
指标

JRockets MACDThis is my favorite indicator, that I use as one of my conformations before entering a trade in the 15M timeframe This MACD is tailor made by me to work efficient, consistent, and effectively. I back tested tons of times, it helps if you're entering too early, late and even get faked out. The MACD is by far my favorite and one and only indicator, and here's why. The MACD contains 2 EMA lines where it gives me a signal on when to buy or sell. If the Blue line crosses the red line on the bottom of the indicator its giving buy signals as long as the blue line stays on top, and when the red line crosses the blue line on top of the indicator its giving sell signals as long as the redline stay on top. Be sure to pay attention to the candle stick patterns as well and has to be around key levels. What makes this a better signal as well, the MACD has a built-in momentum hologram, some see it as overbought/undersold, or volume indicator. By combining the momentum hologram with your buy/sell ema will prevent you from entering a trade in the wrong area. The momentum hologram is almost self-explanatory, when there is buying pressure, the hologram turns blue, the darker the blue the stronger the momentum as well as the length of the hologram, once is start losing momentum it starts to turn to a lighter blue. Eventually a light red to a solid red showing momentum for a strong sell, this works vice versa. Combing all that at once and built instincts it becomes very effective. You can also use the EMA signals as divergence, but I don't really trade with divergence but could possibly give you conformation. Using the MACD is like having 3-4 indicators in one with all of them working fluent together. I have the MACD locked on the 15M timeframe because that's where it works more accurately. You can make the EMA lines a bit thicker to be easier to see. I would change the MACD visible for the 15M timeframe only or 1M to 1H timeframe. I hope this indicator helps you, as it did for me. You can simply click add on your charts on the top left to get this free indicator. Peace out and enjoy! Be sure to share, this indicator with your friends as it may help someone out.
指标

Evil's Two Legged IndicatorA pullback strategy indicator designed for scalping. This attempts to Identify classic 2-leg pullback patterns and filters out signals during choppy market conditions for better signals.
How It Works:
The indicator detects when price forms two pullback legs (swing lows in an uptrend or swing highs in a downtrend) near key support/resistance zones, then signals when reversal confirmation occurs. Equal-level pullbacks (double bottoms/tops) are marked as stronger signals.
Features:
Channel Options: Donchian (default), Linear Regression, or ATR Bands
Configurable EMA: For trend confirmation (default 21)
Adjustable Leg Detection: Swing lookback period for different timeframes
Equal Level Detection: Highlights stronger setups where both legs terminate at similar prices
Three Chop Filters (can be combined):
ADX Filter — suppresses signals when ADX is below threshold (default 25)
EMA Slope Filter — suppresses signals when EMA is flat
Chop Index Filter — suppresses signals when Chop Index indicates ranging conditions
Signal Types:
Standard signals: 2-leg pullback detected with trend confirmation
Strong signals (highlighted): 2-leg pullback with equal highs/lows — higher probability setup
Recommended Use:
Best suited for scalping on 1-5 minute chart. Designed for 1.5:1 risk/reward setups.
Settings Guide:
Increase "Swing Lookback" for fewer, higher-quality signals
Adjust "Equal Level Threshold" to fine-tune what counts as a double bottom/top
Enable/disable chop filters based on your market and timeframe
Use "Show Strong Signals Only" to filter for highest conviction setups
指标
