指标

指标

指标

指标

指标

Divergence for Many Indicators v4Hello Traders,
Here is my new year gift for the community, Digergence for Many Indicators v4 . I tried to make it modular and readable as much as I can. Thanks to Pine Team for improving Pine Platform all the time!
How it works?
- On each candle it checks divergences between current and any of last 16 Pivot Points for the indicators.
- it search divergence on choisen indicators => RSI , MACD , MACD Histogram, Stochastic , CCI , Momentum, OBV, VWMACD, CMF and any External Indicator !
- it checks following divergences for 16 pivot points that is in last 100 bars for each Indicator.
--> Regular Positive Digergences
--> Regular Negative Digergences
--> Hidden Positive Digergences
--> Hidden Negative Digergences
- for positive divergences first it checks if closing price is higher than last closing price and indicator value is higher than perious value, then start searching divergence
- for negative divergences first it checks if closing price is lower than last closing price and indicator value is lower than perious value, then start searching divergence
Some Options:
Pivot Period: you set Pivot Period as you wish. you can see Pivot Points using "Show Pivot Points" option
Source for Pivot Points: you can use Close or High/Low as source
Divergence Type: you can choose Divergence type to be shown => "Regular", "Hidden", "Regular/Hidden"
Show Indicator Names: you have different options to show indicator names => "Full", "First Letter", "Don't Show"
Show Divergence Number: option to see number of indicators which has Divergence
Show Only Last Divergence : if you enable this option then it shows only last Positive and Negative Divergences
you can include any External Indicator to see if there is divergence
- enable "Check External Indicator"
- and then choose External indicator name in the list, "External Indicator"
- External indicator name is shown as Extrn
- related external indicator must be added before enabling this option
Coloring, line width and line style options for different type of divergences.
Following Alerts added:
- Positive Regular Divergence Detected
- Negative Regular Divergence Detected
- Positive Hidden Divergence Detected
- Negative Hidden Divergence Detected
Now lets see some examples:
Hidden Divergences:
Regular and Hidden Divergences together:
Showing first letters of indicators:
You can see only the number of indicators which has divergence:
You can see only divergence lines without indicators names and numbers:
option to used different label/line/text colors:
You have option to see only last divergences:
You can change Pivot Period, in following example Pivot Period = 15:
You can use Close or High/Low as Source for Divergence
You can include external indicators and get divergences on it:
Wish you all a happy new year!
Enjoy! 指标

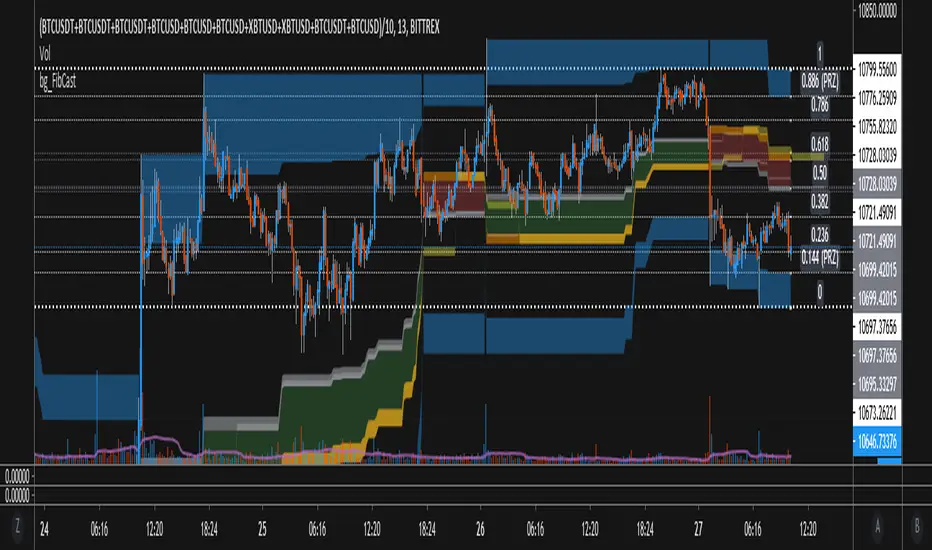
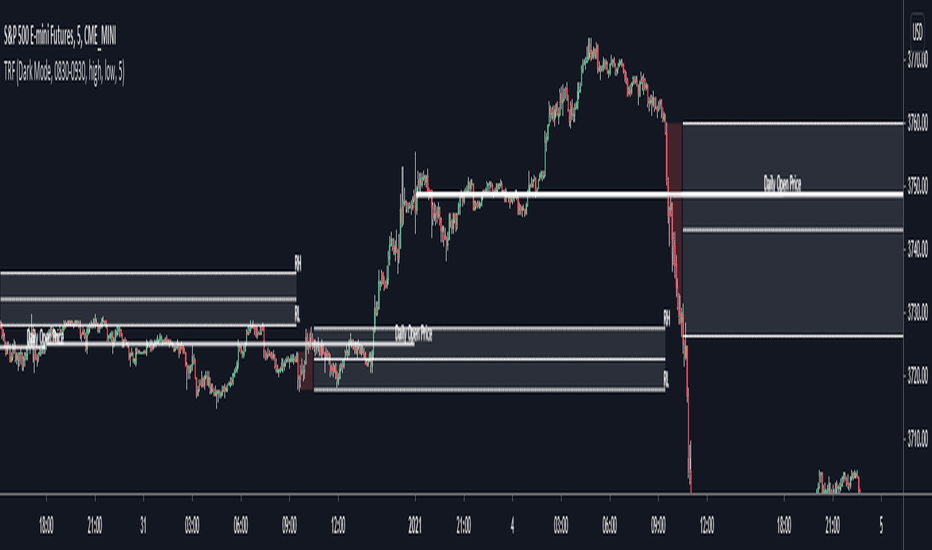
User-Inputed Time Range & FibsGreetings Traders! I have decided to release a few scripts as open-source as I'm sure others can benefit from them and perhaps make them better.(Be sure to check my Profile for the other scripts as well: www.tradingview.com).
This one is called User-Inputed Time Range & Fibs.
The idea behind this script is to record the Range Highs and Lows of a User Defined Period, and plot potential Targets based on either Fibonacci Extensions or a Multiple of the Range Size. I created this originally for use with the US Session Initial Balance(From 9:30-10:30AM EST), however it can be set to any time period.
What is Initial Balance? In simple words, Initial Balance (IB) is the price data, which are formed during the first hour of a trading session. Activity of traders forms the so-called Initial Balance at this time. This concept was introduced for the first time by Peter Steidlmayer when he presented the market profile to traders(atas.net).
The IB is monitored as a break-out area for Range Extension traders. The IB High is also seen as an area of resistance and the IB Low as an area of support until it is broken(www.mypivots.com).
As a note, depending on the Time Zone you are in, you may need to manually add or subtract from the Timed Range to match the desired Time. For example in NY Eastern Time, I have to use 8:30-9:30AM to Capture the 9:30-10-30AM IB for ES and NQ. Similarly, I must use 14:30-15:30PM to Capture the 9:30-10-30AM IB for BTC. You will need to make adjustments based on the Time Zone you are located in.
I wanted to give a Special Thanks to @PineCoders for the Custom Rounding Function from Backtesting/Trading Engine--> (), Pinecoders.com for help with Tracking the Highs/Lows--> (www.pinecoders.com), and @TradeChartist for allowing me to use some of the code for the Fibonacci Extensions from his script here--> ().
If you like User-Inputed Time Range & Fibs, be sure to Like, Follow, and if you have any questions, don't be afraid to drop a comment below. 指标
指标

指标

指标

指标
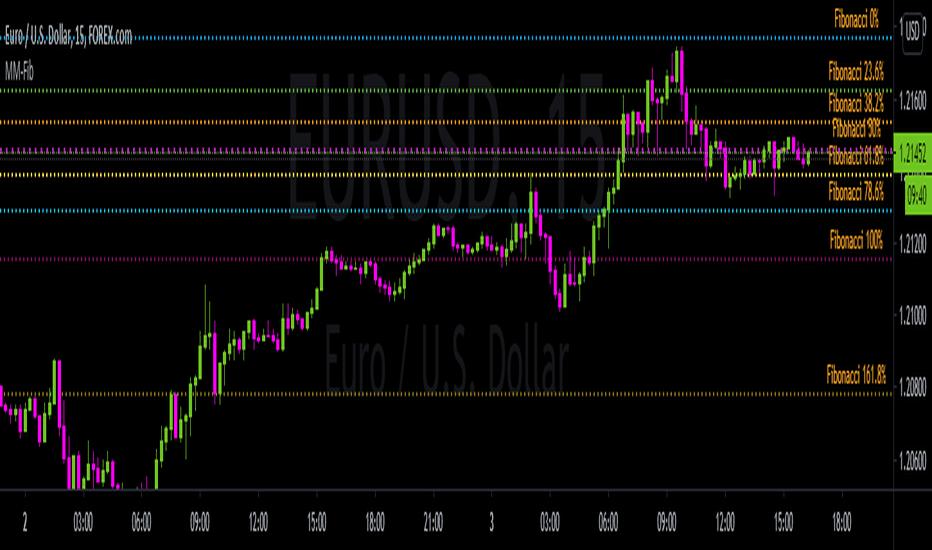
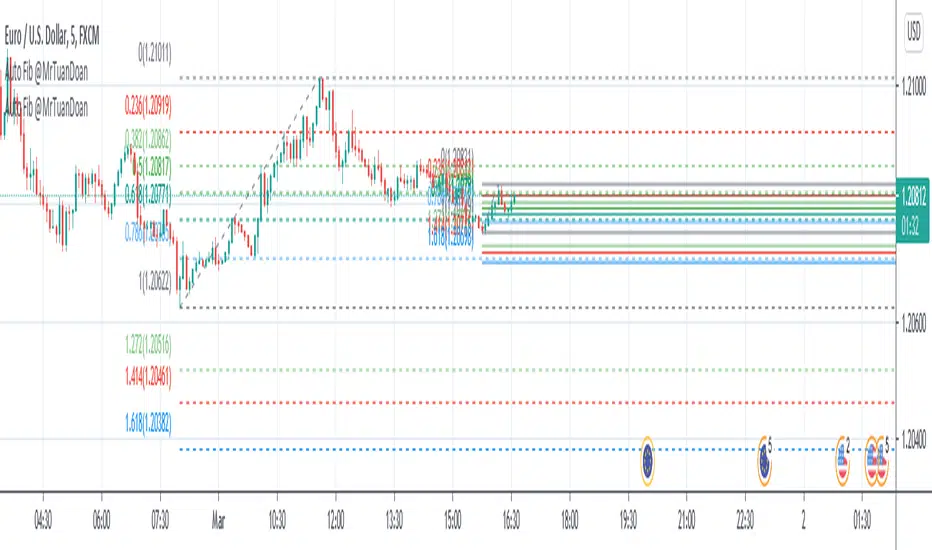
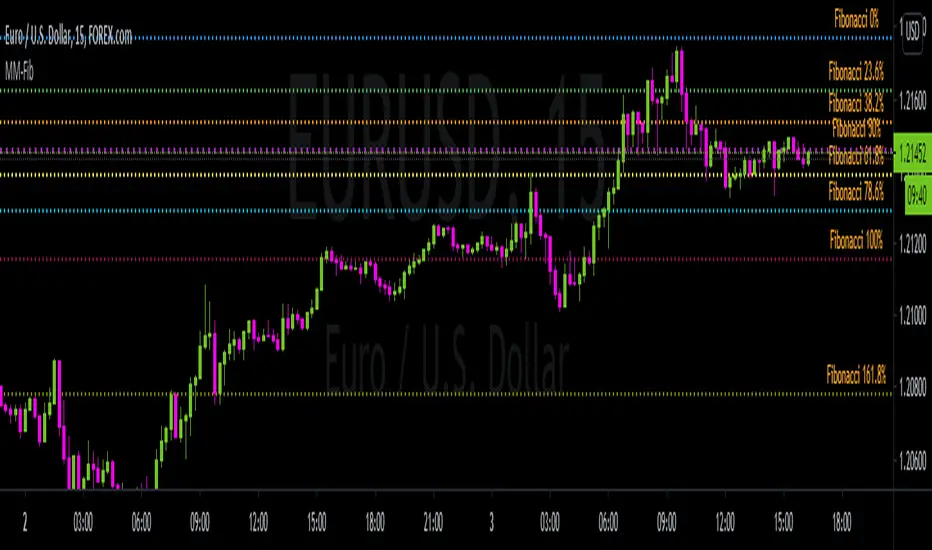
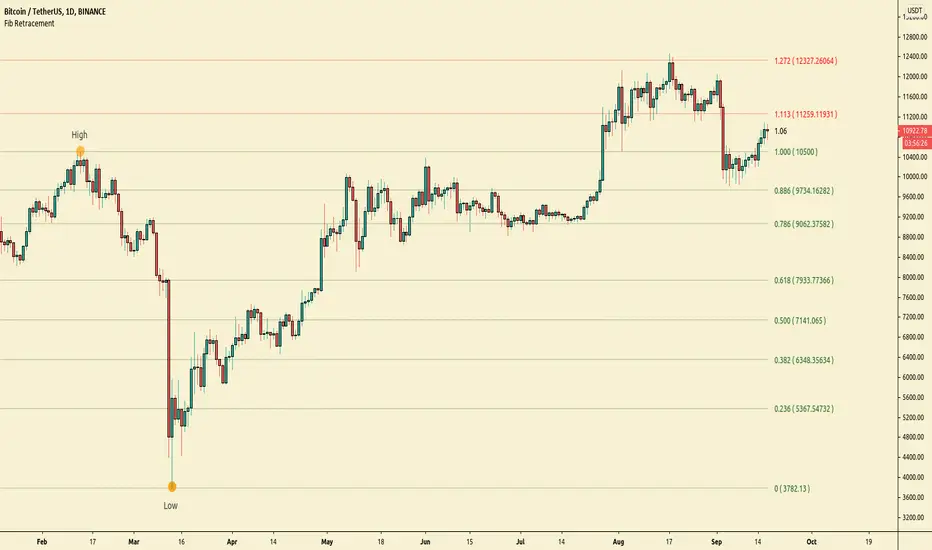
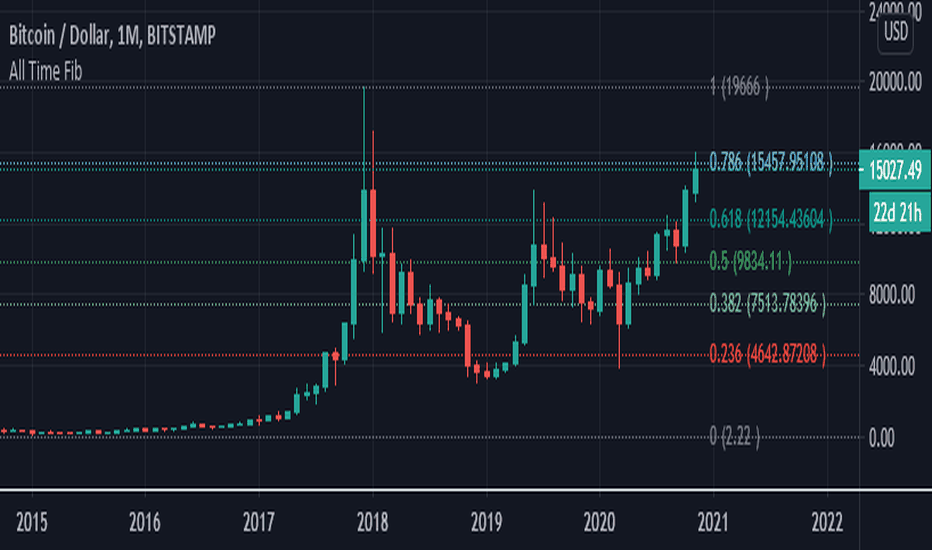
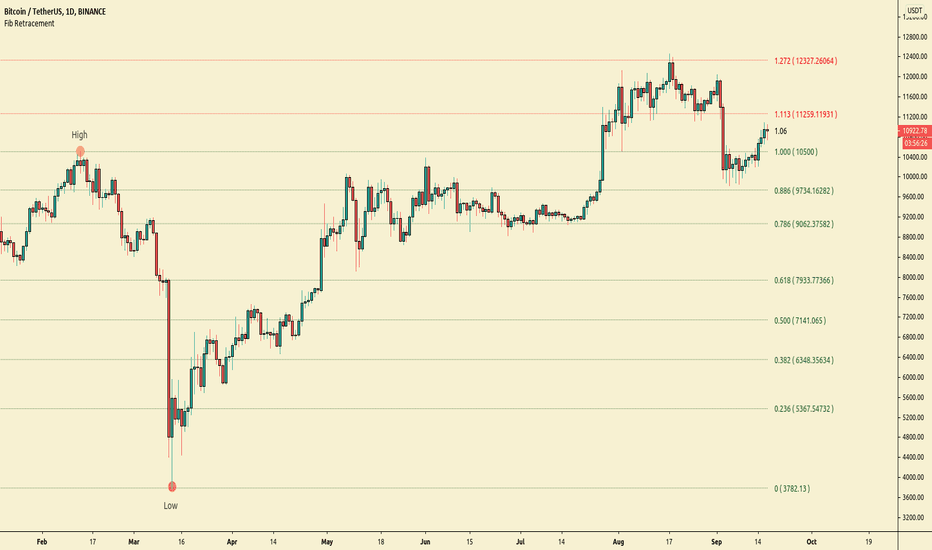
Automatic FibonacciFibonacci retracements are popular among technical traders. In technical analysis, a Fibonacci retracement is created by taking two extreme points (usually a peak and a trough) on a stock chart and dividing the vertical distance by the key Fibonacci ratios of 23.6%, 38.2%, 50%, 61.8%, and 100%. Basic fibo levels are often known to be 14.6%, 23.6%, 38.2%, 50%, 61.8%, 76.4%, 88.6% and 100%.
This indicator will draw the fibonacci levels automatically. Once these levels are identified, horizontal lines are drawn and used to identify possible support and resistance levels including zones. The fibo levels on this indicator gives you the option to use basic fibo or new paradigm fibo levels. New paradigm fibo levels may be new to most traders, however, the application of new paradigm fibo does allow one to trade with least risk due to the precision of the price action surrounding the fibo levels and zones.
One of the most efficient and great ways to apply this auto fibo indicator and the new paradigm fibo is by only leaving the fibo levels that do have hits and un-selecting the fibo levels that do not have any. You can further remove any other levels so you can trade the zones that these fibo levels create.
In addition, you can also switch the timeframe of the fibo from 1D to different number of days to 1W. 指标

Fibonacci-Trading-Indikator_3Daily (weekly, monthly) profits with the Fibonacci trading indicator_3
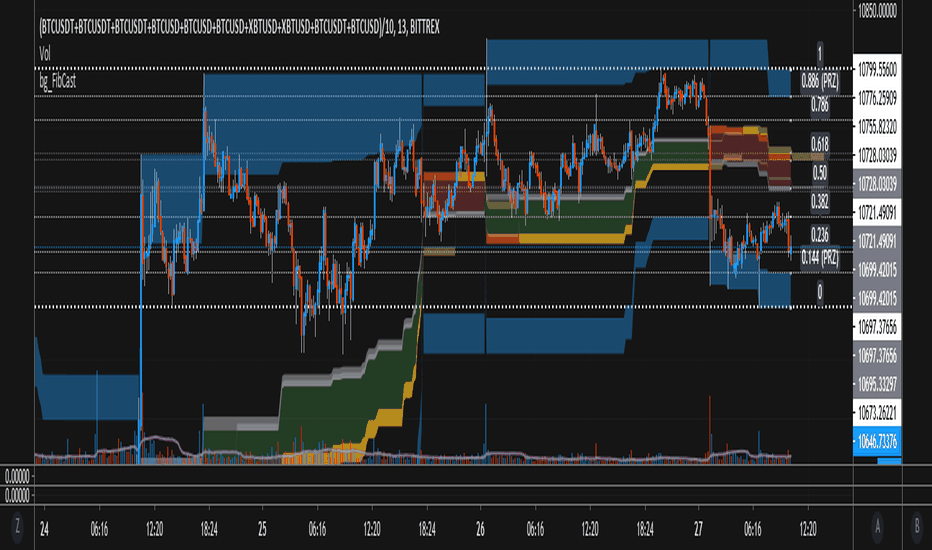
Quotes move in Fibonacci ratios in liquid markets. With this indicator you receive information for daily trades or for position trades based on a week or on a monthly basis, in which area you should ideally enter the market and where the minimum achievable price target is. This price target is 61.8% of yesterday's trading range, or the trading range of the previous week, or the trading range of the previous month, depending on the time frame for which the indicator should calculate the minimum achievable high / low. This is also where you realize your profit.
For this calculation, the following entries must be made in the properties window of the indicator:
• Preselection uptrend / downtrend.
• Time frame (day, week, ...) of the price bar for the possible high / low to be determined.
• Trading range of the previous day, or the previous week, or the previous month.
• Current lowest low of the selected time frame when trading has started and prices are rising.
• Current highest high of the selected time frame when trading has started and prices are falling.
Important areas for trading are:
• The entry range 0% - 23.6% for long or short.
• The target price level 61.8%.
Choose a suitable time frame to detect the direction of movement while the quotes are still moving in the entry area. The camelback indicator can be of great help. Also test the resolution setting of the camelback indicator. With a resolution of 1 hour in the 6 or 12 minute chart, you get a perspective for the broader direction. Movement patterns of corrections or consolidations, if they last more than a day or a week, also give clues to the coming direction of movement for the trade. So look back to see what happened yesterday, a week ago, or a month ago. Pay attention to the market anatomy, find out how the market works, count the price bars in consolidations and trends.
After entering the values the indicator will show the Fibonacci expansion price levels for the possible high or low for the selected time frame. Buy / sell within the entry range between 0% and 23.6% as the market moves towards the last long / or short entry point. This is the course range up to the 23.6% course level. The 61.8% price level is the minimum expected price target. We assume that the current bar will reach at least 61.8% of the trading range of the previous day, week or month. Depending on the set time frame. You should therefore realize the profits you have made with 50% of the position when the prices have reached the 61.8% level. With a suitable trailing stop you can be stopped with the rest of the position, but do not risk more than 50% of the profits.
With the quarter or year preselection and the corresponding entries, the minimum expected quarterly high / quarterly low or annual high / annual low can be determined.
The Fibonacci price levels can be shown and hidden. In the chart click on the gear wheel for “Chart Settings”. In the “Scaling” menu, the price levels can be displayed with the preselection “Label for indicator names” and “Label for last indicator value”. Slide the chart to the right to find possible support and resistance at the price levels that could provide confirmation of the target.
In the event of input errors or missing entries for a time frame, the indicator is hidden.
Pay attention to your trade management to avoid losses.
The new Fibonacci Trading Indicator_3 has the following additions and changes:
Area code for the quarter time frame has been added.
The entry area received a 23.6% and a 50% subdivision. Two envelope lines above the 23.6% entry level in the case of an upward trend and below the 23.6% entry level in the case of a downtrend, with a width of 23.6% and 14.6% of the entry level, are intended to indicate that the closing price is higher the quotations have broken out of the entry-level area.
A volatility stop for upward and downward trends can be activated.
A factor is added to the fluctuation range of each price bar for the stop. Then a moving average is calculated with an adjustable period. The period setting should be set between 5 and 10. The result can be smoothed adjustable.
Presetting:
Periods = 10
Factor = 1.4
Smoothing = 7
With the assumption that the market entry in an upward trend occurs when the prices break out above a bar high, the result of the stop calculation is subtracted from the bar high. In the case of a downward trend, the result of the stop calculation is added to the price bar low.
When entering the market, set the factor to 2.4. If inside bars follow a trend movement, the stop should be brought closer. Try the factor setting 0.4 or less. The smallest adjustable factor is 0.1.
For the entry into an established trend, as described in an idea contribution by me, there are two switchable moving averages. The application for the (MA_H) takes place on high and for the (MA_L) adjustable on high, low, shot, h + 1/2 etc. Period and offset (shift) are adjustable. With this idea, the entry into the market occurs between a 618% correction (the Fibonacci entry point) and the DEP (average entry point). The DEP in this case is the MA_H with period = 4 and an offset = 1 in the case of a downward trend, or the MA_L with the same setting and application to lows in an upward trend.
Also test the MA_L in trends with the settings (period, offset) 3.3 or 5, 3 or 7.5 and applying it to closing prices for a close encompassing of the highs / lows.
Tägliche (wöchentliche, monatliche) Gewinne mit dem Fibonacci-Trading Indikator_3
Kursnotierungen bewegen sich in liquiden Märkten in Fibonacci-Verhältnisse. Mit diesem Indikator erhalten Sie für Tagesgeschäfte, oder für Positionstrades auf Basis einer Woche, oder auf Basis eines Monats Informationen, in welchem Bereich Sie idealerweise in den Markt einsteigen sollten und wo das mindeste erreichbare Kursziel liegt. Dieses Kursziel liegt bei 61,8% der gestrigen Handelspanne, oder der Handelspanne der Vorwoche, oder der Handelspanne des Vormonats, also abhängig davon für welchen Zeitrahmen der Indikator das mindeste erreichbare Hoch/Tief berechnen soll. Dort realisieren Sie auch Ihren Gewinn.
Für diese Berechnung sind folgende Eingaben im Eigenschaftenfenster des Indikators einzustellen:
• Vorwahl Aufwärtstrend/ Abwärtstrend.
• Zeitrahmen (Tag, Woche, …) des Kursbalkens für das zu ermittelnde mögliche Hoch/ Tief.
• Handelspanne des vorherigen Tages, oder der vorherigen Woche, oder des vorherigen Monats.
• Aktuell tiefstes Tief des vorgewählten Zeitrahmens, wenn der Handel begonnen hat und die Notierungen steigen.
• Aktuell höchstes Hoch des vorgewählten Zeitrahmens, wenn der Handel begonnen hat und die Notierungen fallen.
Wichtige Bereiche für das Trading sind:
• Der Einstiegsbereich 0% - 23,6% für long oder short.
• Der Kursziellevel 61,8%.
Wählen Sie für die Erkennung der Bewegungsrichtung einen geeigneten Zeitrahmen, während sich die Notierungen noch im Einstiegsbereich bewegen. Der Camelback-Indikator kann eine gute Hilfe sein. Testen Sie auch die Auflösung-Einstellung des Camelback-Indikators. Mit der Auflösung 1 Stunde Im 6- oder 12 Minuten-Chart erhalten Sie einen Blickwinkel für die große Richtung. Auch Bewegungsmuster von Korrekturen oder Konsolidierungen, wenn sie mehr als einen Tag oder eine Woche andauern geben Hinweise auf die kommende Bewegungsrichtung für den Trade. Schauen Sie also zurück um zu prüfen, was sich gestern, vor einer Woche oder vor einem Monat abgespielt hat. Achten sie auf die Marktanatomie, finden Sie heraus wie der Markt funktioniert, zählen Sie Kursstäbe in Konsolidierungen und Trends.
Nach Eingabe der Werte zeigt der Indikator die Fibonacci-Ausweitungskurslevels für das mögliche Hoch oder Tief für den ausgewählten Zeitrahmen. Kaufen/ verkaufen Sie innerhalb des Einstiegsbereichs zwischen 0% und 23,6%, während sich der Markt in Richtung des letzten long-/ oder short-Einstiegspunktes bewegt. Das ist der Kursbereich bis zum 23,6%- Kurslevel. Der 61,8%-Kurslevel ist das mindeste erwartbare Kursziel. Wir gehen davon aus, dass der aktuelle Kursbalken mindestens 61,8% der Handelsspanne des vorherigen Tages, der vorherigen Woche oder des vorherigen Monats erreichen wird. Abhängig vom eingestellten Zeitrahmen. Realisieren Sie deshalb die angelaufenen Gewinne mit 50% der Position, wenn die Notierungen den 61,8% - Level erreicht haben. Mit einem geeigneten Trailing-Stopp lassen Sie sich mit der restlichen Position ausstoppen, riskieren Sie dafür aber nicht mehr als 50 % der angelaufenen Gewinne.
Mit der Vorwahl Quartal oder Jahr und den entsprechenden Eingaben kann auch das mindeste erwartbare Quartalshoch/ Quartalstief bzw. Jahreshoch/ Jahrestief ermittelt werden.
Die Fibonacci-Kurslevels lassen sich ein- und ausblenden. Klicken Sie im Chart auf das Zahnrad für „Chart Einstellungen“. Im Menü „Skalierungen“ kann mit der Vorwahl „Label für Indikatornahmen“ und „Label für letzten Indikatorwert“ die Kurslevels angezeigt werden. Schieben Sie den Chart nach rechts um mögliche Unterstützungen und Widerstände an den Kurslevels zu finden, die Bestätigung für das Ziel geben könnten.
Bei Eingabefehlern oder fehlenden Eingaben zu einem Zeitrahmen wird der Indikator ausgeblendet.
Achten Sie zur Vermeidung von Verlusten auf ihr Handelsmanagement.
Der neue Fibonacci-Trading-Indikator_3 besitz folgende Zusätze und Änderungen:
Vorwahl für den Zeitrahmen Quartal wurde hinzugefügt.
Der Einstiegsbereich erhielt eine 23,6% und eine 50% Unterteilung. Zwei Umschlagslinien über dem 23,6%-Einstiegslevel bei einem Aufwärtstrend, bzw. unter dem 23,6%-Einstiegslevel bei einem Abwärtstrend, mit der Breite 23,6% und 14,6% vom Einstiegsbereich, sollen bei höherem Schlusskurs signalisieren, dass die Notierungen aus dem Einstiegsbereich ausgebrochen sind.
Ein Volatilitätsstopp jeweils für Aufwärts- und Abwärtstrend kann zugeschaltet werden.
Für den Stopp wird die Schwankungsbreite jedes Kursbalkens wird mit einem Faktor beaufschlagt. Danach erfolgt die Berechnung eines gleitenden Durchschnitts mit einstellbarer Periode. Die Periodeneinstellung sollte zwischen 5 und 10 eingestellt werden. Das Ergebnis kann einstellbar geglättet werden.
Voreinstellung:
Perioden = 10
Faktor = 1,4
Glättung = 7
Mit der Annahme, dass der Markteinstieg in einem Aufwärtstrend bei Ausbruch der Notierungen über ein Kursbalkenhoch erfolgt, wird das Ergebnis der Stoppberechnung vom Kursbalkenhoch subtrahiert. Bei einem Abwärtstrend wird das Ergebnis der Stoppberechnung zum Kursbalkentief addiert.
Stellen Sie bei Markteintritt den Faktor auf 2,4. Folgen nach einer Trendbewegung Innenstäbe sollte der Stopp näher herangeführt werden. Probieren Sie die Faktoreinstellung 0,4 oder kleiner. Der kleinste einstellbare Faktor ist 0,1.
Für den Einstieg in einen etablierten Trend, wie in einem Ideenbeitrag von mir beschrieben, gibt es zwei zuschaltbare gleitende Durchschnitte. Die Anwendung für den (MA_H) erfolgt auf Hochs und für den (MA_L) einstellbar auf Hoch, Tief, Schuss, h+l/2 usw.. Periode und Offset (Verschiebung) sind einstellbar. Bei dieser Idee erfolgt der Einstieg in den Markt zwischen einer 618%-Korrektur (dem Fibonacci-Einstiegspunkt) und dem DEP (Durchschnittlicher Einstiegspunkt). Der DEP ist in diesem Fall der MA_H mit Periode = 4 und einem Offset = 1, bei einem Abwärtstrend, oder der MA_L mit identischer Einstellung und Anwendung auf Tiefs in einem Aufwärtstrend.
Testen Sie den MA_L auch in Trends mit den Einstellungen (Periode, Offset) 3,3 oder 5, 3 oder 7,5 und Anwendung auf Schlusskurse für eine enge Umfassung der Hochs/ Tiefs.
指标

指标

指标

指标
指标
指标

指标

Trend Following with Moving AveragesHello Traders,
With the info "Trend is Your Friend ", you should not take position against the trend. This script checks multipte moving averages if they are above/below the closing price and try to find trend. The moving averages with the length 8, 13, 21, 34, 55, 89, 144, 233, 377 used. these are fibonacci numbers, but optionally you can change the lengths of each moving averages. while it's green you better take long positions, while it's red you better take short positions according to other indcators or tools.
Optionally you have "smoothing" option to get rid of whipsaws. it's enabled by default.
You have option to use following moving average types: EMA, SMA, RMA, WMA, VWMA. by default it's EMA
Also the script has "Resolution" option. with this option you can get the trend for other time frames, in following example 1h was set as for higher time frame on 15m chart:
This should not be used as buy/sell signal indicators as it's tries to find trend but not entry points, you should use other indicators (such RSI, Momentum) or other tools to find buy/sell signals.
Enjoy! 指标

指标

指标
指标