Swing Fibonacci Arcs & Volume Profile [BigBeluga]🔵 OVERVIEW
The Swing Fibonacci Arcs & Volume Profile is an advanced technical analysis indicator designed by BigBeluga to combine geometric Fibonacci arc projections with automated swing-anchored volume profile histograms directly on the chart. Traditional Fibonacci tools rely strictly on linear retracements or horizontal grids, often failing to account for circular expansion paths and volume distribution across structural market swings. To solve this limitation, this script automatically detects significant market swings, projects customizable elliptical Fibonacci arcs with band fills, and computes a detailed volume profile histogram complete with a Point of Control (POC) line.
The indicator visualizes confirmed swing lines, curved arc bands, volume profile distribution boxes, and custom percentage labels. The core calculations track rolling highs and lows, compute elliptical scaling parameters using adjustable horizontal and vertical multipliers, and aggregate volume bins across the active swing structure. Customizable color palettes, arc resolutions, and level toggles allow traders to fine-tune the system across various timeframes and asset classes.
🔵 HOW IT WORKS
The system operates through an integrated architecture where each component dynamically influences chart behavior:
1 — Swing Structure Engine
Swing Detection & Tracking: Scans rolling highest and lowest points using the Swing Structure input. To adapt this feature, set the length shorter (e.g., 30 to 50 ) to capture fast, short-term structural swings for day trading, or longer (e.g., 70 to 150+ ) for swing trading to focus on major macro market turning points.
Visual Line Mapping: Plots confirmed bullish and bearish swing lines using custom user-defined colors alongside real-time unconfirmed dashed projections.
2 — Fibonacci Arcs & Geometric Engine
Arc Expansion & Scaling: Projects elliptical arc bands from swing origins based on standard ratios (0.0%, 23.6%, 38.2%, 50.0%, 61.8%, 78.6%, 100.0%). Horizontal and vertical scaling factors ( Horizontal Scale (X) and Vertical Scale (Y) ) can be adjusted between 0.1 and 10.0 to modify the curvature and width of the arcs.
Resolution & Styling Controls: Adjusts arc smoothness via the Arc Resolution (Segments) input (set between 10 and 100 ) and controls border thicknesses, transparency levels, and individual band fill options.
3 — Volume Profile & POC Engine
Profile Generation: Constructs an automated volume profile histogram anchored to the active swing start point, scaled via the Profile Max Width (Bars) input.
Point of Control (POC): Identifies the highest volume bin within the swing range, rendering a distinct POC line and price label with customizable gradient coloring.
🔵 HOW TO USE
Apart from serving as a comprehensive geometric and order flow mapping tool, the indicator can be applied in several ways:
Identify Curved Support & Resistance Arcs: Monitor the intersection of price action with elliptical Fibonacci arcs (such as the 50.0% and 61.8% levels) to anticipate dynamic reversal zones during market pullbacks.
Analyze Volume Distribution Nodes: Inspect the volume profile histogram extending from the swing origin to spot heavy volume accumulation clusters.
Trade POC Rejections: Use the highlighted Point of Control (POC) line and volume tag as a primary reference level for potential breakouts or retests.
🔵 NOTES
Why this implementation is unique:
It merges advanced elliptical Fibonacci arc geometry with swing-anchored volume profile distributions.
Features dynamic polyline rendering, customizable gradient color fills, and robust array management optimized for Pine Script version 6.
Provides extensive modular toggles for individual arc ratios, line widths, and profile displays.
指标

Supertrend + Fibonacci OTE Grid & Bands [BigBeluga]🔵 OVERVIEW
The Supertrend + Fibonacci OTE Grid & Bands is an advanced technical analysis indicator designed by BigBeluga to combine trend-following Supertrend mechanics with dynamic Fibonacci retracement grids and volatility-based channel bands directly on the chart. Traditional Supertrend systems rely solely on stop lines, often missing optimal retracement zones (OTE) during trend pullbacks. To solve this limitation, this script integrates dual operating modes—anchored OTE grids that project Fibonacci levels across active trend swings, and continuous Fibonacci channel bands scaled by Average True Range (ATR).
The indicator visualizes trend direction, dynamic stop losses, shaded OTE zones, and proximity-highlighted grid levels. The core calculations track trend swings using customizable ATR lookbacks, compute proportional Fibonacci levels (0.0 to 1.0), and dynamically adjust line widths and colors when price approaches specific thresholds. Custom color palettes, bar/candle color toggles, and label configurations allow traders to fine-tune visual settings across various timeframes and asset classes.
🔵 HOW IT WORKS
The system operates through an integrated architecture where each component dynamically influences chart behavior:
1 — Supertrend Trend & Swing Engine
Stop Loss Line & Fills: Computes volatility-scaled Supertrend lines using ATR parameters, plotting colored stop-loss streams with gradient area fills.
Trend Extreme Tracking: Automatically tracks trend highs and lows upon trend direction flips to anchor structural Fibonacci calculations.
2 — Dual Fibonacci Modes (OTE Grid & Bands)
OTE Grid Mode: Projects an anchored Fibonacci retracement grid (0.0, 0.236, 0.382, 0.500, 0.618, 0.705, 0.786, 1.000) across the active trend swing, complete with a shaded Optimal Trade Entry (OTE) zone between the 0.618 and 0.786 levels.
Fibonacci Bands Mode: Plots continuous, ATR-scaled channel bands extending outward from the Supertrend line using proportional ratio offsets.
3 — Proximity Highlight & Styling Engine
Price Proximity Detection: Measures distance between price and individual grid levels using ATR multipliers to dynamically highlight active levels with distinct colors and thicker line widths.
Visual Customization: Supports bar and custom candle coloring by trend, adjustable line styles (Solid, Dotted, Dashed), and dynamic right-edge price labels.
🔵 HOW TO USE
Apart from serving as a comprehensive trend and retracement mapping tool, the indicator can be applied in several ways:
Follow Trend Momentum: Stay aligned with prevailing market direction by monitoring the Supertrend line color and trend-colored candles/bars.
Identify OTE Retracement Zones: In OTE Grid mode, monitor the shaded zone between the 0.618 and 0.786 Fibonacci levels for potential trend continuation entries during pullbacks.
Track Key Level Interactions: Watch for automatic color highlights and width changes on grid levels as price approaches critical Fibonacci thresholds.
🔵 SETTINGS
The indicator includes several customizable configuration groups to tailor calculations and visual styling to your trading style:
General Settings: Select between OTE Grid and Fibonacci Bands modes, toggle right-edge price/ratio labels, choose grid line styles (Solid, Dotted, Dashed), adjust grid highlight distance thresholds via ATR multipliers, and enable dimming for non-OTE levels.
Supertrend Parameters: Configure the ATR Period and Multiplier to adjust the sensitivity and distance of the core stop-loss line.
Fibonacci Bands Parameters: Define the ATR period and outer band multiplier specifically used when operating in Fibonacci Bands mode.
Main Styling & Colors: Set bullish and active price highlight colors, and toggle bar/candle coloring based on the active trend direction.
Fibonacci Level Settings: Enable or disable individual Fibonacci ratios (0.000, 0.236, 0.382, 0.500, 0.618, 0.705, 0.786, 1.000) and customize their individual display colors.
🔵 NOTES
Why this implementation is unique:
It merges classic Supertrend stop mechanics with both anchored OTE grids and continuous Fibonacci channel bands.
Features dynamic price proximity highlighting and custom linefill engines optimized for Pine Script version 6.
Provides extensive modular inputs for styling, level visibility, and operational mode switching.
指标

Fibonacci Confluence Suite [AxeAlgo]Fibonacci Confluence Suite
OVERVIEW
Fibonacci Confluence Suite is an automatic Fibonacci retracement and extension toolkit. Instead of requiring you to manually draw a Fibonacci tool on every swing, it detects swing highs and lows on its own using fractal price structure, draws the retracement/extension grid between them, and keeps that grid updated in real time as new swings form.
On top of the standard retracement levels, this script adds several layers of context that are normally separate, manually-maintained tools: a Golden Pocket highlight, a confluence check against prior swings, a per-level "touch count" strength score, an optional volatility-adaptive lookback, Fibonacci time zones, and a compact on-chart status table. The goal is to let you see not just where a Fibonacci level sits, but how significant that level appears to be.
This is a technical analysis / charting tool. It does not predict price, does not place trades, and is not a signal generator promising entries or exits.
HOW IT WORKS
1. Swing detection: the script scans for fractal highs and lows (a bar whose high/low is more extreme than the two bars on either side of it) within a user-defined lookback Period.
2. Anchors: the most extreme fractal high and fractal low found inside that window become the 0% and 100% anchors.
3. Direction: the detected swing is treated as an up-move or down-move depending on which side price broke out of most recently; you can flip this with the Reverse input if you prefer levels measured from the opposite end.
4. Grid: every retracement/extension ratio you enable is calculated from those two anchors and drawn as a labeled horizontal line, with the current price and touch count shown directly on the label.
5. Confluence: each time the swing flips, the prior swing's high/low is stored. Newly drawn levels are checked against the Fibonacci levels of those earlier swings, and any level that lines up within your tolerance is marked and drawn wider so overlapping structure stands out.
KEY FEATURES
- Automatic fractal-based swing detection, no manual drawing required.
- Base lines (0.000 / 1.000) plus up to nine independently configurable extension ratios, each with its own show/hide toggle and value.
- Adjustable line style, width, color, and extension direction (none / left / right / both) for base and extension lines separately.
- Golden Pocket highlight (0.618-0.65) with adjustable fill color, useful as a classic confluence/reaction zone.
- Multi-swing confluence detection: compares the current Fibonacci grid against up to five prior swings and flags levels that overlap, with an adjustable tolerance (as a percentage of the swing range) and a visual marker on confluent levels.
- Level strength via touch counts: each level tracks how many times price has traded through it since that specific swing grid was drawn, shown directly in the line label.
- Optional volatility-adaptive sensitivity: scales the effective lookback window using current ATR relative to its own baseline, so the swing detection can loosen or tighten automatically across changing volatility regimes instead of relying on one fixed Period. Disabled by default; when disabled the script behaves exactly like a fixed-Period fractal Fibonacci tool.
- Fibonacci time zones: optional vertical lines placed at Fibonacci bar-count offsets from the start of the current swing, for traders who also watch time-based confluence.
- Status table showing current trend direction, swing high/low, nearest level to price, the strongest (most-touched) level, and the lookback period actually in use.
- Built-in alerts: a per-level alert whenever price trades through any visible base or extension line, a dedicated Golden Pocket alert, and grouped "any base line" / "any extension line" alert conditions for the classic Alert dialog.
HOW TO USE IT
- Period / Delay: Period sets how many bars back the script searches for the swing high/low. Delay sets how many bars of confirmation a fractal needs before it can be used; it must be smaller than Period. Larger Delay values produce more reliable fractals at the cost of a slower reaction to new swings.
- Line Extension: controls whether the drawn levels extend left, right, both directions, or not at all.
- Reverse: flips which anchor (swing high or swing low) is treated as the 0% origin, letting you view the same swing from the opposite bias.
- Base Lines / Extension Lines groups: toggle, color, style, and set the ratio of each level independently.
- Golden Pocket: toggle and recolor the 0.618-0.65 zone highlight.
- Level Strength: toggle whether touch counts are appended to each label.
- Multi-Swing Confluence: toggle, choose how many prior swings to compare against, set the matching tolerance, and set how much extra line width and which marker confluent levels get.
- Adaptive Sensitivity: enable to let ATR-based volatility scale the effective lookback automatically; adjust the ATR length and baseline length used for that comparison.
- Time Zones: enable vertical Fibonacci time markers, choose how many zones to draw, and toggle multi-color cycling versus a single accent color.
- Status Table: toggle visibility and choose its screen position.
Set alerts using "Any alert() function call" on this indicator to receive all per-level, Golden Pocket, and roll-up alerts, or use the named alert conditions in the Alert dialog if you only want a subset.
IMPORTANT NOTES AND LIMITATIONS
- Repainting: this script can repaint on the most recent, unconfirmed swing. Because a fractal only confirms after the Delay setting's worth of bars closes, the swing high/low anchors — and therefore every level drawn from them — can still shift on the last few bars until the current fractal fully confirms. Once a swing has confirmed and the trend has flipped, that swing's levels are fixed and will not repaint further. Increasing Delay reduces how often this happens, at the cost of reacting more slowly to fresh swings. Please account for this when reading the most recent levels on the chart, and avoid relying on unconfirmed levels for time-sensitive decisions.
- This tool identifies swing structure and Fibonacci confluence; it does not forecast direction, does not manage risk, and does not constitute a complete trading system on its own. It is intended to be used as one input alongside your own analysis, risk management, and market context.
- Touch counts and the confluence marker describe historical interaction with a level on this chart; they are not a probability estimate and do not guarantee how price will react at that level going forward.
- As with any lookback-based tool, results and appearance will vary by symbol, timeframe, and the Period/Delay settings chosen. Please test on your own instruments and timeframes before relying on it.
DISCLAIMER
This script is provided for educational and informational purposes only and does not constitute financial advice. Trading involves substantial risk of loss and is not suitable for every investor. Past behavior of any indicator, including this one, is not indicative of future results. Always do your own research and consider your own risk tolerance before making any trading decisions. 指标

Anchored VWAP ChannelAnchored VWAP Channel — Regime, Confluence & Reversals
What it is
This is a single overlay that builds a complete read of price around one Anchored VWAP. Instead of just drawing a VWAP line, it wraps the VWAP in a volatility channel and then layers the context a discretionary trader normally checks by eye — where price sits versus fair value, whether the move is trending or stretched, where high-volume and Fibonacci levels line up, and where the edges are getting rejected. Everything is derived from the same anchor and measured in the same volatility unit (one standard deviation, σ), so the pieces describe one structure rather than competing with each other.
It runs on any asset class and any timeframe. On instruments that carry real volume (stocks, futures, crypto, etc.) the VWAP, the channel, and the volume profile are fully volume-weighted; on feeds without real volume it falls back gracefully and flags the change in the table (see "Notes and limitations").
Why these components are combined (and how they work together)
This is intentionally a mashup, and the parts are chosen because they answer different questions about the same reference point:
• The Anchored VWAP is the fair-value anchor — the volume-weighted average price since a chosen pivot.
• The channel turns dispersion around that anchor into a measurable unit: the bands are the AVWAP ± k·σ, where σ is the volume-weighted standard deviation of price about the VWAP. This converts "how far is price from fair value" into a number (σ-distance) every other module can reuse.
• The regime read uses that σ-distance together with the VWAP slope and the band behaviour to label continuation vs reversal — so the same channel that draws the bands also tells you whether to trust a band tag or fade it.
• The volume profile (Point of Control + Value Area) is computed over the same anchored window, so the high-volume price and the value range are measured on exactly the data the VWAP is built from — not an arbitrary separate lookback.
• The Fibonacci grid is drawn on the active swing leg and is only emphasised where a level coincides with the VWAP, a band, or the POC. The channel and profile are what make a fib level meaningful here; on their own the fib levels would be just lines.
• The reversal signals fire on outer-band rejections, and the optional confluence filter suppresses them while the regime is strongly trending (when band tags tend to continue) — i.e. one module gates another.
In short: the channel produces a σ-distance, and the regime, profile, fib confluence, reversal logic, divergence and squeeze modules all consume that single shared measurement. That shared plumbing is the reason these are bundled into one script instead of run as six separate indicators.
What it plots
• Anchored VWAP centerline with a glow halo, colored by slope direction.
• Channel bands at ±1σ and ±2σ. The fill can be a "reversion heat" gradient (denser toward the outer band, red above the VWAP, green below) or a neutral glow, or off.
• Volume profile drawn as a translucent Value Area box (VAL→VAH) with a distinct POC line — kept visually and positionally separate from the fib lines so the two are never confused.
• Fibonacci grid (active-leg retracement, plus optional swing-to-swing), with confluence levels marked by a star and a brighter tone.
• Signals: trend-shift triangles on VWAP reclaim/loss; solid reversal labels on band rejections; diamonds and connecting lines for σ-distance divergence; a marker on volatility-squeeze release.
• Status table (single panel): regime, bias, σ-distance, AVWAP, POC, Value Area, squeeze state, divergence, a reversion stop/target/RR template, a data-health row, multi-timeframe regime agreement, and a built-in legend.
• Optional forward projection cone and an optional self-calibration panel that scores how past signals resolved.
Anchor modes
Rolling (fixed bar window), Swing Low, Swing High, or Dual (auto — anchors to the more recent significant pivot). Pivot detection uses bar-count lookbacks (8/13/21/34/55/89), so the entire tool self-scales to any timeframe.
How to use it
1. Read the table first: regime + σ-distance tell you whether price is trending or stretched, and how far from fair value it is.
2. Use the bands as context — near the centerline is fair value; the ±2σ edge is where reversion risk is highest (and the heat fill shades it).
3. Treat reversal labels as fade-the-stretch signals, strongest when the regime is not trending and when a divergence diamond agrees.
4. Use trend-shift triangles (VWAP reclaim/loss) for continuation context.
5. Use fib-confluence stars and the Value Area box / POC as the levels most likely to react.
6. Check multi-timeframe agreement in the table before acting.
7. Optionally turn on the calibration panel to see, on your own symbol and timeframe, how often each signal type has historically followed through.
What makes it original
• A single shared σ framework: bands, regime, divergence, reversals and risk template all read from one volume-weighted standard-deviation measurement around one anchor, rather than bolting unrelated indicators together.
• Reversion-heat channel fill that encodes reversion risk as color density.
• Confluence-filtered reversals — band rejections gated by regime/divergence.
• Volume profile rendered as a separated zone so it never blends into the fib levels.
• A transparent self-calibration panel that scores the script's own signals against a follow-through threshold (descriptive, not a backtest).
Key settings
• Calculation Source — works on any asset/market; default hlc3, switchable to close, hl2, ohlc4, etc.
• Anchor mode and pivot/rolling length.
• Inner/outer band multipliers and fill style.
• Signal sensitivity, session-open filter, reversal-confirmation strictness.
• Table position / text size / legend, and toggles for every module.
Notes and limitations
• Signals are evaluated on closed bars; the σ-distance divergence confirms a few bars after a pivot by design, so it prints late (this is normal for pivot-based divergence and is not repainting of confirmed history).
• Last-bar drawings (profile, fib, projection cone) are redrawn on each new bar and will shift forward — that is expected.
• Asset classes / volume: runs on any market and any timeframe. On instruments that carry real volume (stocks, futures, crypto, etc.) the Anchored VWAP, the volume-weighted σ channel, and the Volume Profile (POC / Value Area) are all fully volume-weighted as intended. On feeds with no real volume (e.g. spot forex, some indices / CFDs) the script still works but degrades gracefully: the VWAP becomes a simple anchored mean, the channel uses an unweighted standard deviation, and the profile becomes a time-at-price distribution. The Data row in the table flags this state as "no-vol / DEGRADED" so you always know which mode you are in.
• The multi-timeframe dashboard uses higher-timeframe requests; you can turn it off to reduce load.
• This is an analysis/visualization tool, not a strategy — it does not place orders and is not optimized or backtested for entries/exits.
Disclaimer
This script is provided for educational and informational purposes only and is not financial, investment, or trading advice. It does not predict future prices. Markets carry risk and you can lose money. Past behaviour of any signal (including the calibration panel) does not guarantee future results. Always do your own research and consider consulting a licensed financial professional before trading. You are solely responsible for your decisions and their outcomes.
指标

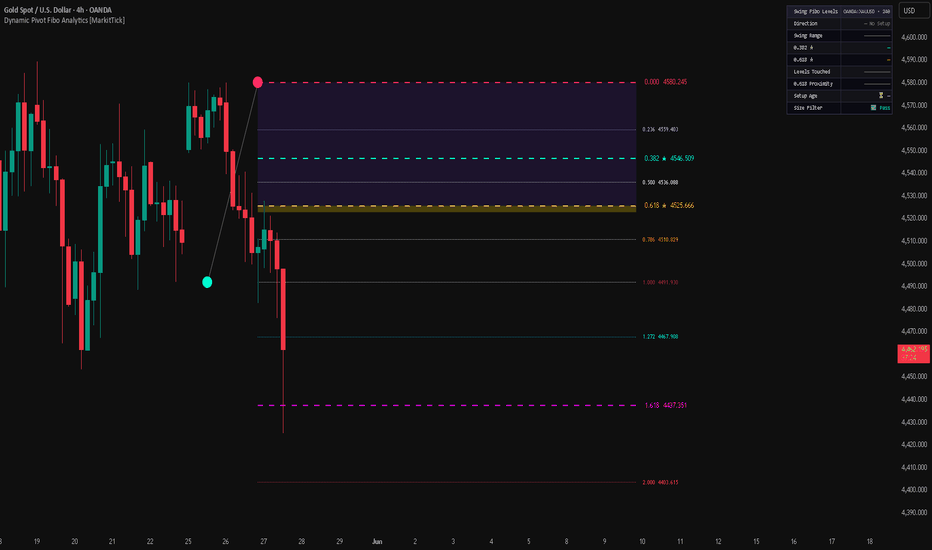
Dynamic Pivot Fibo Analytics [MarkitTick]💡 A highly advanced, automated technical analysis tool designed to objectively identify structural market swings and project key Fibonacci retracement and extension levels. By isolating mathematically confirmed pivot highs and lows, the algorithm eliminates the subjective bias traditionally associated with drawing retracement tools manually. The script dynamically maps out critical zones of interest—such as the widely observed Golden Pocket—while continuously evaluating the current price action against these historical vectors. Coupled with a real-time analytical dashboard, it provides traders with a comprehensive breakdown of swing volatility, level proximity, and directional bias, serving as a complete ecosystem for retracement-based methodologies.
✨ Originality and Utility
The primary utility of this script lies in its capacity to transform a traditionally manual and subjective charting process into an automated, mathematically rigorous system. While standard charting platforms require users to manually select anchor points for Fibonacci tools—often leading to inconsistent application—this script programmatically identifies the most statistically relevant extremums based on user-defined lookback periods.
Its originality is further highlighted by its multi-layered filtering architecture. Rather than treating every minor price fluctuation as a valid swing, the script incorporates an objective volatility filter utilizing either the Average True Range (ATR) or a strict percentage threshold. This ensures that only structurally significant market movements are measured, effectively filtering out stochastic market noise. Furthermore, the integration of an on-chart analytical dashboard and a dynamic level-touch highlighting system brings a level of interactive feedback rarely seen in standard visualization tools, allowing traders to instantly gauge the health and maturity of an active swing.
🔬 Methodology and Concepts
● Pivot Extrema Detection
The foundational logic relies on the identification of local minimums and maximums within a continuous time-series dataset. The algorithm evaluates a central candidate bar against a defined window of preceding and succeeding bars. A Pivot High is only confirmed if the candidate's high remains unbreached across the entire evaluation window, ensuring it represents a true structural peak. This mechanism inherently requires a confirmation delay to validate the peak, preventing the erratic shifting of anchors during live price formation.
● Swing Filtering and Validation
Once opposing pivot points are confirmed, the script calculates the absolute price range of the resulting swing. To prevent false positives in low-volatility environments, the script applies a normalization filter. It evaluates the raw swing range against either a fractional multiplier of the current ATR or a static percentage of the asset's price. Swings failing to meet this geometric threshold are automatically discarded, preserving chart clarity.
● Fibonacci Mathematics and Zonal Mapping
Upon validating a swing, the algorithm applies standard Fibonacci sequence ratios to the defined price vector. It calculates core retracements (0.236, 0.382, 0.500, 0.618, 0.786) and projects mathematical extensions (1.272, 1.618, 2.000) for target mapping. The script specifically isolates the 0.618 to 0.650 region, commonly referred to as the Golden Pocket, rendering it as a distinct filled zone to highlight its historical significance as an area of mean reversion.
🎨 Visual Guide
● Main Chart Elements
Swing Line: A distinct, solid line directly connecting the anchored Pivot Low and Pivot High, visually defining the active vector being measured.
0.000 and 1.000 Anchors: The baseline extremums of the swing, marked by precise labels and dashed/dotted lines to indicate the absolute boundaries of the measured range.
Key Retracement Levels (0.382 & 0.618): Rendered with emphasized, dashed lines to denote their elevated importance in traditional retracement theory. The 0.618 level utilizes a distinct gold color to draw the user's attention.
Minor Retracement Levels (0.236, 0.500, 0.786): Displayed using subtle, dotted lines to provide contextual support without overwhelming the primary visual hierarchy.
Golden Pocket Fill: A translucent shaded region spanning the area between the 0.618 and 0.650 price coordinates, serving as a primary zone of interest for exhaustion.
Touch Highlights: When the current price intersects any active Fibonacci line, the line's color dynamically shifts (defaulting to white), providing immediate visual feedback of level interaction.
Historical Swings: If enabled, the script retains ghosted, dotted representations of previously confirmed swings, allowing users to analyze past interactions without cluttering the active setup.
● Dashboard Elements
Direction: A color-coded textual readout confirming whether the active, validated swing is Bullish or Bearish.
Swing Range: A visual block-bar representation (scaling from 0 to 10) evaluating the magnitude of the current swing relative to the prevailing ATR.
Key Levels: Direct, high-precision price readouts for the critical 0.382 and 0.618 levels.
Levels Touched: A scoring metric visualizing how many individual Fibonacci levels the current price action has interacted with since the setup was confirmed.
0.618 Proximity: A dynamic strength bar indicating how close the current price is to the Golden Ratio, aiding in the anticipation of level tests.
Setup Age: A raw bar-count indicating the duration since the swing anchor was established.
📖 How to Use
Setup Identification: Apply the script to your chart and observe the automated generation of the Swing Line. The script will wait for the defined lookback period to confirm a pivot before drawing the corresponding Fibonacci grid.
Trend Context: Use the Dashboard to immediately confirm the direction and strength of the swing. A high Swing Range score indicates a robust structural move, lending higher confidence to the subsequent retracement levels.
Zone Monitoring: Focus attention on the highlighted Golden Pocket zone. As price retraces into this filled area, monitor for deceleration or reversal patterns. The built-in proximity score on the dashboard will alert you as price nears this critical threshold.
Interaction Feedback: Watch for the dynamic Touch Highlights. When a level changes color, it confirms that price has officially probed that mathematical coordinate.
Alert Automation: Instead of manually monitoring the chart, configure the script's alert parameters to notify you strictly when price touches a key level (such as the 0.382 or 0.618), streamlining your analytical workflow.
⚙️ Inputs and Settings
Swing Settings: Controls the structural strictness of the algorithm. Adjusting the "Left Bars" alters the required validation period for a pivot, while "Extend Lines" controls the horizontal projection length of the drawn levels.
Swing Filter: Toggles the volatility validation on or off. Users can select between an "ATR" multiplier or a pure "Percent" requirement, establishing the minimum acceptable size for a swing to be plotted.
Direction Filter: Allows the user to isolate the script's output to strictly Long setups, strictly Short setups, or Both simultaneously.
Fib Extensions & Golden Pocket: Provides granular control over the visibility and aesthetic rendering of the >1.000 extension levels and the specialized 0.618-0.650 fill zone.
Level Touch Alerts: Configuration options for automating notifications. Users can toggle alerts for specific key levels, all levels collectively, and customize the visual highlight color triggered by these interactions.
Historical Swings: Defines the quantity of past setups to retain on the chart for retrospective analysis.
Dashboard Settings: Customization parameters for the analytical table's background and text colors to ensure readability across different chart themes.
🔍 Deconstruction of the Underlying Scientific and Academic Framework
The theoretical foundation of this script intersects two distinct disciplines of market analysis: algorithmic extremum detection and geometric proportion analysis.
The extremum detection relies on a localized peak-trough evaluation algorithm. By isolating a data point and verifying that its scalar value is strictly greater than (or less than) all corresponding values within a symmetric `n`-period domain, the script establishes a mathematically unassailable structural node. This method effectively filters out continuous monotonic sequences and isolates true inflection points in the time-series data.
To prevent the algorithm from validating micro-fluctuations inherent in random walk market environments, it employs a normalization technique using Average True Range (ATR). ATR provides a dynamic measure of standard deviation over time. By forcing the absolute scalar difference between two validated extremums to exceed a fractional coefficient of the ATR, the script ensures that the analyzed vector falls outside the bounds of standard market noise, thereby validating its statistical significance.
Once the vector is established, the script applies the principles of the Fibonacci sequence—a recursive mathematical progression where the ratio of successive terms converges on Phi (approximately 1.618). In the context of market dynamics, these ratios (particularly their inverses and square roots, such as 0.618 and 0.382) have been empirically observed to act as psychological focal points for mass market behavior. The script translates these geometric proportions into static coordinate thresholds, creating a structured, grid-based framework for evaluating the amplitude and potential exhaustion points of counter-trend market phases.
⚠️ Disclaimer
All provided scripts and indicators are strictly for educational exploration and must not be interpreted as financial advice or a recommendation to execute trades. I expressly disclaim all liability for any financial losses or damages that may result, directly or indirectly, from the reliance on or application of these tools. Market participation carries inherent risk where past performance never guarantees future returns, leaving all investment decisions and due diligence solely at your own discretion. 指标
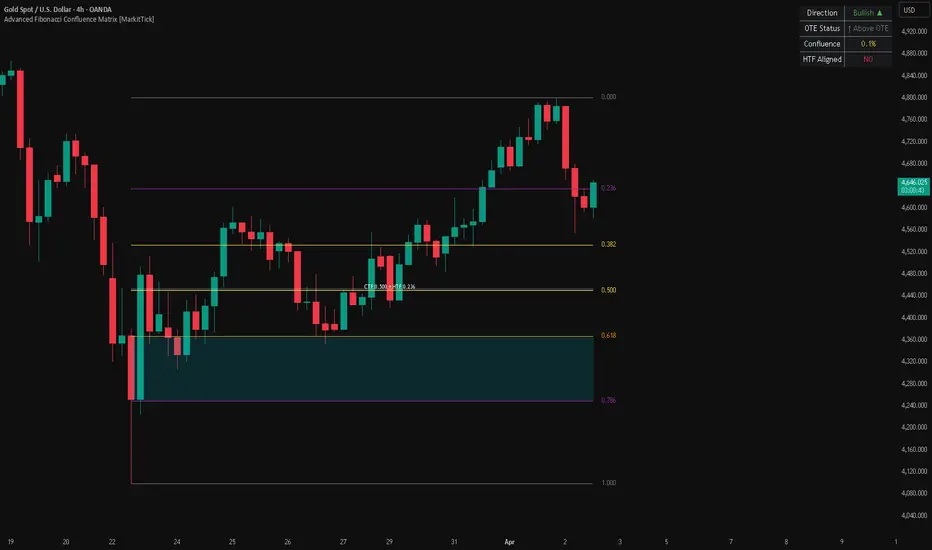
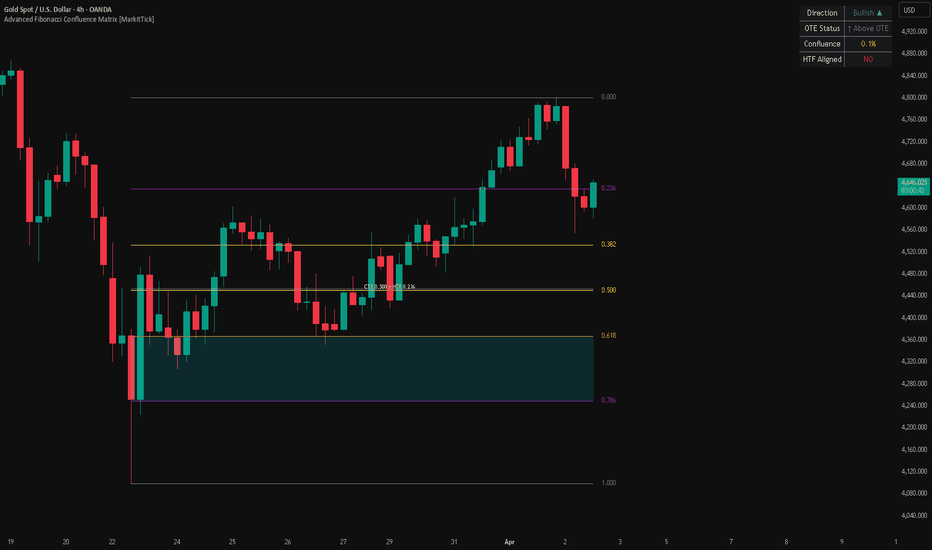
Advanced Fibonacci Confluence Matrix [MarkitTick]💡 The Advanced Fibonacci Confluence Matrix is a sophisticated multi-dimensional analytical tool designed for professional traders who demand precision in identifying high-probability institutional entry zones. By integrating Fibonacci retracement logic with multi-timeframe (MTF) confluence and Fair Value Gap (FVG) detection, this script identifies the "Optimal Trade Entry" (OTE) zones where various technical factors align. It serves as a comprehensive institutional-grade execution engine, providing not just visual zones, but also automated risk calculation and webhook-ready alert payloads for algorithmic execution.
● ✨ Originality and Utility
Traditional Fibonacci tools are often static and require manual adjustment, leading to subjective bias and missed opportunities during rapid price action. This indicator revolutionizes the process by:
• Dynamic Anchor Selection : It automatically identifies significant swing highs and lows to anchor Fibonacci levels, ensuring that the zones remain relevant to current market structure.
• Multi-Timeframe Confluence : It fetches Fibonacci data from higher timeframes (HTF), such as the Daily or 4-hour charts, and overlays them onto the local timeframe. This allows traders to see when a local OTE zone aligns with a major institutional level.
• FVG Integration : The script looks for Fair Value Gaps within the OTE zones. The presence of an FVG serves as a "magnet" or "trigger," increasing the probability that price will react within that specific area.
• Automated Alert Logic : Unlike simple price alerts, this script generates a structured JSON payload including Entry, Stop Loss, Take Profit, and calculated Position Size based on user-defined risk parameters.
● 🔬 Methodology and Concepts
The indicator is built upon the premise of Institutional Order Flow and the "Discount vs. Premium" market theory.
• Fibonacci Retracement Engine : The core logic calculates standard ratios (0.236, 0.382, 0.5, 0.618, 0.786). The "Optimal Trade Entry" is specifically defined as the zone between the 0.618 and 0.786 retracement levels.
• The Confluence Matrix : The script maintains an internal matrix of "hits." When price enters a zone where a local Fibonacci level, an HTF level, and a Prime FVG all overlap, the confluence score increases, and the visual intensity of the zone changes to alert the trader.
• Fair Value Gap (FVG) Logic : The script detects imbalances where the High of Bar N is lower than the Low of Bar N+2 (for bearish) or the Low of Bar N is higher than the High of Bar N+2 (for bullish). It specifically filters for "Prime FVGs" that reside within the OTE retracement area.
• Risk-Adjusted Position Sizing : It uses the distance between the Entry (usually the 0.618 level or FVG edge) and the Stop Loss (usually the swing anchor) to calculate how many units should be traded to risk exactly X% of the account balance.
● 🎨 Visual Guide
• The OTE Zone (The Golden Box) : A shaded rectangle appearing between the 0.618 and 0.786 Fibonacci levels. A Green box signifies a bullish discount zone, while a Red box signifies a bearish premium zone.
• HTF Confluence Lines : Horizontal dashed lines across the chart representing the 0.5 (Equilibrium) and 0.618 levels from a higher timeframe. These are typically colored Orange or Purple to distinguish them from local levels.
• Fair Value Gap (FVG) Rectangles : Small, semi-transparent boxes that mark price imbalances. When these appear inside the OTE Zone, they are highlighted with a thicker border to indicate a "High Probability Trigger."
• Swing Anchor Labels : Small "H" (High) and "L" (Low) labels appear at the points where the Fibonacci tool is anchored. These labels help the trader verify the current market structure context.
• Signal Labels : When a confluence event occurs, a "BUY" or "SELL" label appears above or below the candle. The label includes the calculated "Risk:Reward" ratio for that specific setup.
• Dashboard Table : A small UI element in the corner of the chart displaying the current HTF trend status, the distance to the nearest OTE zone, and the calculated position size for the next trade.
● 📖 How to Use
• Identifying a Setup : Wait for the script to define a new swing move. Once the "OTE Zone" box is drawn, monitor the price as it retraces toward that box.
• Confirming Confluence : The highest quality trades occur when the price enters the OTE zone and simultaneously touches an HTF dashed line or fills a Prime FVG.
• Execution : Look for the "Long Entry" or "Short Entry" signal. The script is optimized for "Bar Close" execution to avoid repainting issues.
• Automation : If using webhooks, ensure your execution platform is set to receive the JSON format. The "Action," "Ticker," and "Qty" fields are automatically populated based on the signal.
• Exit Strategy : The default Take Profit is set to the 0.0 Fibonacci level (the swing high/low), while the Stop Loss is placed just beyond the 1.0 anchor point.
● ⚙️ Inputs and Settings
• Fibonacci Sensitivity : Adjust the "Swing Lookback" to determine how significant a high or low must be to act as an anchor. Higher values result in more "Macro" zones.
• HTF Resolution : A dropdown allowing you to select which timeframe (e.g., 60m, 240m, Daily) the confluence lines should be pulled from.
• Zone Selection : Toggle switches to enable or disable specific levels (e.g., show only the 0.618 and 0.786).
• Risk Management : Input your "Account Size" and "Risk Percentage" (e.g., 1% or 0.5%) to calibrate the automated position sizing alerts.
• Alert Configuration : Options to enable specific JSON payloads for "Long Only," "Short Only," or "Both."
● 🔍 Deconstruction of the Underlying Scientific and Academic Framework
The Advanced Fibonacci Confluence Matrix is grounded in the Golden Ratio Theory and the Efficient Market Hypothesis (EMH), specifically focusing on market inefficiencies.
• Mathematical Proportions : The indicator utilizes the irrational number Phi (approximately 1.618) and its inverse (0.618). These ratios are derived from the Fibonacci sequence, where each number is the sum of the two preceding ones. In financial markets, these ratios describe the recursive nature of price retracements and expansions.
• Statistical Mean Reversion : The use of the 0.5 level (Equilibrium) is based on the statistical principle of mean reversion, suggesting that price has a natural tendency to return to a central point of value before continuing a trend.
• Liquidity & Imbalance Theory : The Fair Value Gap detection is based on the "Information Asymmetry" model in economics. When a large institutional order enters the market, it creates a "gap" or "void" because the liquidity at certain price levels was consumed too quickly. Academically, these gaps represent "Inefficient Pricing" that the market seeks to "fill" to restore equilibrium.
• Confluence Probability : By applying the Law of Large Numbers and Multi-Factor Modeling, the script assumes that the intersection of independent variables (Local Fib + HTF Fib + FVG) reduces the "Noise-to-Signal" ratio, thereby increasing the statistical significance of the resulting trade signal.
⚠️ Disclaimer
All provided scripts and indicators are strictly for educational exploration and must not be interpreted as financial advice or a recommendation to execute trades. I expressly disclaim all liability for any financial losses or damages that may result, directly or indirectly, from the reliance on or application of these tools. Market participation carries inherent risk where past performance never guarantees future returns, leaving all investment decisions and due diligence solely at your own discretion. 指标
Fibonacci Confluence Grids (Levels + Time Zones) [Metrify]This script is built around a simple but often-misused idea: Fibonacci levels are only useful when the reference swing is meaningful. In practice, most traders do not fail because they “used the wrong ratio,” but because they anchored the Fib to a weak or inconsistent swing. A 0.618 level drawn from noise is still noise.
The core design of this indicator is therefore not “draw more levels” but to formalize three simple steps that we usually do inconsistently by eye:
identify an A→B swing,
filter that swing for significance, and
project both price levels and timing windows from that swing.
Once a valid swing is accepted, the script projects a configurable set of price Fibonacci levels (retracements and/or extensions) and a separate configurable sequence of time gates (bar offsets projected forward from point B). The price levels define a vertical map of potential reaction zones. The time gates define a horizontal map of potential timing windows. Used together, they create a 2D framework: not only where price may become sensitive, but also when the probability of a market event tends to increase.
Time gates: temporal structure and why “events cluster” around them
The time gate projects vertical markers forward from point B using a bar sequence (commonly Fibonacci-like). The key idea is not random, but practical timing structure.
Markets often exhibit rhythm: impulsive legs, pullbacks, consolidations, and expansions frequently have characteristic durations.
Time gates should be interpreted as attention windows: periods where you should expect the probability of a notable market event to be higher than usual. “Event” here is intentionally broad, because direction is not guaranteed:
acceleration / continuation burst
pullback completion and resumption attempt
volatility expansion after compression
reversal attempt (successful or failed)
fakeout / stop run / liquidity sweep
structural break and regime shift
This is why it’s accurate to say that significant events often occur around time gates. Not because the gate forces a reversal, but because it’s a timing checkpoint where participation and auction dynamics frequently change. Your edge comes from combining the gate with context: price location near a major Fib level, session behavior, and confirmation from price action/structure.
How to use it as a manual framework
A strong discretionary workflow is to treat this as a 2D confluence map: price zone × time window.
Start by asking: “Is the active A→B swing meaningful?” If it looks like chop, tighten filters (increase Min Size / Min Bars, or increase ZigZag reversal / pivot length). Once the swing quality is good, treat the map as a set of planned observation points.
When price approaches a major retracement (0.5/0.618/0.786) or extension (1.272/1.618), check whether a time gate is also nearby. If yes, you should expect higher information density so you watch for confirmation rather than forcing prediction.
Confirmation can be whatever your style uses: structure break, reclaim, rejection candle quality, volatility expansion, etc.
If price is mid-range (far from major fibs) and far from gates, that’s often low-quality territory for forcing trades —> your standards should be higher, not lower. 指标

Automatic Fibonacci Levels [WillyAlgoTrader]Automatic Fibonacci Levels is an overlay indicator that detects the dominant swing high and swing low within the visible chart area, draws a full Fibonacci retracement and extension grid between them, highlights the Optimal Trade Entry (OTE) zone at 61.8%–78.6%, marks a target zone at the −50% to −61.8% extension, and labels four take-profit levels — all updating automatically as you scroll or zoom the chart.
Most Fibonacci tools on TradingView are either manual (you draw them yourself and they become stale as price evolves) or pivot-based (anchored to a fixed lookback period that may not match the swing you're actually looking at). This indicator takes a different approach: it uses the visible chart range as its context. It finds the highest high and lowest low within what you can currently see, determines trend direction based on which came first, and draws the full Fibonacci grid accordingly. When you scroll or zoom to a different area, the grid adapts — making it a dynamic analysis companion rather than a static drawing tool.
🔍 WHAT MAKES IT ORIGINAL
1. Visible-range swing detection. Instead of using a fixed pivot lookback or requiring manual anchor placement, the indicator scans the chart's visible window (chart.left_visible_bar_time to chart.right_visible_bar_time) to find the absolute high and low. This means the Fibonacci grid always reflects the swing structure you are currently analyzing. Zoom into a 50-bar range to see intraday retracements; zoom out to 500 bars to see the macro structure — the grid adjusts automatically. When the visible range changes (scroll or zoom), swing detection resets and recalculates.
2. Automatic trend direction from swing sequence. The indicator determines bullish or bearish bias by comparing when the swing low and swing high occurred. If the swing low formed first and the swing high formed later, the trend is classified as bullish (retracement levels are drawn down from the high, extensions project upward). If the swing high came first, the trend is bearish (retracement down from the low, extensions project downward). No manual input is needed — the grid orientation follows the price structure.
3. OTE Entry Zone + Target Zone as highlighted boxes. Two key zones are highlighted with semi-transparent boxes:
— Entry Zone (61.8%–78.6%) : the Optimal Trade Entry area from ICT/SMC methodology — the deep retracement zone where institutional re-entry is most likely
— Target Zone (−50% to −61.8%) : the extension zone where breakout moves frequently reach
Both zones have configurable colors and optional text labels ("ENTRY ZONE" / "TARGET ZONE") inside them. Zone-touch alerts fire when price enters either box for the first time.
4. Four labeled take-profit levels. TP labels are placed at key Fibonacci levels to provide a structured scale-out framework:
— TP1 at 38.2% (first retracement target — conservative exit)
— TP2 at 0% (full swing retest — swing high in uptrend, swing low in downtrend)
— TP3 at −27.2% (first Fibonacci extension)
— TP4 at −61.8% (deep extension — runner target)
Each TP level is only displayed if the corresponding Fibonacci line is enabled, keeping the chart clean.
5. 16 individually toggleable levels. The indicator supports a comprehensive set of levels: 0%, 23.6%, 38.2%, 50%, 61.8%, 70.6%, 78.6%, 100% (standard retracements), plus 18%, 150%, 200% (deep retracements), and −18%, −27.2%, −50%, −61.8%, −100% (extensions). Each level can be toggled on or off independently, so you can configure exactly the grid density you prefer — from a minimal 4-level setup to a full 16-level deep analysis.
⚙️ HOW IT WORKS
Swing detection:
On every bar, the script checks whether the current bar falls within the chart's visible time window (using chart.left_visible_bar_time and chart.right_visible_bar_time). Within this window, it tracks the highest high and lowest low, along with their bar indices. When the visible window changes (scroll/zoom), all swing data resets and recalculates from scratch. This ensures the grid always reflects your current view.
Trend direction:
If swingLowBarIdx < swingHighBarIdx (low came first), the trend is classified as bullish — Fibonacci levels count downward from the swing high (0% = high, 100% = low), and extensions project above the high. If the high came first, the trend is bearish — levels count upward from the swing low, extensions project below.
Level calculation:
Each Fibonacci level is calculated as: price = anchor ± (swingRange × ratio), where the anchor and direction depend on the trend bias. For a bullish trend: 0% = swingHigh, 61.8% = swingHigh − range × 0.618, −50% = swingHigh + range × 0.5. For bearish: mirrored.
Zone detection:
The Entry Zone (61.8%–78.6%) and Target Zone (−50% to −61.8%) are computed as price ranges. On each confirmed bar, the script checks if the close falls within either zone. A zone-touch alert fires on the first confirmed bar inside the zone (no repeated alerts while price stays in the zone). The inEntryZone / inTargetZone state resets when price leaves, allowing re-entry detection.
Drawing:
All visual elements (lines, labels, boxes) are drawn on barstate.islast and cleaned up on each redraw to prevent accumulation. Lines extend from 2 bars before the current bar to the label offset position. Zones use extend.right so they remain visible as new bars form.
📖 HOW TO USE
Reading the chart:
— Orange horizontal lines = Fibonacci levels (retracement + extensions)
— Optional % labels next to each line = level identification
— Gold semi-transparent box = Entry Zone (61.8%–78.6% OTE)
— Gold semi-transparent box with "TARGET ZONE" = extension target (−50% to −61.8%)
— TP1–TP4 labels = structured take-profit levels
— Optional diagonal line = swing connection (low-to-high or high-to-low)
Suggested workflow:
— Zoom to the swing you want to analyze — the grid adapts automatically
— In a bullish trend: look for buy entries when price retraces into the Entry Zone (61.8%–78.6%), with stop loss below 100% (swing low), targeting TP1 (38.2%) → TP2 (0% / swing high) → TP3 (−27.2%) → TP4 (−61.8%)
— In a bearish trend: look for sell entries when price retraces up into the Entry Zone, stop above swing high, targeting downward extensions
— Use the dashboard to confirm trend direction and monitor whether price is currently in the Entry or Target zone
— Set alerts for zone touches to get notified when price reaches OTE or target levels without watching the chart
Customization tips:
— For a clean chart: enable only 0%, 61.8%, 78.6%, 100%, −27.2%, −61.8% — this gives you the OTE boundaries, swing anchors, and two extension targets
— For deep analysis: enable all 16 levels to see the full Fibonacci structure
— Adjust Label Offset to move level labels further right if your chart is crowded
— Toggle Show Diagonal Swing Line to visually confirm which high/low pair is being used
⚙️ KEY SETTINGS REFERENCE
— Show All Elements (default On): master toggle for all Fibonacci visuals
— Line Width (default 1): thickness of Fibonacci lines (1 = subtle, 5 = bold)
— Line Style (default Dashed): solid, dashed, or dotted
— Label Offset (default 17 bars): how far right of the last bar to place labels
— Individual Levels : 16 toggleable levels from 200% to −100%
— Show Entry Zone (default On): highlight the 61.8%–78.6% OTE box
— Show Target Zone (default On): highlight the −50% to −61.8% extension box
— Show Text in Zones (default On): display "ENTRY ZONE" / "TARGET ZONE" labels
— Show TP Labels (default On): display TP1–TP4 at key levels
— Show Level % Labels (default Off): display percentage text next to each line
📊 Dashboard
The info panel displays:
— Trend direction (Bullish / Bearish) based on swing sequence
— Signal status (Entry Zone / Target Zone / —) when price enters a key zone
— Swing range in price units
— Current timeframe and indicator version
🔔 Alerts
Two alert conditions (each fires once per zone entry on bar close):
— Entry Zone touch : price closes inside the 61.8%–78.6% retracement zone
— Target Zone touch : price closes inside the −50% to −61.8% extension zone
Both support standard text and JSON webhook format.
⚠️ IMPORTANT NOTES
— This indicator anchors to the visible chart range — it recalculates when you scroll or zoom. This is a feature, not a bug: it lets you analyze any swing by simply framing it on your screen. However, it means the grid will change if you move the chart.
— Fibonacci levels are not predictive — they are reference points based on the measured swing range. Price may or may not react at any given level.
— The Entry Zone (61.8%–78.6%) is derived from the OTE concept used in ICT/SMC methodology. It represents a high-probability retracement area, but no retracement zone guarantees a reversal.
— Zone alerts require bar-close confirmation and fire once per entry — they do not repeat while price remains in the zone.
— Works across all asset classes and timeframes. No volume data required. 指标

BE-Fib Channel 2 Sided Trading█ Overview:
"BE-Fib Channel 2 Sided Trading" indicator is built with the thought of 2 profound setups named "Cup & Handle (C&H)" and "Fibonacci Channel Trading (FCT)" with the context of "day trading" or with a minimum holding period.
█ Similarities, Day Trading Context & Error Patterns:
While the known fact is that both C&H and FCT provide setups with lesser risk with bigger returns, they both share the similar "Base Pattern".
Note: Inverse of the above Image shall switch the setups between long vs short.
Since the indicator is designed for smaller time-frame candles, there may be instances where the "base pattern" does not visually resemble a Cup & Handle (C&H) pattern. However, patterns are validated using pivot points. The points labeled "A" and "C" can be equal or slightly slanted. Settings of the Indicator allows traders a flexibility to control the angle of these points to spot the strategies according to set conditions. Therefore, understanding the nuances of these patterns is crucial for effective decision-making.
█ 2 Sided Edge: FCT suggests to take trade closer to the yellow line to get better RR ratio. this leaves a small chance of doubt as to; what if price is intended to break the Yellow line thereby activating the C&H.
Wait for the confirmation is a Big FOMO with a compromised RR.
Hence, This indicator is designed to handle both the patterns based on the strength, FIFO and pattern occurring delay.
█ How to Use this Indicator:
Step 1: Enable the Show Sample Sensitivity option to understand the angle of yellow line shown in the sample image. By enabling this option, On the last bar you shall see 4 lines being plotted depicting the max angle which is acceptable for both long and short trades.
Note: Angle can be controlled via setting "Sensitivity".
Higher Sensitivity --> Higher Setup identification --> can lead to failed setups due to 2 sided trading.
Lower Sensitivity --> Lower Setup identification --> can increase the changes of being right.
Step 2: Adjust the look back & look forward periods which shall be used for identifying patterns.
Note: Smaller values can lead to more setups being identified but can hamper the performance of the indicator while increasing the chances of failures. larger values identifies more significant setup but leads to more waiting period thereby compromising on the RR.
Step 3: Adjust the Base Range.
Note: Smaller values can lead to more setups being identified but can hamper the performance of the indicator while increasing the chances of failures. larger values identifies more significant setup but leads to more Risk on play.
Step 4: set the Entry level for FCT & Set the SL for Both FCT & C&H and Target Reward ratio for C&H.
█ Features of Indicator & How it works:
1. Patterns are being identified using Pivot Points method.
2. Tracks & validates both the setups simultaneously on every candle and traded one at a time based on FIFO, New setups found in-between, Defined Entry Levels while on wait for the other pattern to get activated.
3. Alerts added for trade events.
4. FCT setups are generally traded with trailed SL level and increasing Target level on every completed bar. while C&H has the standard SL & TP level with no Trail SL option.
DISCLAIMER: No sharing, copying, reselling, modifying, or any other forms of use are authorized for our documents, script / strategy, and the information published with them. This informational planning script / strategy is strictly for individual use and educational purposes only. This is not financial or investment advice. Investments are always made at your own risk and are based on your personal judgement. I am not responsible for any losses you may incur. Please invest wisely.
Happy to receive suggestions and feedback in order to improve the performance of the indicator better. 指标

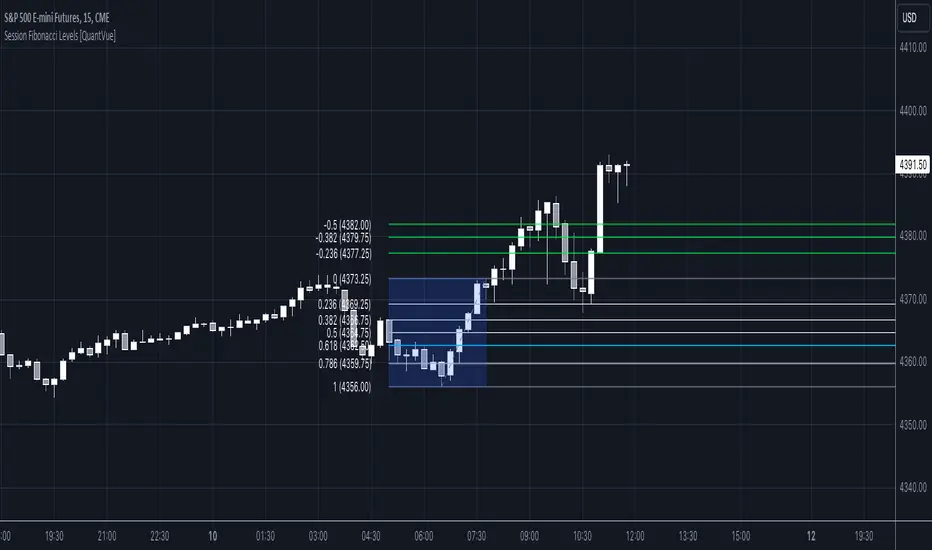
Session Fibonacci Levels [QuantVue]The "Session Fibonacci Levels" indicator is a powerful tool designed for traders who aim to use Fibonacci retracement and extension levels in their trading strategy.
The indicator combines Fibonacci levels with customized trading sessions, allowing traders to observe and utilize Fibonacci levels that are automatically calculated for each defined session.
This approach offers a dynamic and session-relevant perspective on potential support and resistance levels, which can be crucial for intraday trading strategies.
🔹The indicator calculates Fibonacci retracement and extension levels based on the high and low prices of a specified trading session, dynamically adjusting to the location of the high and low bar.
If the low of the session occurs before the high, the fib levels are measured from low to high.
If the low of the session occurs after the high, the fib levels are measured from high to low.
🔹Users can set their time zone and define trading sessions, allowing for flexibility and applicability across global markets. This is particularly beneficial for traders who focus on specific market hours like the London or New York sessions.
Important sessions:
New York (8:00am - 5:00pm EST)
London (3:00am - 12:00pm EST)
Asia (7:00pm - 4:00am EST)
Custom session (user defined session in indicator settings)
🔹The indicator dynamically updates Fibonacci levels as new highs and lows are made within the session, keeping the analysis current. Additionally, it provides alerts when prices hit key Fibonacci levels, aiding in timely decision-making.
How to Use:
Configure the time zone and session time
Once the session begins, the indicator will begin highlighting the session range
When the session ends, Fibonacci levels based on the high and low of the session will be drawn
Use these levels to identify potential support and resistance areas
指标

Fibonacci Structure & Trend Channel (Expo)█ Overview
The Fibonacci Structure & Trend Channel (Expo) is designed to identify trend direction and potential reversal levels and offer insights into price structure based on Fibonacci ratios. The algorithm plots a Fibonacci channel, making it easier for traders to identify potential retracement points. Additionally, the Fibonacci market structure is plotted to enhance traders' understanding of the underlying order flow.
█ How to Use
Identify Trends
Use the plotted Fibonacci Trend Line to identify the direction of the market trend. A green line typically signifies a bullish trend, while a red line signifies a bearish trend.
Retracement Levels
The plotted Fibonacci levels can act as potential support or resistance levels. Look for price action signs at these levels for entry or exit points.
Channel Trading
If you enable the Fibonacci channel, the upper and lower bounds can act as overbought or oversold levels.
Market Structure
The plotted Fibonacci market structure serves as a valuable tool for dissecting the underlying order flow and gauging the strength or weakness of a trend. By analyzing these structures, traders can identify key levels where supply and demand intersect, which often act as pivotal points for trend reversals or accelerations. This visual representation simplifies complex market dynamics. Whether you're looking to catch a new trend early or seeking confirmation for a potential reversal, understanding the market structure plotted by the Fibonacci ratios can provide actionable insights for various trading strategies.
Use the Table
The information table can provide quick insights into the current trend and when it started.
█ Settings
The Fibonacci settings allow traders to specify the Fibonacci retracement levels that will be used to calculate the trend and its channel.
The Fibonacci Structure Trend Channel structure settings enable traders to fine-tune how the indicator identifies and plots the underlying price structure.
-----------------
Disclaimer
The information contained in my Scripts/Indicators/Ideas/Algos/Systems does not constitute financial advice or a solicitation to buy or sell any securities of any type. I will not accept liability for any loss or damage, including without limitation any loss of profit, which may arise directly or indirectly from the use of or reliance on such information.
All investments involve risk, and the past performance of a security, industry, sector, market, financial product, trading strategy, backtest, or individual's trading does not guarantee future results or returns. Investors are fully responsible for any investment decisions they make. Such decisions should be based solely on an evaluation of their financial circumstances, investment objectives, risk tolerance, and liquidity needs.
My Scripts/Indicators/Ideas/Algos/Systems are only for educational purposes!
指标

指标