[3Commas] POL Grid Long Indicator POL Grid — Long Indicator
🔷 What it does:
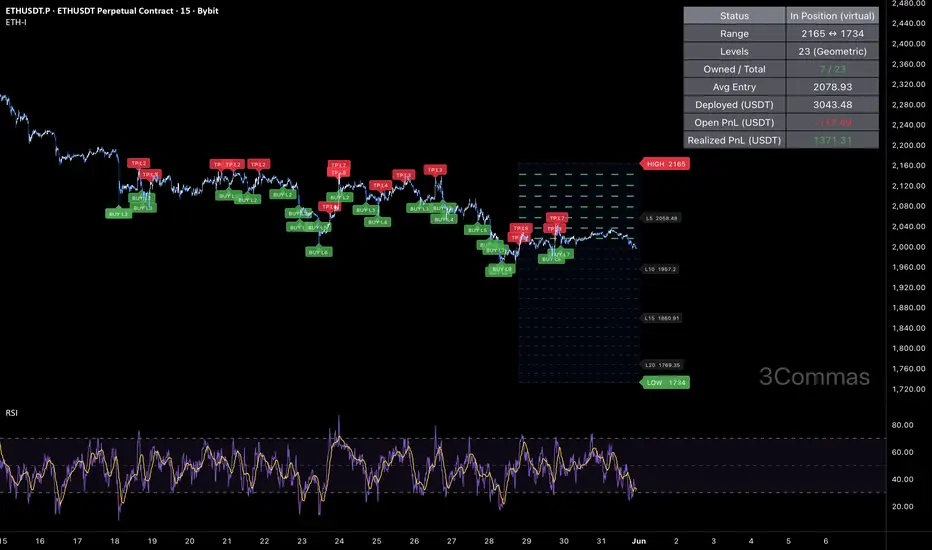
This is a signal-only indicator that mirrors a price-grid long workflow on POL / USDT between two fixed bounds. It tracks up to 36 independent virtual slots between a configurable High and Low — each slot fires a webhook-ready buy signal when price crosses down through it, and a paired sell signal when price subsequently crosses up through the slot immediately above. The indicator computes a running average entry, total deployed capital, and open PnL from the live slot ledger and renders all of it on the chart.
- Pre-computes 7–200 grid levels in Geometric (default) or Arithmetic spacing.
- Each slot is an independent ownership flag with its own buy/sell webhook payload.
- Avg entry is derived from fill-by-fill bookkeeping — total cost and total qty are updated on every event.
- Every event emits a webhook-ready JSON alert payload tagged with the specific grid slot.
🔷 Who is it for:
- Swing traders harvesting volatility on POL in range-bound regimes.
- Bot operators looking for a chart-driven signal source that emits per-slot JSON ready for a DCA Bot configured for grid execution.
- Traders who want to monitor a virtual grid state — avg entry, owned slots, deployed capital, open PnL — directly on the chart without a backtest engine.
- Portfolio operators using a high-trade-count contributor alongside directional strategies.
🔷 How does it work:
Grid Construction: On script load, the indicator computes N price levels between the configured High and Low bounds. In Geometric mode (default), level k is at High × (Low/High)^(k/(N-1)), giving constant percent spacing — approximately 1.0% per step at default settings. In Arithmetic mode, levels are linearly spaced by absolute price.
Per-Slot State Machine: Each grid level is an independent slot tracked by a boolean ownership flag. When close price crosses down through an empty slot's level, the slot is marked owned, virtual cost-basis is added, and the BUY webhook payload is dispatched. When close price crosses up through the level immediately above an owned slot, the slot is marked free, virtual cost-basis is subtracted, and the SELL webhook payload is dispatched.
Honest Virtual Bookkeeping: Total cost and total qty are updated incrementally on each event, so the avg entry, deployed capital, and open PnL displayed in the status table reflect the actual broker-equivalent position state — no shortcuts from base entry, no synthetic averaging. The table also accumulates the realized PnL from every closed slot (the exact round-trip profit between adjacent levels), so it shows how much the grid has actually earned over the chart history.
No Trailing, No Stop Loss: By design, each slot has a fixed exit (the level above). The indicator never trails the exit and never signals a slot-out for a loss — slots that fall below their entry stay owned until price comes back. This is the canonical grid-bot behavior.
🔷 Why it's unique:
- Per-Level Webhook Ledger: Every BUY and SELL emits a fully-formed JSON alert payload tagged with the specific grid slot ("Grid_BUY_L5" / "Grid_TP_L5"). The indicator can drive a DCA Bot configured for grid emulation without any glue layer.
- Fill-by-Fill Avg Entry: The orange avg-entry line is derived from running totals updated on every event — what you see is what the broker-equivalent position would actually have.
- Active Slot Highlighting: Owned grid levels are rendered with a thicker green stroke; empty slots stay dashed gray. Slot density and current loading are visible at a glance.
- Range Box & Bounds Labels: A semi-transparent box spans the configured High/Low range, and crisp HIGH/LOW labels mark the bounds — the grid topology is obvious without zooming.
- Calibrated for POL 15m: Default bounds, level count, and step size are set against POL's recent observed range. The 36-level geometric ladder gives roughly 1.0% per step — wide enough to clear taker fees on each round-trip, granular enough to keep catching 15m swings inside the range.
🔷 Considerations Before Using the Indicator:
Market Selection & Range Validity: Grid strategies are most profitable in range-bound, mean-reverting markets. On strong directional trends below the configured Low, slots will keep marking as owned as price falls and won't free until price reverses. The default High/Low (0.11847 / 0.08376) was set against POL's recent observed range; update both whenever the regime changes.
Capital Deployment: The default Total Investment of 10,000 USDT is a virtual reference used for the avg-entry and open-PnL computation. The real sizing happens on the bot side — match the indicator's per-slot allocation to your bot's grid configuration to keep the avg-entry display honest.
Cross Detection Granularity: Crossings are detected on bar close, comparing the current close to the previous close. A bar that spikes through a level and returns within the same bar may be missed by design — this prevents over-signaling on intra-bar wicks.
Live vs Historical State: The virtual slot ledger is rebuilt from chart history each time the indicator is recompiled. If the indicator is added mid-deployment or the live bot diverges from the signal stream (manual interventions, partial fills), the indicator state may not match the live bot. Toggle the indicator off and on to reset.
No Stop Loss: There is no exit signal on adverse moves below the lowest grid level. Risk is structurally capped on the bot side by the bounded Total Investment configured at the bot. If a hard stop is required, layer it on the bot side.
Backtesting Note: This is an indicator, not a strategy. There is no built-in P&L tester. For performance metrics over a ~3.9-month sample (800 closed trades, 53.25% win rate, 12.94% max drawdown, profit factor 1.315, +8.83% net return), use the companion strategy version on identical parameters. The 800-trade sample is well above the ~100-trade floor for statistical relevance.
🔷 How to Use It:
🔸 Add the indicator to a POL / USDT 15m chart.
🔸 Set the High and Low bounds to a range you expect POL to respect.
🔸 Pick Geometric (default, recommended) or Arithmetic spacing.
🔸 Set Grid Levels (7–200) and the virtual Total Investment used for avg-entry computation.
🔸 In the DCA Bot Webhook group, paste your Bot ID, Email Token, and Pair (QUOTE_BASE format, e.g., USDT_POL).
🔸 Create an alert on the indicator with "Any alert() function call". Paste the DCA Bot's webhook URL into the alert's Webhook field. Every grid-level buy and grid-level close will emit a dedicated JSON payload tagged with the slot index, so each level can be tracked independently downstream.
🔷 INDICATOR SETTINGS
High Price: Top of the grid. The highest level a slot can be created from.
Low Price: Bottom of the grid. The lowest level a slot can be created from.
Grid Levels: Number of price levels between High and Low (default 36, range 7–200).
Spacing Mode: Geometric (constant percent step) or Arithmetic (constant absolute step).
Total Investment (USDT): Virtual capital allocated across all slots. Used for the avg-entry and open-PnL computation only.
Bot ID / Email Token / Pair: Webhook fields injected into every alert payload.
Visualization: Toggle grid lines, range box, HIGH/LOW labels, avg entry plot, fill labels, signal triangles, status table (shows status, range, levels, owned slots, avg entry, deployed capital, open PnL, and cumulative realized PnL).
Brand Watermark: Configurable text, position, size, and transparency.
👨🏻💻💭 We hope this tool helps enhance your trading. Your feedback is invaluable, so feel free to share any suggestions for improvements or new features you'd like to see implemented.
__
The information and publications within the 3Commas TradingView account are not meant to be and do not constitute financial, investment, trading, or other types of advice or recommendations supplied or endorsed by 3Commas and any of the parties acting on behalf of 3Commas, including its employees, contractors, ambassadors, etc. 指标

Lucky NewsLucky News
Never get caught off guard by high-impact news again.
LUCKY NEWS is a minimal, no-clutter news tracker that lives right on your chart. Built for traders who check Forex Factory every morning — just enter your red folder events for the day, toggle them on, and a clean table shows exactly what's coming and when. No lines on your chart, no noise, just the information you need.
---
What It Does
- **8 customizable event slots** — enter currency, event name, and time for each red news release
- **Clean table display** — shows CUR | EVENT | TIME in a sleek dark overlay anywhere on your chart
- **Zero chart clutter** — table only, nothing drawn on your candles or price action
- **Stays visible all day** — events don't disappear or fade after they pass
- **Works in your timezone** — times use your chart's timezone setting automatically
---
How To Use
1. Check (www.forexfactory.com) each morning for red folder (high impact) events
2. Open Settings → enable each event slot and fill in the hour, minute, currency, and event name
3. Toggle unused slots off
4. The table updates instantly on your chart — no refresh needed
---
Example Setup
| CUR | EVENT | TIME |
|-----|-------|------|
| USD | FOMC | 11:00 |
| USD | CPI | 08:30 |
---
Why I Built This
As a futures scalper I need to know exactly when red news hits so I can stay out or be ready. I wanted something dead simple — no automation, no APIs, just a fast manual input that keeps my news front and center while I trade.
*Stay informed. Trade prepared. Stay lucky.*
— LuckyJo 指标

G8 Single Currency Rate Yield Ampel StableG8 Single Currency Rate/Yield Traffic Light
G8 Single Currency Rate/Yield Traffic Light is a macro-driven FX bias indicator designed to visualize whether the current interest-rate and yield environment supports a bullish, neutral, or bearish bias for a selected G8 currency.
The indicator is built around a simple but powerful macro principle:
Rising yields usually support a currency, while falling yields usually weaken it.
Rising short-rate futures usually imply lower expected policy rates and are therefore interpreted as bearish for the currency. Falling short-rate futures imply higher expected policy rates and are interpreted as bullish.
This tool is not designed as a standalone buy or sell signal. It is intended to act as a macro bias filter for FX traders who want to align their trade ideas with the current direction of rates, yields, and currency momentum.
Supported Currencies
The indicator currently supports the following G8 currencies:
USD
EUR
GBP
CHF
JPY
AUD
NZD
CAD
The selected currency can be changed directly in the settings menu.
Core Logic
The indicator calculates a score based on four possible components:
1. 2-Year Government Yield
The 2-year yield is usually very sensitive to central bank expectations.
2Y yield rising = bullish for the currency
2Y yield falling = bearish for the currency
2. 10-Year Government Yield
The 10-year yield reflects longer-term macro conditions, inflation expectations, growth expectations, and term premium.
10Y yield rising = supportive for the currency
10Y yield falling = negative for the currency
3. Short-Rate Futures
Short-rate futures are interpreted inversely.
Future price rising = lower expected rates = bearish for the currency
Future price falling = higher expected rates = bullish for the currency
Examples:
USD: SOFR future
EUR: Euribor future
GBP: short-rate / sterling rate future proxy
CAD: CORRA future proxy
CHF: SARON future proxy
AUD/NZD/JPY: rate future proxies depending on TradingView data availability
4. FX Proxy
The indicator can also include a currency proxy, such as:
DXY for USD
EURUSD for EUR
GBPUSD for GBP
AUDUSD for AUD
NZDUSD for NZD
USDCHF for CHF
USDJPY for JPY
USDCAD for CAD
For inverted pairs such as USDCHF, USDJPY, and USDCAD, the logic is automatically inverted.
Example:
USDJPY rising = JPY weakness
USDJPY falling = JPY strength
Score Interpretation
Each active module contributes either:
+1 = bullish contribution
0 = neutral / no contribution
-1 = bearish contribution
The total score is then plotted as a colored histogram.
Default interpretation:
Score >= +2 = bullish / green
Score between -1 and +1 = neutral / yellow
Score <= -2 = bearish / red
The thresholds can be adjusted in the settings.
Traffic Light Colors
Green
A green signal means that the selected currency currently has positive macro/rate momentum.
This may indicate that:
Yields are rising
Rate futures are falling
The FX proxy is confirming currency strength
In practical FX analysis, this means the selected currency may be preferred as the stronger side of a currency pair.
Yellow
A yellow signal means that the picture is mixed or neutral.
This may happen when:
Short-term yields and long-term yields disagree
Rate futures and yields send conflicting signals
The FX proxy is not confirming the rate/yield picture
In this state, traders may prefer to wait for clearer confirmation or rely more heavily on upcoming catalysts, price structure, or higher-timeframe analysis.
Red
A red signal means that the selected currency currently has negative macro/rate momentum.
This may indicate that:
Yields are falling
Rate futures are rising
The FX proxy confirms currency weakness
In practical FX analysis, this means the selected currency may be the weaker side of a currency pair.
Example Use Cases
EURUSD
If the EUR indicator is green and the USD indicator is red, this supports a EURUSD long bias.
If the EUR indicator is red and the USD indicator is green, this supports a EURUSD short bias.
If both currencies are green or both are red, the relative edge is less clear.
GBPJPY
If GBP is green and JPY is red, the macro/rate environment supports a GBPJPY long bias.
If GBP is red and JPY is green, the macro/rate environment supports a GBPJPY short bias.
AUDCAD
If AUD is green and CAD is red, the relative rate/yield picture supports AUDCAD long ideas.
If AUD is red and CAD is green, AUDCAD short ideas may be favored.
Recommended Timeframes
The indicator can be used on different timeframes depending on the trader’s style.
H1
The H1 timeframe is a good balance between responsiveness and stability. It is useful for intraday bias and short-term macro alignment.
Recommended setting:
Momentum Length: 8
H4
H4 can be used for a broader daily bias. It filters more noise and is better for traders who want fewer signal changes.
Daily
The daily timeframe can be used as a structural macro filter for swing trading and weekly FX planning.
Recommended Settings
For an H1 chart, a balanced default setup is:
Momentum Length: 8
2Y Yield: enabled
10Y Yield: enabled
Rate Future: enabled if data is available
FX Proxy: enabled
Long Threshold: +2
Short Threshold: -2
For a cleaner pure macro/rates model, the FX proxy can be disabled. In that case, the indicator focuses only on yields and short-rate futures.
Important Notes About Symbols
Some short-rate futures may not be available for every user depending on TradingView data access and exchange permissions.
If a futures symbol does not load, the indicator should still work because invalid symbols are ignored. In that case, the user can either:
disable the Rate Future module, or
manually replace the symbol in the settings with a valid TradingView symbol.
The most important components are usually the 2-year yield and short-rate future, because they are more directly linked to central bank expectations.
What This Indicator Is Designed For
This indicator is designed to help traders answer one specific question:
Does the current rate and yield environment support strength or weakness in this currency?
It can be used as part of a broader FX workflow:
1. Check macro calendar and news catalysts
2. Check the G8 currency traffic lights
3. Compare strong currencies against weak currencies
4. Build a directional bias for selected FX pairs
5. Use price action, volume profile, RSI, TSV, VWAP, or other tools for execution
The indicator is best used as a bias filter, not as a direct entry trigger.
Limitations
This indicator does not predict the future.
It does not include:
central bank speeches in real time
inflation surprises
geopolitical risk
liquidity shocks
positioning extremes
full yield curve analysis
options market structure
relative growth data
It should therefore be combined with macro context, event risk, technical structure, and proper risk management.
Disclaimer
This script is for educational and analytical purposes only. It does not provide financial advice, investment advice, or trading recommendations. All trading decisions are the responsibility of the user. Markets involve risk, and past behavior of rates, yields, or currencies does not guarantee future results. 指标
Session ATR Risk ToolSession ATR Risk Tool
## Overview
The Session ATR Risk Tool is a discretionary **risk-management and trade-planning overlay**. It sizes a stop loss from market volatility, projects fixed reward-to-risk targets (1:1, 1:2, 1:3), and draws a standard-deviation ladder so you can see your full trade geometry on the chart before you enter. It also estimates a contract count from a fixed dollar risk, and prints a context table of intraday, daily and weekly volatility.
It is built and tuned for Micro E-mini Nasdaq-100 (MNQ) intraday trading, but every parameter is exposed as an input, so it works on any symbol once you set the correct point value.
This tool does **not** generate buy/sell signals and makes no claim about win rate or profitability. It is a visualization and planning aid only.
## What makes it different
Most reward-to-risk tools place lines a fixed number of ticks or a single ATR away. This tool adds three things in one package:
1. **Two selectable stop engines.** The stop distance can be derived from either the chart-timeframe ATR (small, realistic intraday stops) or from a rolling average of completed *session* ranges (swing-sized stops). You choose which volatility regime sizes your risk.
2. **A standard-deviation ladder denominated in your own stop distance.** Instead of arbitrary fib or price-percent levels, each rung is a multiple (−0.5, 1, 2, 3, 4 by default, all editable) of the exact ATR-based stop distance, projected from entry. One "sd" on the chart always equals one unit of the risk you are actually taking.
3. **A volatility context table.** Intraday ATR, averaged session range, daily ATR(14) and weekly ATR(14) are shown side by side so the chosen stop can be judged against higher-timeframe volatility at a glance.
## How it works
- **Session range capture.** The script tracks the high and low of each completed session window (default 09:30–16:00 exchange time) and stores the high-low range. It keeps a rolling buffer of the most recent N sessions (default 10) and averages them to produce a "session ATR" in points.
- **Intraday ATR.** A standard ATR of configurable length is calculated on the chart timeframe for scalp-sized stops.
- **Stop distance.** `Stop distance = chosen basis × ATR multiplier`, where the basis is either the intraday ATR or the averaged session range. The multiplier lets you tighten or widen the stop.
- **Trade geometry.** From the entry price (live price by default, or a fixed price you type in) and the trade direction, the tool places the stop one stop-distance against you, then projects targets at 1×, 2× and 3× the stop distance for clean 1:1 / 1:2 / 1:3 reward-to-risk.
- **Standard-deviation ladder.** Each ladder rung is plotted at `entry + direction × stop distance × deviation`, giving an evenly scaled map of where price sits relative to your risk unit.
- **Position-size estimate.** Dollar risk per contract = stop distance × point value. Estimated contracts = floor(risk per trade ÷ dollar risk per contract). This is an arithmetic estimate for planning, not an order-routing instruction.
- **Higher-timeframe context.** Daily and weekly ATR(14) are pulled from confirmed higher-timeframe bars (non-repainting) for the context table.
All levels are drawn as faded horizontal rays anchored to the bar grid, so they stay locked to the candles when you pan or zoom. Drawings rebuild on the most recent bar to keep the chart clean.
## How to use it
1. Add the tool to an intraday chart of the instrument you trade.
2. Set **$ per Point** for your instrument (MNQ = 2.0, NQ = 20.0, MES = 5.0, etc.) and your **Risk per Trade ($)**.
3. Choose your **Stop Basis** — "Intraday ATR" for scalps and intraday entries, "Session Range" for wider, swing-style stops.
4. Adjust the **ATR Multiplier** to set how far the stop sits from entry. As a starting guide, roughly 1.0–2.0× with Intraday ATR on a 1–5 minute chart; if using Session Range, scale the multiplier down (around 0.10–0.20×) because the session range is much larger.
5. Set **Trade Direction** (Long or Short). Leave **Entry Price** at 0 to anchor the levels to live price, or type your actual fill price to lock the geometry in place after entry.
6. Read your plan off the chart: the Stop, the 1:1 / 1:2 / 1:3 targets, the standard-deviation ladder, and the info table showing the stop in points and dollars plus an estimated contract count.
## Inputs
- **Session Window / Sessions to Average** — defines the session and how many completed sessions feed the averaged session range.
- **Stop Basis / Intraday ATR Length / ATR Multiplier** — select and tune the volatility source for the stop.
- **Trade Direction / Entry Price** — direction toggle and optional fixed entry.
- **$ per Point / Risk per Trade ($)** — instrument tick value and account risk used for the size estimate.
- **SDev Ladder deviations** — the five editable ladder multiples.
- **Visual controls** — ray length back/forward, table toggle, and colors for up, down and entry levels.
## Notes and limitations
- The contract-count figure is an arithmetic estimate from your inputs. It is not connected to a broker and places no orders. Always confirm size and risk in your own platform.
- "Session ATR" here means the averaged high-low **range** of recent sessions, not a true-range calculation; it is intentionally a wider, regime-level measure.
- Higher-timeframe ATR values use confirmed bars to avoid repainting.
- Reward-to-risk targets are fixed geometric projections; they are not predictions of price reaching those levels.
- This script is a planning and visualization tool only. It is not financial advice and does not guarantee any outcome. 指标

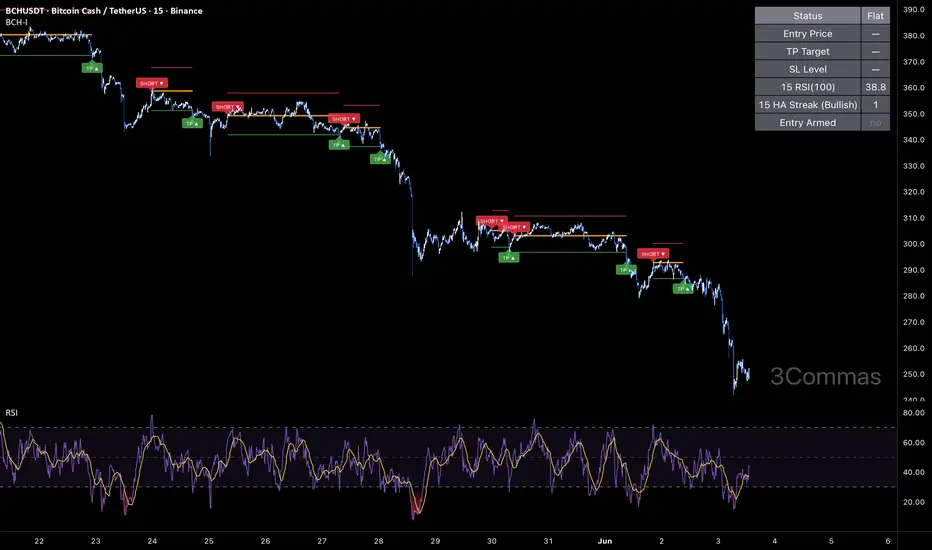
[3Commas] BCH Heikin Ashi RSI Fade - Short Indicator BCH Heikin Ashi RSI Fade — Short Indicator
🔷 What it does:
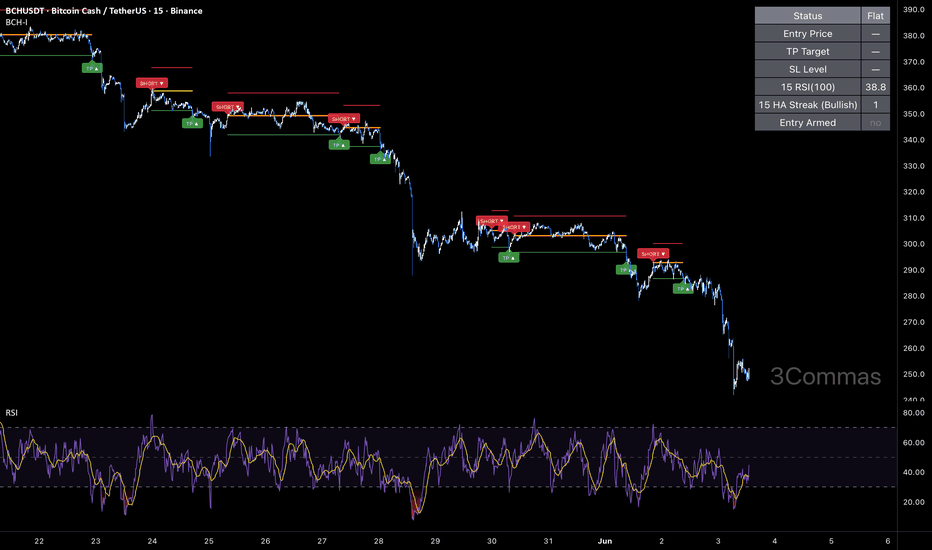
This is the signal-only companion to the BCH Heikin Ashi RSI Fade Short strategy. It tracks a virtual short position and fires webhook-ready alerts on three events — entry, Take Profit, and Stop Loss — without running a backtest engine. A virtual short is opened when the 15-minute Heikin Ashi prints a defined number of consecutive bullish candles AND the long-window RSI is above a soft-bias threshold on the same timeframe. The trade is then closed on a fixed Take Profit OR a fixed Stop Loss; no trailing, no averaging, no discretionary management.
- Tracks one virtual short at a time, sized at a configurable base order (default 280 USDT, used only for the on-chart PnL display).
- Dual confirmation entry: RSI(100) on 15m > 46 AND 7 consecutive Heikin Ashi bullish candles on 15m.
- Hard exit pair: TP at −2.1% from entry, SL at +2.5%.
- Every entry and exit emits a webhook-ready JSON alert payload for direct DCA Bot consumption.
🔷 Who is it for:
- Bot operators who want to drive a DCA Bot configured for one-shot short deals directly from TradingView alerts, without a strategy backtest object on the chart.
- Traders who want a clean, mechanical short signal with no averaging and no discretionary management once in trade.
- Swing traders looking for systematic short exposure on BCH when local upward thrusts overrun.
- Operators who prefer a lightweight signal overlay with a live status table over a full strategy tester.
🔷 How does it work:
RSI Bias Filter: A long-window RSI(100) is sampled from the 15-minute timeframe via request.security with lookahead disabled (no repaint). The threshold (default 46) sits just below the midline, so the filter is satisfied during prolonged bullish drift — exactly the regime where fading strength has the highest expectancy. When RSI falls below 46, the bias is considered to have flipped bearish and the indicator stops arming new shorts.
Heikin Ashi Streak Trigger: A 15-minute Heikin Ashi stream is sampled in parallel, and the indicator counts the number of consecutive same-direction HA candles using ta.barssince. When the bullish streak reaches the configured length (default 7), the trigger is armed. The default Bullish direction defines the fade-the-strength mode; switching to Bearish converts the logic into a trend-follow short.
Entry: When BOTH conditions are true at bar close and no virtual position is open, the indicator records the entry price, computes the TP and SL levels, fires the entry alert, and marks a SHORT label and triangle on the chart.
Exit: On each bar close while in position, the indicator checks close against the TP and SL levels. The first level reached closes the virtual short, fires the close alert, marks a TP or SL label, and accumulates realized PnL. This close-based detection matches what a polling bot sees at bar close.
🔷 Why it's unique:
- Dual-Signal Confirmation: A smoothed RSI(100) filters the regime bias while Heikin Ashi times the entry. RSI on a 100-bar window changes slowly and Heikin Ashi reacts to the immediate streak, so the two conditions cannot be satisfied by the same short-lived noise — every entry requires alignment of both.
- Fade-or-Follow Switch: A single input flips the HA direction filter between Bullish (fade strength, default) and Bearish (follow trend). The same engine handles two opposing signal archetypes.
- Live Status Table: An on-chart table shows position status, entry price, TP/SL levels, live RSI and HA streak values, and an entry-armed flag — so the current state of the virtual position is always visible at a glance.
- DCA Bot Integration: Each event emits a fully-formed JSON alert payload tagged with the action type, so the indicator can drive a DCA Bot configured for one-shot deals directly through TradingView alerts.
🔷 Considerations Before Using the Indicator:
Signal-Only Design: This is an indicator, not a strategy. It does not place orders or run a backtest engine — it tracks a virtual position purely to time alerts and display state. The base order size input is virtual and feeds only the on-chart PnL display; real position sizing happens on the bot.
Market & Timeframe: Calibrated for BCHUSDT on the 15-minute timeframe. The RSI-and-Heikin-Ashi combination is portable to other liquid crypto pairs that respect mean-reversion behavior, but the filter thresholds (RSI level, HA streak length) should be reviewed before redeployment. Live shorting requires a margin or perpetual venue.
Reference Performance: Because behavior mirrors the companion strategy 1:1, the strategy's backtest is a useful reference. Over a 177-trade backtest on BCHUSDT 15m (November 19, 2025 — June 3, 2026), the matching strategy logic returned +0.88% with a 0.52% maximum equity drawdown, 61.02% of trades profitable (108 / 177), and a profit factor of 1.169. The 177-trade sample is above the ~100-trade floor for statistical relevance. The value proposition is structural risk capping over a meaningful sample, not aggressive alpha.
Trending Markets: In strong sustained uptrends, the indicator will continue to arm short entries and will register stop-outs as price grinds higher. This is by design — the logic is positioned for ranges and rotations, not breakouts. The RSI(100) > 46 filter limits exposure to confirmed bullish regimes only, which is where fading has an edge; a regime change to a stronger trend will require manual oversight or a wider Stop Loss.
Past Performance: Past results do not guarantee future performance. Always demo-test before deploying live capital, and size as one part of a diversified portfolio.
🔷 How to Use It:
🔸 Adjust Settings: Open the indicator inputs and review the Base Order Size (virtual), the RSI filter (timeframe / length / condition / level), and the Heikin Ashi filter (timeframe / streak length / direction). Defaults are calibrated for BCHUSDT 15m — recalibrate per asset before deploying.
🔸 Fill the Webhook Fields: Enter your DCA Bot's Bot ID, Email Token, and Pair (QUOTE_BASE) into the DCA Bot Webhook inputs. These values are injected into every alert payload.
🔸 Create the alert: Add one alert on the indicator using "Any alert() function call". Paste the DCA Bot's webhook URL into the alert's Webhook field. The indicator will emit JSON payloads for short entry and close — formatted for direct DCA Bot consumption.
🔷 INDICATOR SETTINGS
Base Order Size (USDT): Virtual size used only for the status-table / PnL display. Real sizing happens on the bot.
RSI Timeframe / Length / Condition / Level: RSI bias filter applied to the host symbol.
HA Timeframe / Streak / Direction: Heikin Ashi consecutive-candle trigger. Direction defines fade (Bullish) vs follow (Bearish) mode.
Take Profit (%) / Stop Loss (%): Fixed distance exits from entry.
DCA Bot Webhook: Bot ID, Email Token, and Pair fields injected into every alert payload.
Visualization: Toggle Avg Entry / TP / SL plot lines, fill labels, signal triangles, and the status table (status, entry price, TP/SL levels, live RSI and HA streak, entry-armed flag).
Brand Watermark: Configurable text, position, size, and transparency.
👨🏻💻💭 We hope this tool helps enhance your trading. Your feedback is invaluable, so feel free to share any suggestions for improvements or new features you'd like to see implemented.
__
The information and publications within the 3Commas TradingView account are not meant to be and do not constitute financial, investment, trading, or other types of advice or recommendations supplied or endorsed by 3Commas and any of the parties acting on behalf of 3Commas, including its employees, contractors, ambassadors, etc. 指标
[3Commas] BCH Heikin Ashi RSI Fade - Short StrategyBCH Heikin Ashi RSI Fade — Short Strategy
🔷 What it does:
This is a short-only strategy that fades an extended Heikin Ashi bullish streak, confirmed by a long-window RSI bias filter on the same timeframe. A short entry is opened when the 15-minute Heikin Ashi prints a defined number of consecutive bullish candles AND the smoothed RSI is above a soft-bias threshold — the combination targets exhausted bullish thrusts on BCH that have run far enough to invite a pullback. The exit is a fixed Take Profit OR a fixed Stop Loss; no trailing, no averaging, no second-guessing.
- Single base order, sized at 2.8% of equity by default.
- Dual confirmation entry: RSI(100) on 15m > 46 AND 7 consecutive Heikin Ashi bullish candles on 15m.
- Hard exit pair: TP at −2.1% from average entry, SL at +2.5%.
- Every entry and exit emits a webhook-ready JSON alert payload for direct DCA Bot consumption.
🔷 Who is it for:
- Swing traders looking for systematic short exposure on BCH when local upward thrusts overrun.
- Traders who want a clean, mechanical short setup with no averaging and no discretionary management once in trade.
- Bot operators who want to drive a DCA Bot configured for one-shot short deals via webhook.
- Risk-conscious operators — at default settings the worst-case per-trade loss is ~0.07% of equity (well inside the 5–10% per-trade risk band).
🔷 How does it work:
RSI Bias Filter: A long-window RSI(100) is sampled from the 15-minute timeframe via request.security with lookahead disabled (no repaint). The threshold (default 46) sits just below the midline, so the filter is satisfied during prolonged bullish drift — exactly the regime where fading strength has the highest expectancy. When RSI falls below 46, the bias is considered to have flipped bearish and the strategy stops looking for new shorts.
Heikin Ashi Streak Trigger: A 15-minute Heikin Ashi stream is sampled in parallel, and the strategy counts the number of consecutive same-direction HA candles using ta.barssince. When the bullish streak reaches the configured length (default 7), the trigger is armed. The default Bullish direction defines the fade-the-strength mode; switching to Bearish converts the strategy into a trend-follow short.
Entry: When BOTH conditions are true at host-bar close, a short position is opened at the base order size. The base order is configurable as Market (default) or Limit at the bar's close.
Exit (OCO): Take Profit and Stop Loss are issued as a paired OCO order through strategy.exit. The first level reached closes the position and automatically cancels the other side — no trailing, no partial exits.
🔷 Why it's unique:
- Dual-Signal Confirmation: A smoothed RSI(100) filters the regime bias while Heikin Ashi times the entry. RSI on a 100-bar window changes slowly and Heikin Ashi reacts to the immediate streak, so the two conditions cannot be satisfied by the same short-lived noise — every entry requires alignment of both.
- Fade-or-Follow Switch: A single input flips the HA direction filter between Bullish (fade strength, default) and Bearish (follow trend). The same engine handles two opposing strategy archetypes.
- Bounded Trade Risk: With a single base order and a hard Stop Loss, the maximum loss per trade is exactly base size × SL%. At defaults that is ~7 USDT on 10,000 — structural risk capping without any complex sizing logic.
- DCA Bot Integration: Each event emits a fully-formed JSON alert payload tagged with the action type, so the strategy can drive a DCA Bot configured for one-shot deals directly through TradingView alerts.
🔷 Considerations Before Using the Strategy:
Market & Timeframe: Calibrated and tested on BCHUSDT 15m. The RSI-and-Heikin-Ashi combination is portable to other liquid crypto pairs that respect mean-reversion behavior, but the filter thresholds (RSI level, HA streak length) should be reviewed before redeployment. Live shorting requires a margin or perpetual venue; the spot chart is used here for signal generation and backtesting.
Performance Profile: This is a low-volatility, defensive short. Over the 177-trade backtest the strategy returned +0.88% with a 0.52% maximum equity drawdown — a return-to-DD ratio near 1.7, with a profit factor of 1.169. The value proposition is structural risk capping over a meaningful sample, not aggressive alpha. Size accordingly within a diversified portfolio.
Trending Markets: In strong sustained uptrends, the strategy will continue to fire short entries and will incur stop-outs as price grinds higher. This is by design — the strategy is positioned for ranges and rotations, not breakouts. The RSI(100) > 46 filter limits exposure to confirmed bullish regimes only, which is where fading has an edge; a regime change to a stronger trend will require manual oversight or a wider Stop Loss.
Sample Size & Parameters: The full-period backtest produced 177 closed trades, above the ~100-trade floor for statistical relevance. If a redeployment on another pair produces fewer than ~100 trades, either extend the period or lower the HA streak length to 5, and re-save the relaxed value as the new default so the publication continues to satisfy the "Default Properties match" rule.
Commission & Slippage: Defaults are set to 0.055% commission and 3 ticks slippage, matching the source bot's configured fee rate. Update both inputs to match your exchange's actual fees before relying on the backtest numbers.
Past Performance: Past results do not guarantee future performance. Always demo-test before deploying live capital, and size the strategy as one part of a diversified portfolio.
🔷 STRATEGY PROPERTIES
Symbol: BINANCE:BCHUSDT — strategy is portable to any BCH / USDT pair (live shorting on a margin or perpetual venue).
Timeframe: 15M
Test Period: November 19, 2025 — June 3, 2026 (~6.5 months).
Initial Capital: 10,000 USDT.
Order Size per Trade: 280 USDT (single base order, no averaging).
Max Capital Deployed: 280 USDT per trade (~2.8% of equity).
Worst-Case Loss per Trade: ~7 USDT (~0.07% of equity).
Commission: 0.055% per trade.
Slippage: 3 ticks.
Margin for Short Positions: 100% (leverage 1x).
Indicator Settings: Default Configuration.
Base Order: 280 USDT, Market by default (Limit toggle available).
Take Profit: 2.1% below average entry (no trailing).
Stop Loss: 2.5% above average entry (close trade).
RSI Filter: 15m RSI(100) > 46.
Heikin Ashi Filter: 15m Heikin Ashi, 7 consecutive bullish candles.
Strategy: Short Only.
🔷 STRATEGY RESULTS
⚠️ Remember, past results do not guarantee future performance.
Net Profit: +87.53 USDT (+0.88%)
Max Equity Drawdown: 52.55 USDT (0.52%)
Total Closed Trades: 177
Percent Profitable: 61.02% (108 / 177)
Profit Factor: 1.169
🔷 How to Use It:
🔸 Adjust Settings: Open the strategy inputs and review the Base Order Size, RSI filter (timeframe / length / level), and the Heikin Ashi filter (timeframe / streak length / direction). Defaults are calibrated for BCHUSDT 15m — recalibrate per asset before deploying.
🔸 Results Review: Run a full-period backtest and confirm Max Drawdown stays inside your personal risk band. Validate that the closed-trade count is statistically meaningful (≥ 100 is a reasonable floor). Use realistic commission and slippage for your exchange.
🔸 Create alerts to trigger the DCA Bot: Add one alert on the strategy using "Any alert() function call". Paste the DCA Bot's webhook URL into the alert's Webhook field, and fill the Bot ID, Email Token, and Pair inputs on the script. The strategy will emit JSON payloads for short entry and exit — TP, SL, or manual close — formatted for direct DCA Bot consumption.
🔷 INDICATOR SETTINGS
Base Order Size (USDT): USDT amount opened on the short entry.
Use LIMIT for Base: Toggle between Market (default, more conservative for backtest) and Limit at bar close.
RSI Timeframe / Length / Condition / Level: RSI bias filter applied to the host symbol.
HA Timeframe / Streak / Direction: Heikin Ashi consecutive-candle trigger. Direction defines fade (Bullish) vs follow (Bearish) mode.
Take Profit (%) / Stop Loss (%): Fixed distance exits from average entry.
DCA Bot Webhook: Bot ID, Email Token, and Pair fields injected into every alert payload.
Visualization: Toggle Avg Entry / TP / SL plot lines, fill labels, status table (status, avg entry, TP/SL levels, live RSI and HA streak, entry-armed flag, cumulative realized net profit).
Brand Watermark: Configurable text, position, size, and transparency.
👨🏻💻💭 We hope this tool helps enhance your trading. Your feedback is invaluable, so feel free to share any suggestions for improvements or new features you'd like to see implemented.
__
The information and publications within the 3Commas TradingView account are not meant to be and do not constitute financial, investment, trading, or other types of advice or recommendations supplied or endorsed by 3Commas and any of the parties acting on behalf of 3Commas, including its employees, contractors, ambassadors, etc. 策略

指标

指标

指标

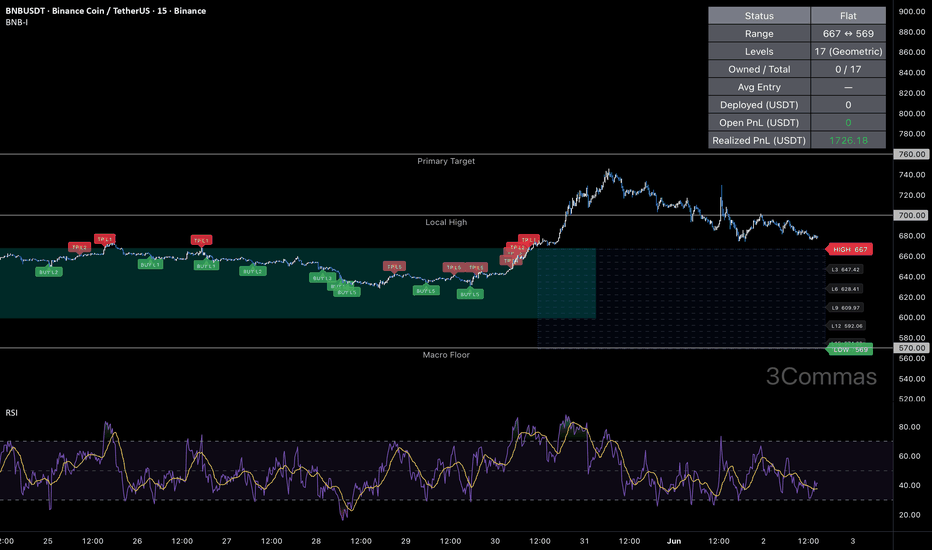
BNB Grid - Long IndicatorBNB Grid — Long Indicator
🔷 What it does:
This is a signal-only indicator that mirrors a price-grid long workflow on BNB / USDT between two fixed bounds. It tracks up to 17 independent virtual slots between a configurable High and Low — each slot fires a webhook-ready buy signal when price crosses down through it, and a paired sell signal when price subsequently crosses up through the slot immediately above. The indicator computes a running average entry, total deployed capital, and open PnL from the live slot ledger and renders all of it on the chart.
- Pre-computes 7–200 grid levels in Geometric (default) or Arithmetic spacing.
- Each slot is an independent ownership flag with its own buy/sell webhook payload.
- Avg entry is derived from fill-by-fill bookkeeping — total cost and total qty are updated on every event.
- Every event emits a webhook-ready JSON alert payload tagged with the specific grid slot.
🔷 Who is it for:
- Swing traders harvesting volatility on BNB in range-bound regimes.
- Bot operators looking for a chart-driven signal source that emits per-slot JSON ready for a DCA Bot configured for grid execution.
- Traders who want to monitor a virtual grid state — avg entry, owned slots, deployed capital, open PnL — directly on the chart without a backtest engine.
- Portfolio operators using a high-trade-count contributor alongside directional strategies.
🔷 How does it work:
Grid Construction: On script load, the indicator computes N price levels between the configured High and Low bounds. In Geometric mode (default), level k is at High × (Low/High)^(k/(N-1)), giving constant percent spacing — approximately 1.0% per step at default settings. In Arithmetic mode, levels are linearly spaced by absolute price.
Per-Slot State Machine: Each grid level is an independent slot tracked by a boolean ownership flag. When close price crosses down through an empty slot's level, the slot is marked owned, virtual cost-basis is added, and the BUY webhook payload is dispatched. When close price crosses up through the level immediately above an owned slot, the slot is marked free, virtual cost-basis is subtracted, and the SELL webhook payload is dispatched.
Honest Virtual Bookkeeping: Total cost and total qty are updated incrementally on each event, so the avg entry, deployed capital, and open PnL displayed in the status table reflect the actual broker-equivalent position state — no shortcuts from base entry, no synthetic averaging. The table also accumulates the realized PnL from every closed slot (the exact round-trip profit between adjacent levels), so it shows how much the grid has actually earned over the chart history.
No Trailing, No Stop Loss: By design, each slot has a fixed exit (the level above). The indicator never trails the exit and never signals a slot-out for a loss — slots that fall below their entry stay owned until price comes back. This is the canonical grid-bot behavior.
🔷 Why it's unique:
- Per-Level Webhook Ledger: Every BUY and SELL emits a fully-formed JSON alert payload tagged with the specific grid slot ("Grid_BUY_L5" / "Grid_TP_L5"). The indicator can drive a DCA Bot configured for grid emulation without any glue layer.
- Fill-by-Fill Avg Entry: The orange avg-entry line is derived from running totals updated on every event — what you see is what the broker-equivalent position would actually have.
- Active Slot Highlighting: Owned grid levels are rendered with a thicker green stroke; empty slots stay dashed gray. Slot density and current loading are visible at a glance.
- Range Box & Bounds Labels: A semi-transparent box spans the configured High/Low range, and crisp HIGH/LOW labels mark the bounds — the grid topology is obvious without zooming.
- Calibrated for BNB 15m: Default bounds, level count, and step size are set against BNB's recent observed range. The 17-level geometric ladder gives roughly 1.0% per step — wide enough to clear perpetual taker fees on each round-trip, granular enough to keep catching 15m swings inside the range.
🔷 Considerations Before Using the Indicator:
Market Selection & Range Validity: Grid strategies are most profitable in range-bound, mean-reverting markets. On strong directional trends below the configured Low, slots will keep marking as owned as price falls and won't free until price reverses. The default High/Low (667 / 569) was set against BNB's recent observed range; update both whenever the regime changes.
Capital Deployment: The default Total Investment of 10,000 USDT is a virtual reference used for the avg-entry and open-PnL computation. The real sizing happens on the bot side — match the indicator's per-slot allocation to your bot's grid configuration to keep the avg-entry display honest.
Cross Detection Granularity: Crossings are detected on bar close, comparing the current close to the previous close. A bar that spikes through a level and returns within the same bar may be missed by design — this prevents over-signaling on intra-bar wicks.
Live vs Historical State: The virtual slot ledger is rebuilt from chart history each time the indicator is recompiled. If the indicator is added mid-deployment or the live bot diverges from the signal stream (manual interventions, partial fills), the indicator state may not match the live bot. Toggle the indicator off and on to reset.
No Stop Loss: There is no exit signal on adverse moves below the lowest grid level. Risk is structurally capped on the bot side by the bounded Total Investment configured at the bot. If a hard stop is required, layer it on the bot side.
Backtesting Note: This is an indicator, not a strategy. There is no built-in P&L tester. For performance metrics over a ~3.8-month sample (330 closed trades, 72.42% win rate, 5.44% max drawdown, profit factor 3.061, +13.16% net return), use the companion strategy version on identical parameters.
🔷 How to Use It:
🔸 Add the indicator to a BNB / USDT 15m chart.
🔸 Set the High and Low bounds to a range you expect BNB to respect.
🔸 Pick Geometric (default, recommended) or Arithmetic spacing.
🔸 Set Grid Levels (7–200) and the virtual Total Investment used for avg-entry computation.
🔸 In the DCA Bot Webhook group, paste your Bot ID, Email Token, and Pair (QUOTE_BASE format, e.g., USDT_BNB).
🔸 Create an alert on the indicator with "Any alert() function call". Paste the DCA Bot's webhook URL into the alert's Webhook field. Every grid-level buy and grid-level close will emit a dedicated JSON payload tagged with the slot index, so each level can be tracked independently downstream.
🔷 INDICATOR SETTINGS
High Price: Top of the grid. The highest level a slot can be created from.
Low Price: Bottom of the grid. The lowest level a slot can be created from.
Grid Levels: Number of price levels between High and Low (default 17, range 7–200).
Spacing Mode: Geometric (constant percent step) or Arithmetic (constant absolute step).
Total Investment (USDT): Virtual capital allocated across all slots. Used for the avg-entry and open-PnL computation only.
Bot ID / Email Token / Pair: Webhook fields injected into every alert payload.
Visualization: Toggle grid lines, range box, HIGH/LOW labels, avg entry plot, fill labels, signal triangles, status table (shows status, range, levels, owned slots, avg entry, deployed capital, open PnL, and cumulative realized PnL).
Brand Watermark: Configurable text, position, size, and transparency.
👨🏻💻💭 We hope this tool helps enhance your trading. Your feedback is invaluable, so feel free to share any suggestions for improvements or new features you'd like to see implemented.
__
The information and publications within the 3Commas TradingView account are not meant to be and do not constitute financial, investment, trading, or other types of advice or recommendations supplied or endorsed by 3Commas and any of the parties acting on behalf of 3Commas, including its employees, contractors, ambassadors, etc. 指标
BNB Grid Bot - Long StrategyBNB Grid Bot — Long Strategy
🔷 What it does:
This is a long-only price-grid strategy that harvests volatility on BNB / USDT through repeated round-trips on a pre-defined ladder of price levels between two fixed bounds. Each level is an independent slot: when price crosses down through a level, the strategy opens one slot; when price subsequently crosses up through the level immediately above, that slot is closed for a fixed round-trip profit. The grid is generated geometrically by default, so spacing adapts to the price scale.
- Up to 17 simultaneous long slots at default settings, each sized as a fixed fraction of the configured Total Investment.
- No trailing exit, no stop loss — each slot's exit is the level above its entry.
- Per-slot exposure is approximately 5.88% of equity at default settings, inside the conventional 5–10% per-trade risk band.
- Every fill and close emits a webhook-ready JSON alert payload tagged with the specific grid slot.
🔷 Who is it for:
- Swing traders harvesting volatility on BNB in range-bound regimes.
- Bot operators looking for a chart-driven signal source with per-slot webhook JSON ready to drive a DCA Bot configured for grid execution.
- Traders running a portfolio of low-correlation strategies who want a high-trade-count contributor with bounded per-trade risk.
- Range traders who prefer mechanical execution over discretionary entries.
🔷 How does it work:
Grid Construction: On script load, the strategy computes N price levels between the configured High and Low bounds. In Geometric mode (default), level k is at High × (Low/High)^(k/(N-1)), giving constant percent spacing — approximately 1.0% per step at default settings. In Arithmetic mode, levels are linearly spaced by absolute price.
Per-Slot Logic: Each grid level is an independent slot tracked by a boolean ownership flag. When bar close moves price down through an empty slot's level, a long is opened at that level for one slot's worth of capital (Investment / N). When bar close moves price up through the level immediately above an owned slot, that slot is closed, locking the round-trip profit between the two adjacent levels.
No Trailing, No Stop Loss: By design, each slot has a fixed exit (the level above). The strategy never trails the exit and never stops a slot out for a loss — slots whose entry price is below current market simply wait until price comes back. This is the canonical grid-bot behavior.
Capital Bounds: Total deployed capital cannot exceed the configured Investment. When all 17 slots are filled, no new orders are opened until price rises and starts closing slots. This structural cap is the strategy's primary risk control.
🔷 Why it's unique:
- Per-Level Webhook Ledger: Every fill and close emits a fully-formed JSON alert payload tagged with the specific grid slot ("Grid_BUY_L5" / "Grid_TP_L5"). The strategy can drive a DCA Bot configured for grid emulation without any glue layer.
- Pre-Allocated State: All up to 200 slot ledgers live in fixed-size arrays, so state lookups are constant-time and the chart can render every active slot with no performance overhead.
- Honest Backtest Surface: The avg entry line plotted on the chart and the open PnL displayed in the status table both reflect the actual broker-equivalent position state — derived from fill-by-fill bookkeeping, not synthetic averaging. The status table also reports the cumulative realized net profit (how much the grid has actually earned, in USDT and % of starting capital), so live performance is visible directly on the chart.
- Calibrated for BNB 15m: Default bounds, level count, and step size are set against BNB's recent observed range. The 17-level geometric ladder gives roughly 1.0% per step — wide enough to clear perpetual taker fees on each round-trip, granular enough to keep catching 15m swings inside the range.
🔷 Considerations Before Using the Strategy:
Market Selection & Range Validity: Grid strategies are most profitable in range-bound, mean-reverting markets. On strong directional trends below the configured Low, slots will keep loading as price falls and won't close until price reverses. The default High/Low (667 / 569) was set against BNB's recent observed range; update both whenever the regime changes.
Capital Deployment & Drawdown: The default Investment of 10,000 USDT equals 100% of starting capital — high-conviction setting that assumes the configured range holds. Per-slot risk remains moderate (~5.88% of equity), but if price collapses below the Low bound, aggregate unrealized loss can grow further. Scale the Investment input down to match the worst-case drawdown you are willing to absorb in a range-break scenario.
No Stop Loss Justification: There is no exit on adverse moves below the lowest grid level. The strategy's per-trade risk is structurally capped by the per-slot allocation (Investment / N levels) — at defaults that is ~588 USDT per slot, inside the conventional 5–10% per-trade band. The aggregate unrealized exposure is controlled separately via the Investment input.
Trade Volume & Fees: Grid bots on 15m generate a high number of round-trips. The ~1.0% step is deliberately wider than a tight scalp grid so each round-trip comfortably clears the perpetual taker fee. The default commission (0.06% per trade) is calibrated for Bybit perpetual taker conditions; any mismatch with your exchange's actual fees will materially shift the results.
Demo Testing: Always demo-test before going live. Past results do not guarantee future performance, especially on a strategy whose profitability is bounded by the chosen High/Low range remaining valid.
🔷 STRATEGY PROPERTIES
Symbol: BYBIT:BNBUSDT.P (Perpetual) — strategy is portable to any BNB / USDT pair.
Timeframe: 15M
Test Period: February 8, 2026 — June 2, 2026 (~3.8 months).
Initial Capital: 10,000 USDT.
Total Investment: 10,000 USDT (100% of capital, high-conviction setting).
Order Size per Slot: Investment / 17 ≈ 588 USDT (~5.88% of equity).
Commission: 0.06% per trade.
Slippage: 3 ticks.
Margin for Long Positions: 100%.
Indicator Settings: Default Configuration.
Grid Bounds: High 667 / Low 569 (range −14.69%).
Grid Levels: 17 (Geometric spacing, ~1.0% per step).
Stop Loss: None — per-slot allocation is the structural risk cap.
Trailing: None.
Strategy: Long Only.
🔷 STRATEGY RESULTS
⚠️ Remember, past results do not guarantee future performance.
Net Profit: +1,316.40 USDT (+13.16%)
Max Equity Drawdown: 583.18 USDT (5.44%)
Total Closed Trades: 330
Percent Profitable: 72.42% (239 / 330)
Profit Factor: 3.061
🔷 How to Use It:
🔸 Adjust Settings: Open the strategy inputs and set the High and Low bounds to a range you expect BNB to respect. Pick Geometric for percent-spaced levels (default, recommended) or Arithmetic. Set Grid Levels (7–200) and Total Investment to match your risk profile.
🔸 Results Review: Run a full-period backtest and confirm Max Drawdown stays within your personal risk band. Validate that the trade count is high enough to be statistically meaningful (≥ 100 closed trades is a reasonable floor — at default settings the strategy typically generates several hundred round-trips per 3-month window on BNB 15m).
🔸 Create alerts to trigger the DCA Bot: Add one alert on the strategy using "Any alert() function call". Paste your DCA Bot's webhook URL into the alert's Webhook field, and fill the Bot ID, Email Token, and Pair inputs on the script. Every grid-level buy and grid-level close will emit a dedicated JSON payload tagged with the slot index, so each level can be tracked independently downstream.
🔷 INDICATOR SETTINGS
High Price: Top of the grid. The highest level a slot can be created from.
Low Price: Bottom of the grid. The lowest level a slot can be created from.
Grid Levels: Number of price levels between High and Low (default 17, range 7–200).
Spacing Mode: Geometric (constant percent step) or Arithmetic (constant absolute step).
Total Investment (USDT): Total capital allocated across all slots. Per-slot size = Investment / Grid Levels.
Bot ID / Email Token / Pair: Webhook fields injected into every alert payload.
Visualization: Toggle grid lines, range box, HIGH/LOW labels, avg entry plot, fill labels, status table (shows range, levels, owned slots, investment, per-slot size, open PnL, and cumulative realized net profit).
Brand Watermark: Configurable text, position, size, and transparency.
👨🏻💻💭 We hope this tool helps enhance your trading. Your feedback is invaluable, so feel free to share any suggestions for improvements or new features you'd like to see implemented.
__
The information and publications within the 3Commas TradingView account are not meant to be and do not constitute financial, investment, trading, or other types of advice or recommendations supplied or endorsed by 3Commas and any of the parties acting on behalf of 3Commas, including its employees, contractors, ambassadors, etc. 策略

Historical P/E Ratio with Average Line**Description:**
This indicator plots a stock's price-to-earnings (P/E) ratio over time and adds an average line. It lets you see at a glance whether a company is currently valued more expensively or more cheaply than its historical norm.
**What the indicator shows**
The blue line shows the historical P/E ratio, calculated as the current price divided by earnings per share. The orange line represents the average — either as an overall average across the entire available history, or as a moving average over an adjustable number of bars. A small info box in the top right summarizes the current P/E value and the average.
**Settings**
The calculation period can be set to TTM (trailing twelve months), fiscal year (FY), or quarter (FQ). The average type can be switched between overall average and moving average, whose length is freely adjustable. An outlier filter hides extreme P/E spikes that occur during periods of very low earnings and would otherwise distort the scale.
**Usage notes**
The indicator only works with stocks that have available fundamental data and is most useful on the daily or weekly chart. During loss periods with negative earnings, the P/E ratio is undefined and is deliberately not displayed. The overall average is calculated across the history loaded in the chart — the more history is visible, the more meaningful the average line becomes.
**Disclaimer**
This indicator is provided for informational and educational purposes only and does not constitute investment advice or a buy/sell recommendation. A P/E ratio above or below its historical average is not a buy or sell signal in itself and should always be considered together with the business model, growth expectations, and industry context. Fundamental data is provided by TradingView; no guarantee is made as to its accuracy or completeness.
---
**Beschreibung:**
Dieser Indikator stellt das Kurs-Gewinn-Verhältnis (KGV) einer Aktie über die Zeit dar und ergänzt es um eine Durchschnittslinie. So lässt sich auf einen Blick erkennen, ob ein Unternehmen aktuell teurer oder günstiger bewertet ist als im historischen Mittel.
**Was der Indikator zeigt**
Die blaue Linie zeigt das historische KGV, berechnet aus dem aktuellen Kurs geteilt durch den Gewinn je Aktie. Die orange Linie stellt den Durchschnitt dar – wahlweise als Gesamtdurchschnitt über die gesamte verfügbare Historie oder als gleitender Durchschnitt über eine einstellbare Anzahl von Bars. Eine kleine Info-Box rechts oben fasst den aktuellen KGV-Wert und den Durchschnitt zusammen.
**Einstellmöglichkeiten**
Berechnungsperiode wählbar zwischen TTM (letzte zwölf Monate), Geschäftsjahr (FY) und Quartal (FQ). Der Durchschnittstyp lässt sich zwischen Gesamtdurchschnitt und gleitendem Durchschnitt umschalten, dessen Länge frei einstellbar ist. Ein Ausreißer-Filter blendet extreme KGV-Spitzen aus, die bei sehr niedrigen Gewinnen entstehen und die Skala sonst verzerren würden.
**Hinweise zur Nutzung**
Der Indikator funktioniert nur bei Aktien mit verfügbaren Fundamentaldaten und ist am sinnvollsten auf dem Tages- oder Wochenchart. In Verlustphasen mit negativem Gewinn ist das KGV nicht definiert und wird bewusst nicht dargestellt. Der Gesamtdurchschnitt wird über die im Chart geladene Historie gebildet – je mehr Historie sichtbar ist, desto aussagekräftiger ist die Durchschnittslinie.
**Wichtiger Hinweis**
Dieser Indikator dient ausschließlich Informations- und Bildungszwecken und stellt keine Anlageberatung oder Kauf-/Verkaufsempfehlung dar. Ein KGV über oder unter dem historischen Durchschnitt ist für sich genommen kein Kauf- oder Verkaufssignal, sondern sollte stets im Zusammenhang mit dem Geschäftsmodell, der Wachstumserwartung und dem Branchenumfeld betrachtet werden. Fundamentaldaten werden von TradingView bereitgestellt; für deren Richtigkeit und Vollständigkeit wird keine Gewähr übernommen.
指标

指标

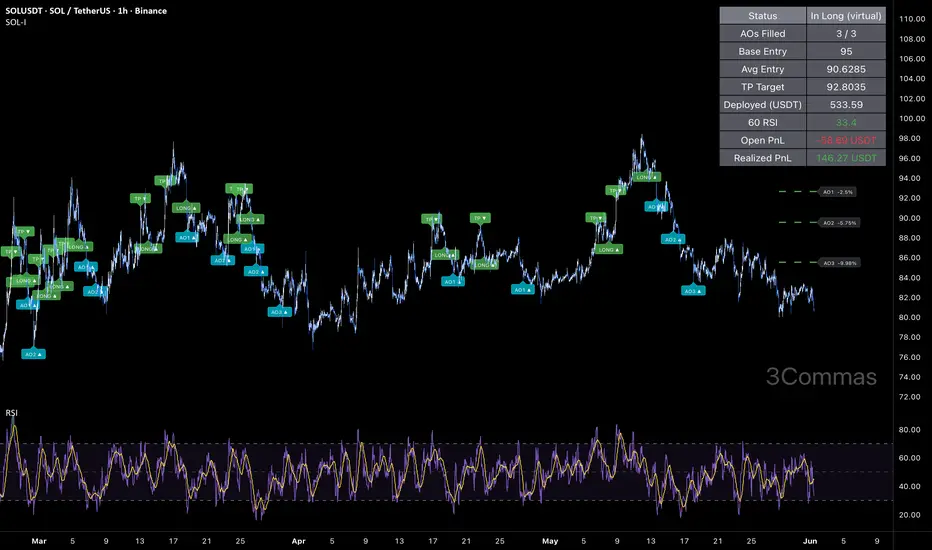
SOL RSI DCA - Long IndicatorSOL RSI DCA - Long Indicator
🔷 What it does:
This is a signal-only indicator that mirrors a long-only DCA workflow on SOL. It tracks one virtual long position at a time, opened while higher-timeframe momentum is depressed, then averages the position down on a measured geometric price-deviation ladder with up to three averaging orders. The base entry arms whenever the 1-hour RSI(14) sits below a configurable level (default 44). Averaging is price-driven only — no extra momentum gate — matching the source bot configuration. Exit is a fixed Take Profit at 2.4% above average entry. Every event emits a webhook-ready JSON payload for a DCA Bot.
- HTF RSI entry gate: base order arms while 1h RSI(14) is below the threshold (Less Than condition).
- Geometric averaging ladder: deviations −2.50%, −5.75%, −9.98%; sizes 87.5, 109.4, 136.7 USDT on a 1.3× deviation step × 1.25× size step.
- Fixed Take Profit: 2.4% above running average entry, no trailing.
- Honest virtual bookkeeping: total cost and qty updated incrementally on every fill — avg entry, deployed capital, open PnL, and cumulative realized PnL displayed live.
- Five discrete events per cycle (entry + 3 AO fills + TP), each with its own webhook payload.
🔷 Who is it for:
- Swing traders running a DCA Bot on SOL who want systematic long exposure when momentum is soft, scaling in if the dip deepens.
- Bot operators who want a chart-driven signal source that emits per-event JSON ready for a DCA Bot.
- DCA-style traders who prefer a measured geometric ladder over an aggressive doubling schedule.
- Traders who want to monitor an evolving DCA position — base entry, owned AO levels, deployed capital, open PnL, realized PnL, live RSI reading — directly on the chart without the strategy-tester overhead.
🔷 How does it work:
Entry RSI Filter (HTF Oversold): A 1-hour RSI(14) is sampled via request.security with lookahead disabled (no repaint). The base order arms whenever this RSI is below the configured level (default 44). At host-bar close, if the indicator is flat, the virtual long position opens.
Averaging Order Ladder (Price-Driven): After the base fill, the indicator watches price deviation against the position. The k-th averaging order fires when close ≤ base entry × (1 − cumulative deviation). Cumulative deviation grows by the 1.3× step multiplier: 2.50%, 5.75%, 9.98%. Each averaging order's virtual size grows by the 1.25× size multiplier: 87.5, 109.4, 136.7 USDT. Averaging is gated by price only — no extra RSI condition, matching the source bot configuration.
Honest Virtual Bookkeeping: Total cost and qty are updated incrementally on every fill, so the avg entry, deployed capital, open PnL, and cumulative realized PnL displayed in the status table reflect the actual broker-equivalent position state — no shortcut from base entry, no synthetic averaging.
Exit: A fixed Take Profit at 2.4% above the running average entry. When close hits the TP target, the close webhook fires, the realized PnL accumulator banks the gain, and the virtual position resets.
🔷 Why it's unique:
- HTF RSI Entry Gate: The base order keys off a 1-hour RSI(14) rather than the chart timeframe, so entries are anchored to the higher-timeframe momentum picture instead of intrabar noise.
- Measured Geometric Ladder: A 1.3× deviation step paired with a 1.25× size step keeps the average entry compounding controlled — the position deepens gradually rather than ballooning, which keeps maximum deployment near 5% of equity.
- Fill-by-Fill Avg Entry: The orange avg-entry line is derived from running totals updated on every event — what you see is what the broker-equivalent position would actually have.
- Realized PnL Readout: The status table shows cumulative realized PnL banked across closed cycles, so the chart reflects how the workflow has performed over the visible history, not just the open position.
- Per-Event Webhook Ledger: Five distinct events per cycle, each with its own JSON alert payload. The indicator drives a DCA Bot end-to-end through a single TradingView alert.
🔷 Considerations Before Using the Indicator:
Market & Timeframe: Designed for liquid crypto pairs. Default thresholds are calibrated for BINANCE:SOLUSDT spot, with the RSI filter on 1h. Run on a 1h chart (or lower for finer averaging-order fills). Different pairs may need RSI level and deviation ladder tuning.
Entry Is a Level, Not a Cross: The base order uses a Less Than condition (RSI < 44), matching the source bot. After a Take Profit, if RSI is still below 44 the indicator can immediately reopen a new virtual deal. This produces more frequent re-entries than a cross-down trigger — intended behavior, but review it against your risk appetite.
Cross Detection Granularity: Entries and AO fills are evaluated on bar close. A bar that spikes through a level and returns within the same bar may be missed by design — this matches realistic polling behavior and avoids over-signaling on intra-bar wicks.
Live vs Historical State: The virtual position state is rebuilt from chart history each time the indicator is recompiled. If the indicator is added mid-deployment or the live bot diverges from the signal stream (manual interventions, partial fills), the indicator state may not match the live bot. Toggle the indicator off and on to reset.
Capital Deployment: If all three averaging orders fill, the virtual position scales from 200 USDT base to ~534 USDT total. Match the indicator's per-order allocation to your bot's configuration to keep the avg-entry display honest.
No Stop Loss: There is no exit signal on adverse moves beyond the 3-AO ladder. Risk is structurally capped on the bot side by the bounded position-size ladder. If a hard exchange-side stop is required, configure it on the bot directly.
Strong Downtrends: Like any dip-buying setup, this is positioned for mean reversions, not waterfall declines. In a sustained downtrend the ladder fills out and the position holds underwater until price recovers to the 2.4% TP above average. The bounded ladder limits the size of that exposure, but underwater hold time can still extend.
Backtesting Note: This is an indicator, not a strategy. There is no built-in P&L tester. For performance metrics over a ~3.5-month sample (29 closed trades, 86.21% win rate, 0.63% max drawdown, profit factor 22.256, +0.83% net return), use the companion strategy version on identical parameters. The 29-trade sample is well below the typical ≥100 floor for statistical confidence, and the high-win/low-frequency profile rests on a fixed 2.4% TP being hit most of the time — re-run on a 12+ month window for a more robust validation before drawing firm conclusions.
🔷 How to Use It:
🔸 Add the indicator to a 1h chart on the crypto pair you want to trade.
🔸 Review the entry RSI filter (timeframe / length / level), the 3-AO ladder parameters, and the Take Profit percentage. Defaults are calibrated for SOLUSDT 1h — recalibrate per asset before deploying.
🔸 Set Base Order Size and AO sizes to match your bot's configuration (the indicator's avg-entry display becomes meaningful when virtual sizing matches real sizing).
🔸 In the DCA Bot Webhook group, paste the Bot ID, Email Token, and Pair (QUOTE_BASE format, e.g., USDT_SOL).
🔸 Create an alert on the indicator with "Any alert() function call". Paste the DCA Bot's webhook URL into the alert's Webhook field. The indicator will emit JSON payloads for entry, each averaging order, and TP exit — formatted for direct DCA Bot consumption.
🔷 INDICATOR SETTINGS
Base Order Size (USDT): Virtual order size for the avg-entry / open-PnL computation.
Averaging Orders per Trade: Maximum number of averaging orders per cycle (default 3).
First AO Size (USDT): Virtual size of the first averaging order; subsequent AOs scale by the Size Multiplier.
Deviation to First AO (%): Distance from base entry at which AO1 becomes eligible.
Deviation Step Multiplier: Ladder factor that widens each subsequent deviation step.
Order Size Multiplier: Factor that grows each subsequent averaging order's USDT size.
Entry RSI Timeframe / Length / Level: Higher-timeframe RSI filter that arms the base entry (Less Than condition).
Take Profit (%): Fixed distance above the running average entry where the virtual long closes.
DCA Bot Webhook: Bot ID, Email Token, and Pair fields injected into every alert payload.
Visualization: Toggle AO Ladder, Avg / TP plot lines, fill labels, signal triangles, status table (including cumulative realized PnL).
Brand Watermark: Configurable text, position, size, and transparency.
👨🏻💻💭 We hope this tool helps enhance your trading. Your feedback is invaluable, so feel free to share any suggestions for improvements or new features you'd like to see implemented.
__
The information and publications within the 3Commas TradingView account are not meant to be and do not constitute financial, investment, trading, or other types of advice or recommendations supplied or endorsed by 3Commas and any of the parties acting on behalf of 3Commas, including its employees, contractors, ambassadors, etc. 指标

SOL RSI DCA - Long StrategySOL RSI DCA - Long Strategy
🔷 What it does:
This is a long-only DCA strategy that opens a base long while SOL's higher-timeframe momentum is depressed, then averages down on a geometric price-deviation ladder if the dip extends. A long entry arms whenever the 1-hour RSI(14) sits below a configurable level (default 44). Up to three averaging orders ladder the position deeper on widening deviation steps and growing order sizes. Exit is a fixed Take Profit from the running average entry. No trailing, no Stop Loss.
- Single base order with up to three averaging orders on a geometric deviation × geometric size ladder.
- HTF RSI entry gate: base order arms while 1h RSI(14) is below the threshold (Less Than condition).
- Deviation ladder grows by a 1.3× step multiplier; order sizes grow by a 1.25× size multiplier.
- Fixed Take Profit: 2.4% above average entry, no trailing.
- Every entry, averaging order, and exit emits a webhook-ready JSON alert payload for direct DCA Bot consumption.
🔷 Who is it for:
- Swing traders who want systematic long exposure on SOL when momentum is soft, scaling in if the dip deepens.
- DCA-style traders who prefer a measured geometric ladder over an aggressive doubling schedule.
- Bot operators who want to drive a DCA Bot via webhook with per-event JSON payloads tagged for each base / averaging order / exit action.
- Range and mean-reversion traders comfortable with a moderate per-trade capital footprint (~5% of equity at default settings).
🔷 How does it work:
Entry RSI Filter (HTF Oversold): A 1-hour RSI(14) is sampled via request.security with lookahead disabled (no repaint). The base order arms whenever this RSI is below the configured level (default 44). At host-bar close, if no position is open, the strategy opens the base order at market.
Base Order: Sized at 200 USDT default (2% of 10k capital). Configurable as Market (default) or Limit at the bar's close.
Averaging Order Ladder (Price-Driven): After the base fill, the strategy watches price deviation against the position. The k-th averaging order fires when close ≤ base entry × (1 − cumulative deviation). Cumulative deviation grows by the 1.3× step multiplier: 2.50%, 5.75%, 9.98%. Each averaging order's size grows by the 1.25× size multiplier: 87.5, 109.4, 136.7 USDT. Averaging is gated by price only — no extra RSI condition, matching the source bot configuration.
Exit: A fixed Take Profit at 2.4% above the running average entry. The strategy closes the moment close ≥ TP target. No trailing, no scaling out.
🔷 Why it's unique:
- HTF RSI Entry Gate: The base order keys off a 1-hour RSI(14) rather than the chart timeframe, so entries are anchored to the higher-timeframe momentum picture instead of intrabar noise.
- Measured Geometric Ladder: A 1.3× deviation step paired with a 1.25× size step keeps the average entry compounding controlled — the position deepens gradually rather than ballooning, which keeps maximum deployment near 5% of equity.
- Honest Position Bookkeeping: The avg-entry line, TP line, and status table all reflect the actual broker-equivalent position state derived from fill-by-fill order tracking — no synthetic averaging.
- DCA Bot Integration: Every event (base, AO 1–3, exit) emits a fully-formed JSON alert payload. Connect one alert to a DCA Bot's webhook URL and the strategy drives the bot end-to-end without any glue layer.
🔷 Considerations Before Using the Strategy:
Market & Timeframe: Defaults are calibrated for BINANCE:SOLUSDT spot, with the RSI filter on 1h. Run the strategy on a 1h chart (or lower for finer averaging-order fills). The logic is portable to other liquid pairs, but the RSI level and the deviation ladder should be reviewed before redeployment.
Entry Is a Level, Not a Cross: The base order uses a Less Than condition (RSI < 44), matching the source bot. This means after a Take Profit, if RSI is still below 44 the strategy can immediately reopen a new deal. This produces more frequent re-entries than a cross-down trigger — intended behavior, but review it against your risk appetite.
Capital Deployment: If all three averaging orders fill, the position scales from 200 USDT base to ~534 USDT total ≈ 5.3% of equity at default settings — comfortably inside TradingView's 5–10% per-trade band. Scale base + AO sizes down to dial position risk lower.
No Stop Loss Justification: There is no exit on adverse moves beyond the 3-AO ladder. Per-trade risk is structurally capped by the bounded position-size ladder — at defaults that is ~534 USDT max deployed ≈ 5.3% of equity, well inside the conventional 5–10% per-trade band. If a hard exchange-side stop is required, layer it on the bot directly.
Strong Downtrends: Like any dip-buying setup, this strategy is positioned for mean reversions, not waterfall declines. In a sustained downtrend the ladder fills out and the position holds underwater until price recovers to the 2.4% TP above average. The bounded ladder limits the size of that exposure, but underwater hold time can still extend.
Commission Calibration: The default 0.1% commission matches Binance spot taker conditions. Update the commission input to match your fee tier for accurate forward expectations.
Sample Size: The ~3.5-month backtest produced 29 closed trades — below the ≥100 floor typically used for statistical confidence. The 86.21% win rate and the very high 22.256 profit factor are encouraging but rest on a small sample and a high-win/low-frequency profile (a fixed 2.4% TP that is hit most of the time). Extend the test window to 12+ months and re-validate before drawing firm conclusions or deploying live.
Demo Testing: Always demo-test before going live. Past results do not guarantee future performance.
🔷 STRATEGY PROPERTIES
Symbol: BINANCE:SOLUSDT (Spot)
Timeframe: 1H (recommended; RSI filter sampled on 1h).
Test Period: February 16, 2026 — June 1, 2026 (~3.5 months).
Initial Capital: 10,000 USDT.
Order Size per Trade: 2% of Capital base + 3 averaging orders on a 1.25× size ladder.
Max Capital Deployed: ~534 USDT per trade (~5.3% of equity).
Commission: 0.1% per trade.
Slippage: 3 ticks.
Margin for Long Positions: 100%.
Indicator Settings: Default Configuration.
Base Order: 200 USDT, Market by default (Limit toggle available).
Take Profit: 2.4% above average entry (no trailing).
Stop Loss: None — bounded position size is the structural risk cap.
Entry Filter: 1h RSI(14) Less Than 44.
Averaging Orders: 3, Deviation 2.5%, Deviation Step 1.3×, Size Multiplier 1.25× (cumulative −2.5% / −5.75% / −9.98%).
Strategy: Long Only.
🔷 STRATEGY RESULTS
⚠️ Remember, past results do not guarantee future performance.
Net Profit: +82.90 USDT (+0.83%)
Max Equity Drawdown: 63.27 USDT (0.63%)
Total Closed Trades: 29
Percent Profitable: 86.21% (25 / 29)
Profit Factor: 22.256
🔷 How to Use It:
🔸 Adjust Settings: Open the strategy inputs and review the Base Order Size, the entry RSI filter (timeframe / length / level), the 3-AO ladder parameters, and the Take Profit percentage. Defaults are calibrated for SOLUSDT on 1h — recalibrate per asset before deploying.
🔸 Results Review: Run a full-period backtest and confirm Max Drawdown stays inside your personal risk band. Validate that the closed-trade count is statistically meaningful (≥ 100 is a reasonable floor; extend the test window if needed). Update commission and slippage to match your exchange's actual conditions.
🔸 Create alerts to trigger the DCA Bot: Add one alert on the strategy using "Any alert() function call". Paste the DCA Bot's webhook URL into the alert's Webhook field, and fill the Bot ID, Email Token, and Pair inputs on the script. The strategy will emit JSON payloads for entry, each averaging order, and exit — formatted for direct DCA Bot consumption.
🔷 INDICATOR SETTINGS
Base Order Size (USDT): USDT amount opened on the long entry.
Use LIMIT for Base: Toggle between Market (default) and Limit at bar close.
Averaging Orders per Trade: Maximum number of averaging orders per deal (default 3).
First AO Size (USDT): USDT size of the first averaging order; subsequent AOs scale by the Size Multiplier.
Deviation to First AO (%): Distance from base entry at which AO1 becomes eligible.
Deviation Step Multiplier: Ladder factor that widens each subsequent deviation step.
Order Size Multiplier: Factor that grows each subsequent averaging order's USDT size.
Entry RSI Timeframe / Length / Level: Higher-timeframe RSI filter that arms the base entry (Less Than condition).
Take Profit (%): Fixed distance above average entry where the long closes for profit.
DCA Bot Webhook: Bot ID, Email Token, and Pair fields injected into every alert payload.
Visualization: Toggle AO Ladder, Avg / TP plot lines, fill labels, status table.
Brand Watermark: Configurable text, position, size, and transparency.
👨🏻💻💭 We hope this tool helps enhance your trading. Your feedback is invaluable, so feel free to share any suggestions for improvements or new features you'd like to see implemented.
__
The information and publications within the 3Commas TradingView account are not meant to be and do not constitute financial, investment, trading, or other types of advice or recommendations supplied or endorsed by 3Commas and any of the parties acting on behalf of 3Commas, including its employees, contractors, ambassadors, etc. 策略

指标

指标
指标
指标

指标

ETH Grid - Long IndicatorETH Grid — Long Indicator
🔷 What it does:
This is a signal-only indicator that mirrors a price-grid long workflow on ETH / USDT between two fixed bounds. It tracks up to 23 independent virtual slots between a configurable High and Low — each slot fires a webhook-ready buy signal when price crosses down through it, and a paired sell signal when price subsequently crosses up through the slot immediately above. The indicator computes a running average entry, total deployed capital, and open PnL from the live slot ledger and renders all of it on the chart.
- Pre-computes 7–200 grid levels in Geometric (default) or Arithmetic spacing.
- Each slot is an independent ownership flag with its own buy/sell webhook payload.
- Avg entry is derived from fill-by-fill bookkeeping — total cost and total qty are updated on every event.
- Every event emits a webhook-ready JSON alert payload tagged with the specific grid slot.
🔷 Who is it for:
- Swing traders harvesting volatility on ETH in range-bound regimes.
- Bot operators looking for a chart-driven signal source that emits per-slot JSON ready for a DCA Bot configured for grid execution.
- Traders who want to monitor a virtual grid state — avg entry, owned slots, deployed capital, open PnL — directly on the chart without a backtest engine.
- Portfolio operators using a high-trade-count contributor alongside directional strategies.
🔷 How does it work:
Grid Construction: On script load, the indicator computes N price levels between the configured High and Low bounds. In Geometric mode (default), level k is at High × (Low/High)^(k/(N-1)), giving constant percent spacing — approximately 1.0% per step at default settings. In Arithmetic mode, levels are linearly spaced by absolute price.
Per-Slot State Machine: Each grid level is an independent slot tracked by a boolean ownership flag. When close price crosses down through an empty slot's level, the slot is marked owned, virtual cost-basis is added, and the BUY webhook payload is dispatched. When close price crosses up through the level immediately above an owned slot, the slot is marked free, virtual cost-basis is subtracted, and the SELL webhook payload is dispatched.
Honest Virtual Bookkeeping: Total cost and total qty are updated incrementally on each event, so the avg entry, deployed capital, and open PnL displayed in the status table reflect the actual broker-equivalent position state — no shortcuts from base entry, no synthetic averaging. The table also accumulates the realized PnL from every closed slot (the exact round-trip profit between adjacent levels), so it shows how much the grid has actually earned over the chart history.
No Trailing, No Stop Loss: By design, each slot has a fixed exit (the level above). The indicator never trails the exit and never signals a slot-out for a loss — slots that fall below their entry stay owned until price comes back. This is the canonical grid-bot behavior.
🔷 Why it's unique:
- Per-Level Webhook Ledger: Every BUY and SELL emits a fully-formed JSON alert payload tagged with the specific grid slot ("Grid_BUY_L5" / "Grid_TP_L5"). The indicator can drive a DCA Bot configured for grid emulation without any glue layer.
- Fill-by-Fill Avg Entry: The orange avg-entry line is derived from running totals updated on every event — what you see is what the broker-equivalent position would actually have.
- Active Slot Highlighting: Owned grid levels are rendered with a thicker green stroke; empty slots stay dashed gray. Slot density and current loading are visible at a glance.
- Range Box & Bounds Labels: A semi-transparent box spans the configured High/Low range, and crisp HIGH/LOW labels mark the bounds — the grid topology is obvious without zooming.
- Calibrated for ETH 15m: Default bounds, level count, and step size are set against ETH's recent observed range. The 23-level geometric ladder gives roughly 1.0% per step — wide enough to clear perpetual taker fees on each round-trip, granular enough to keep catching 15m swings inside the range.
🔷 Considerations Before Using the Indicator:
Market Selection & Range Validity: Grid strategies are most profitable in range-bound, mean-reverting markets. On strong directional trends below the configured Low, slots will keep marking as owned as price falls and won't free until price reverses. The default High/Low (2165 / 1734) was set against ETH's recent observed range; update both whenever the regime changes.
Capital Deployment: The default Total Investment of 10,000 USDT is a virtual reference used for the avg-entry and open-PnL computation. The real sizing happens on the bot side — match the indicator's per-slot allocation to your bot's grid configuration to keep the avg-entry display honest.
Cross Detection Granularity: Crossings are detected on bar close, comparing the current close to the previous close. A bar that spikes through a level and returns within the same bar may be missed by design — this prevents over-signaling on intra-bar wicks.
Live vs Historical State: The virtual slot ledger is rebuilt from chart history each time the indicator is recompiled. If the indicator is added mid-deployment or the live bot diverges from the signal stream (manual interventions, partial fills), the indicator state may not match the live bot. Toggle the indicator off and on to reset.
No Stop Loss: There is no exit signal on adverse moves below the lowest grid level. Risk is structurally capped on the bot side by the bounded Total Investment configured at the bot. If a hard stop is required, layer it on the bot side.
Backtesting Note: This is an indicator, not a strategy. There is no built-in P&L tester. For performance metrics over a ~3.8-month sample (355 closed trades, 67.32% win rate, 4.08% max drawdown, profit factor 2.433, +11.34% net return), use the companion strategy version on identical parameters.
🔷 How to Use It:
🔸 Add the indicator to a ETH / USDT 15m chart.
🔸 Set the High and Low bounds to a range you expect ETH to respect.
🔸 Pick Geometric (default, recommended) or Arithmetic spacing.
🔸 Set Grid Levels (7–200) and the virtual Total Investment used for avg-entry computation.
🔸 In the DCA Bot Webhook group, paste your Bot ID, Email Token, and Pair (QUOTE_BASE format, e.g., USDT_ETH).
🔸 Create an alert on the indicator with "Any alert() function call". Paste the DCA Bot's webhook URL into the alert's Webhook field. Every grid-level buy and grid-level close will emit a dedicated JSON payload tagged with the slot index, so each level can be tracked independently downstream.
🔷 INDICATOR SETTINGS
High Price: Top of the grid. The highest level a slot can be created from.
Low Price: Bottom of the grid. The lowest level a slot can be created from.
Grid Levels: Number of price levels between High and Low (default 23, range 7–200).
Spacing Mode: Geometric (constant percent step) or Arithmetic (constant absolute step).
Total Investment (USDT): Virtual capital allocated across all slots. Used for the avg-entry and open-PnL computation only.
Bot ID / Email Token / Pair: Webhook fields injected into every alert payload.
Visualization: Toggle grid lines, range box, HIGH/LOW labels, avg entry plot, fill labels, signal triangles, status table (shows status, range, levels, owned slots, avg entry, deployed capital, open PnL, and cumulative realized PnL).
Brand Watermark: Configurable text, position, size, and transparency.
👨🏻💻💭 We hope this tool helps enhance your trading. Your feedback is invaluable, so feel free to share any suggestions for improvements or new features you'd like to see implemented.
__
The information and publications within the 3Commas TradingView account are not meant to be and do not constitute financial, investment, trading, or other types of advice or recommendations supplied or endorsed by 3Commas and any of the parties acting on behalf of 3Commas, including its employees, contractors, ambassadors, etc. 指标

指标

IMFI Momentum Investor ProIMFI Momentum Investor Pro is a medium-term momentum investing indicator designed for 3–12 month investors. It combines trend strength (EMA 20/50/200), volume participation, RSI momentum, and relative strength versus Nifty into a single actionable framework. The indicator identifies Buy, Accumulate, Hold, Reduce, and Sell opportunities while filtering out short-term market noise. It also highlights unusual events such as a 15% price decline within two trading sessions and tracks weekly/monthly price performance along with volume momentum. The dashboard provides a quick view of trend quality, momentum, risk signals, and institutional accumulation strength. 指标