指标
基本面分析

Path-Based Session Volume Profile [CLEVER]📌 Overview
Path-Based Session Volume Profile is a session-focused analytical tool designed to visualize how trading volume is distributed across price levels within a defined market session. Unlike simplified allocation models that assign an entire candle’s volume to a single closing price or midpoint, this script incorporates the intrabar price path (Open–High–Low–Close behavior) to distribute volume across multiple price segments inside each bar.
The objective of this approach is not to gene
指标

Financial fundamentalsThis indicator helps you understand the basic financial fundamentals of the company. It displays price to earning ratio, price to book ratio, market capitalisation, net income, revenue, net income and EPS growth, year on year and then quarter on quarter, followed by three years CAGR, growth of revenue, net income and debt. And if you think that these numbers can be manipulated, then it also shows free cash flow to net income ratio. So basically, it covers everything financiallythat is needed for
指标

AI Smart Assistant UI Toolkit [Yosiet] AI Smart Assistant UI Toolkit
Most TradingView indicators provide data, but few provide a User Experience . This script is not just a market scanne, it is a fully modular UI Framework designed to help Pine Script developers build interactive, "talking" AI interfaces within their indicators.
The AI Smart Assistant Framework moves away from static labels and moves toward dynamic, state-driven communication.
Key Framework Features
+ State-Driven Typewriter Engine: Includes a logic-gate syste
指标

TORINVEST - Macro Technical ⚙️ COMMENT UTILISER TON INDICATEUR
🧭 1. LIRE LE RÉGIME (BASE)
➡️ Regime score
+0.25 → 🟢 RISK ON
< -0.25 → 🔴 RISK OFF
entre → 🟠 NEUTRE
👉 C’est ton point de départ, pas ton signal
⚖️ 2. IDENTIFIER QUI DOMINE
🟢 Risk On
Actions / BTC / Cuivre / Crédit
➡️ Appétit pour le risque
🔴 Risk Off
Dollar / Or / CHF / JPY
➡️ Peur / refuge
👉 Lecture clé :
Risk On > Risk Off → marché offensif
Risk Off > Risk On → marché défensif
Les deux forts → marché instable / piège
🧠 3. VALIDER LE CONTEXTE
🇺🇸 Macro U
指标

RHODL Z-Score [TheSnake3Run]The original RHODL Ratio, created by Philip Swift, is an on-chain metric that compares the cost basis of coins last moved in the past week against the cost basis of coins last moved 1–2 years ago, weighted by total market age. It identifies macro cycle tops and bottoms in Bitcoin. The true metric requires UTXO-level realized-cap data not available inside Pine Script, so this indicator approximates the dynamic using price alone and standardises the output as a z-score.
How the calculation works
指标

EvolveX Weinstein Stages v2Stan Weinstein stage analysis
Using Stage Analysis, it becomes clear that stocks typically go through four distinct stages in their lifecycle:
Stage One (Base)
Stage Two (Advancing)
Stage Three (Distribution)
Stage Four (Declining)
指标

Diagonales Exactas Futuro + Ruptura (Manual Price)diagonales especificadas por tiempo de 1 hora, media hora, 15 minutos, 5 minutos, 1 dia, 1 semana. Soportes y resistencias.
指标

WatermarkWatermark
A simple, clean watermark indicator designed to keep your trading mindset front and center while you work. Displays two fully customizable lines of text directly on your chart background — perfect for affirmations, rules, or reminders that keep you disciplined during a session.
Features:
Two editable text lines
Full color picker for text
Adjustable fade
Five text size options
Clean status line (no clutter)
How to Use:
Add the indicator to your chart, then click the Settings gear
指标

DXY vs GOLD Equilibrium OscillatorThis script builds a relative-value oscillator between:
DXY = US Dollar Index
Gold = XAUUSD
Since Gold and DXY often move inversely, the script tries to measure whether:
Gold is acting too strong relative to DXY
Gold is acting too weak relative to DXY
Or both are in a more balanced “equilibrium”
It does not predict price by itself.
It is a context / bias tool.
Think of it like this:
If Gold is much stronger than where DXY suggests it “should” be, the oscillator rises
If Gold is much weaker
指标

Key Levels & SessionsThis is a professional-grade institutional key levels indicator designed for day traders who focus on session liquidity and high-volume price levels. The script provides a comprehensive view of the trading day by marking critical boundaries and institutional reference points, all strictly synchronized to the **America/New_York** (EST) timezone.
### **Key Features:**
#### **1. Institutional Daily Levels**
* **Previous Day High (PDH) & Low (PDL):** Marked with solid purple lines, these represe
指标

ATR % Multiple From MAATR % Multiple From MA OF YOUR CHOICE. Gives you the ATR% multiple from your chosen EMA
指标
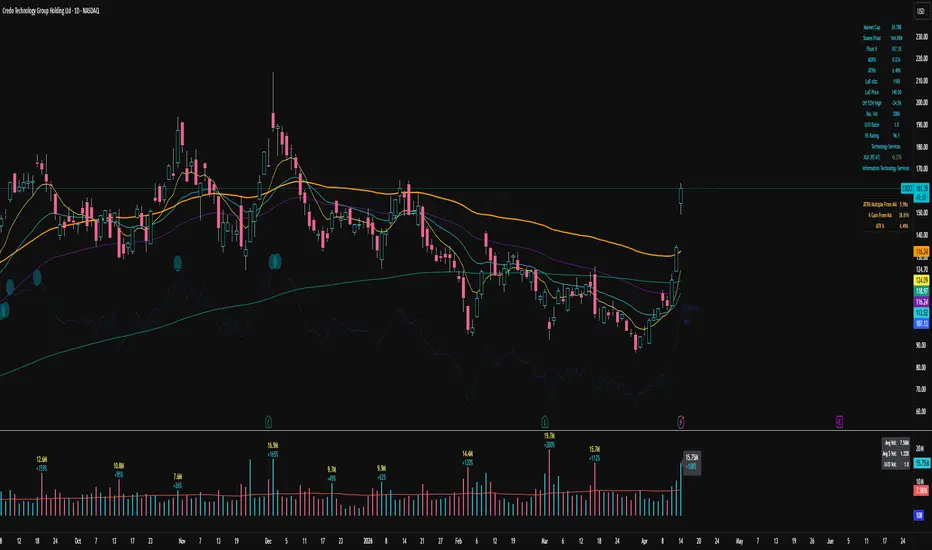
MTF Candle Bias TableMTF Candle Bias Table
Brought to my attention by Max Algo — credit and appreciation to them for sharing this.
A clean, at-a-glance multi-timeframe dashboard that tells you where price is biased across up to 7 timeframes simultaneously — no more flipping between charts.
What it shows:
For each timeframe you choose, the table displays:
Candle — whether the current candle is bullish or bearish (close vs. open)
Bias — directional bias based on whether price has breached the prior bar's high or low
指标

anh Manh dep trai
test
test
test
test
test
test
test
test
test
test
test
test
test
test
test
test
test
策略

Liquidity Acceptance Map [PhenLabs]📊 Liquidity Acceptance Map
v1.0 — Equal high/low sweeps graded by a volume + ATR acceptance score — only the highest-conviction zones plotted
📌 OVERVIEW
Liquidity Acceptance Map (LAM) identifies high-probability liquidity zones by combining three layers of confirmation: equal high/low detection (liquidity pool location), sweep event confirmation (price takes out the level), and a graded Acceptance Score (0–100) that measures how convincingly the market accepted the new price range
指标

Cost Basis + Cipher Filtered Signal v3Cost Basis + Cipher Filtered Signal is a multi-layer market regime indicator built around a macro stress thesis that monitors two simultaneous compression cycles — a private credit and commercial real estate bubble deflating at the macro level, and a crypto speculative cycle correcting from its 2025 peak — using ETH SOPR (Spent Output Profit Ratio) from Glassnode as the primary on-chain regime signal, combined with RSI, dual EMA trend alignment (50/200), Bollinger Band squeeze detection, a fundi
指标

指标

Dual Regime Confluence Monitor Macro Credit and Crypto CycleThe Dual Regime Confluence Monitor — Macro Credit & Crypto Cycle concept refers to the dual compression happening simultaneously:
The macro credit bubble (private credit/CRE) deflating and threatening broader liquidity
The crypto speculative bubble from 2025 ATHs deflating through the current drawdown
Both are deflating at the same time, creating the bearish regime. But the thesis also holds that when the crypto bubble fully flushes, it sets up the next expansion — which is the bullish side of
指标

Volume Profile Sniper ► Overview
The Volume Profile is a staple tool for order flow and support/resistance traders, but manually monitoring price action around key volume nodes can be tedious. The Volume Profile Sniper (VP Sniper) is designed to bridge the gap between passive level-drawing and active execution. It calculates a dynamic Volume Profile and introduces a unique Proximity Radar System that alerts you exactly when the price enters a micro-zone around key liquidity levels.
► What Makes This Script Original?
指标
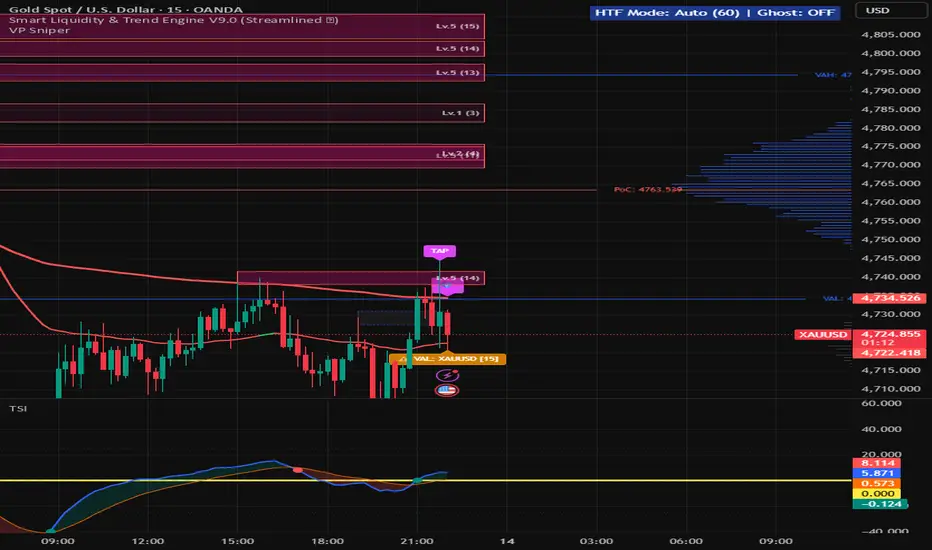
Smart Liquidity & Trend Engine V9.0Overview
The Smart Liquidity & Trend Engine is a systematic trading tool designed to dynamically identify high-probability reversal and continuation zones. Instead of relying on static support/resistance levels or traditional pivot points, this script utilizes a custom Weighted Multi-Timeframe Fractal Clustering Algorithm combined with momentum-based execution triggers. It is explicitly engineered for day traders and scalpers (particularly on XAUUSD and Forex pairs) who look for institutional li
指标
指标

Pullback Sweep - Choppiness FilterPullback Sweep Indicator - User Guide
Identifies pullback entry points in trending markets. Waits for price to pull back against the trend, then enters when price "sweeps" through the pullback start - confirming trend resumption.
________________________________________
Best Settings (1H Chart)
• EMA Length: 50
• Min Pullback Bars: 2
• Max Duration: 24 (1 day)
• Risk:Reward: 2.0 (1:2)
• ADX Threshold: 25
________________________________________
🎨 Color Guide
Color What It Shows
🔵 Blue Line EMA -
指标

Average Session RangeAverage Session Range
This indicator calculates and displays the average true range of the three major trading sessions (Tokyo, London, and New York) over a user-defined number of past sessions. It also shows the current session's range in real-time, helping traders quickly assess volatility expectations for the active session.
Key Features:
Three Major Sessions: Automatically detects and tracks Tokyo, London, and New York sessions
Flexible Session Handling: Choose between UTC (Auto DST) mode f
指标

指标
