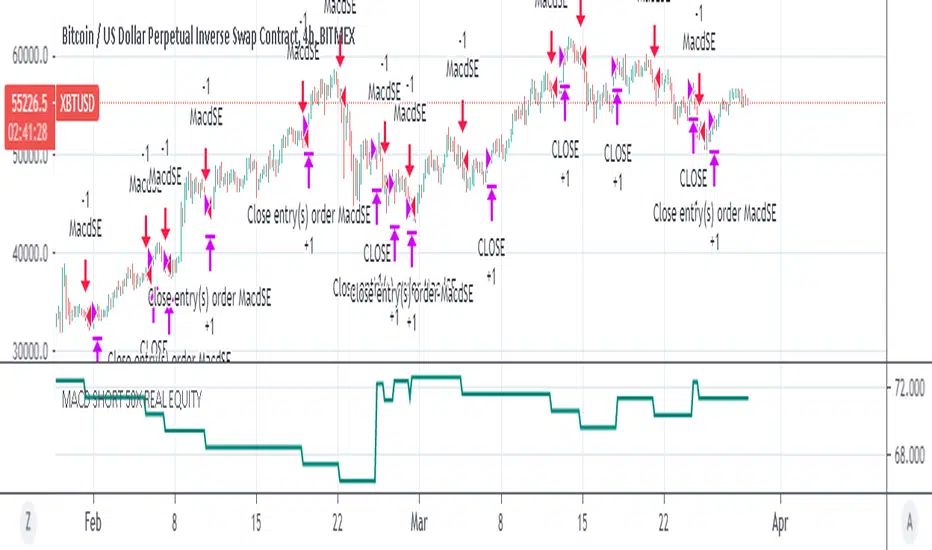
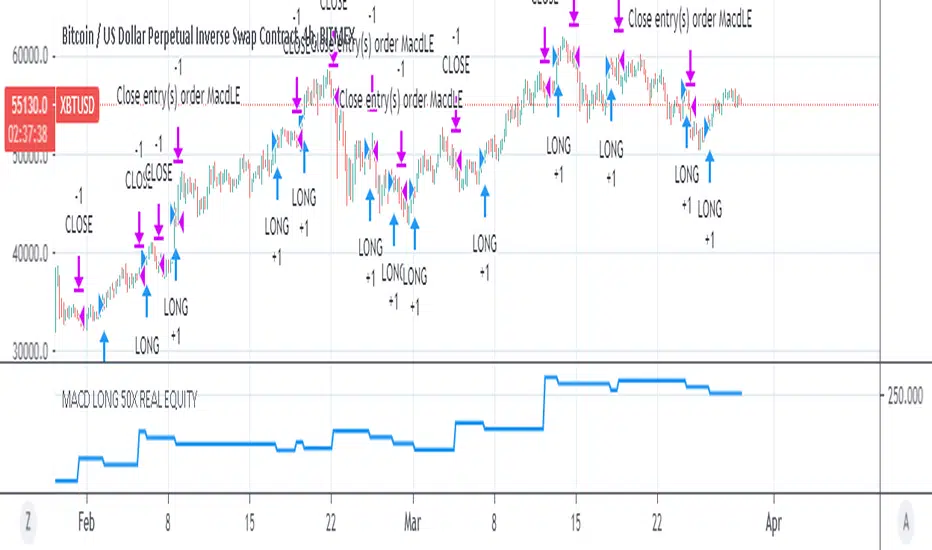
指标
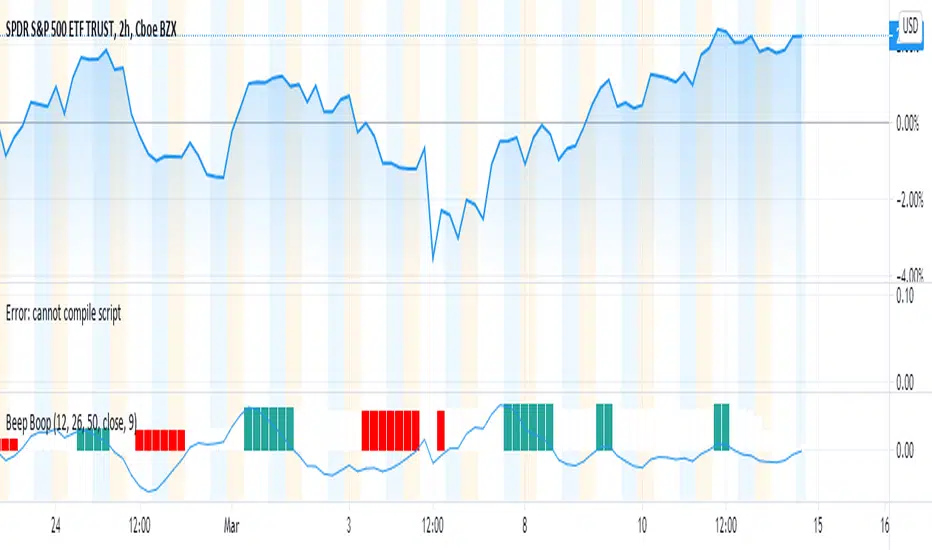
指标

指标

策略
策略

指标
指标
指标

指标

策略
指标
策略

指标

指标

指标

Trend Thrust Indicator - RafkaThis indicator defines the impact of volume on the volume-weighted moving average, emphasizing trends with greater volume.
What determines a security’s value? Price is the agreement to exchange despite the possible disagreement in value. Price is the conviction, emotion, and volition of investors. It is not a constant but is influenced by information, opinions, and emotions over time. Volume represents this degree of conviction and is the embodiment of information and opinions flowing through investor channels. It is the asymmetry between the volume being forced through supply (offers) and demand (bids) that facilitates price change. Quantifying the extent of asymmetry between price trends and the corresponding volume flows is a primary objective of volume analysis. Volume analysis research reveals that volume often leads price but may also be used to confirm the present price trend.
Trend thrust indicator
The trend thrust indicator (TTI), an enhanced version of the volume-weighted moving average convergence/divergence (VW-Macd) indicator, was introduced in Buff Pelz Dormeier's book 'Investing With Volume Analysis'. The TTI uses a volume multiplier in unique ways to exaggerate the impact of volume on volume-weighted moving averages. Like the VW-Macd, the TTI uses volume-weighted moving averages as opposed to exponential moving averages. Volume-weighted averages weigh closing prices proportionally to the volume traded during each time period, so the TTI gives greater emphasis to those price trends with greater volume and less emphasis to time periods with lighter volume. In the February 2001 issue of Stocks & Commodities, I showed that volume-weighted moving averages (Buff averages, or Vwmas) improve responsiveness while increasing reliability of simple moving averages.
Like the Macd and VW-Macd, the TTI calculates a spread by subtracting the short (fast) average from the long (slow) average. This spread combined with a volume multiplier creates the Buff spread 指标

指标
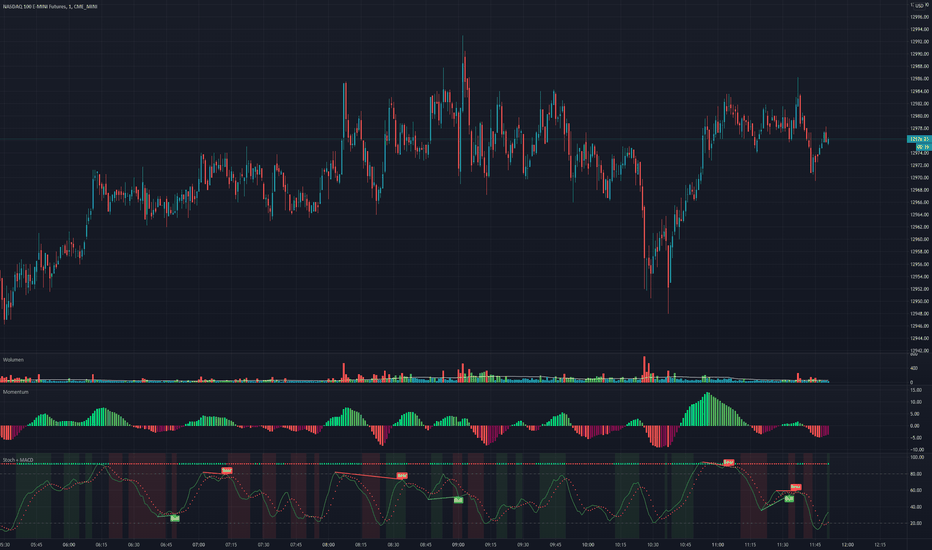
REDWOOD MTF MacD Stochastic RSIOne of out most premium indicators is this MTF MacD Stochastic RSI combo.
This is calculated with specific conditions to give the best signals for market reversals or continued trends.
=======
For a detailed description of how the REDWOOD MacD works, see profile (links of personal indicators arent posting for some reason)
For a detailed description of how the REDWOOD Stochastic RSI works, see profile
=======
These are both powerful indicators alone, but together they work very well together to confirm positions or see new entries or exits.
Without giving too much away on how it is made, this takes trades when the MacD is weak, with a confirming signal from the Stoch RSI
just the other way, it takes trades when the MacD is strong, and the Stoch RSI confirms trend.
This was made to reduce clutter of watching multiple indicators, while still giving you a chance to see what both indicators are doing and how they are flowing together.
Custom alerts are set so you never miss a trade opportunity! Get alerted on all reversals, strong signals, or even signals from the MacD or Stochastic RSI crosses!
This is a Multi Timeframe indicator so you can see what is happening on a long term time frame while trading short time frame bars, getting a better position in the market.
Best trades are when the alert or indicator is signaling, and the close of the MacD is about to happen on the MTF time frame set. All timeframes for both MacD and Stoch can be customized, and they do come with default settings.
Best MTF Time frames are longer timeframes (1hr, 4hr, D) but it can work well with current timeframe and lower timeframes (15min, 30min)
All settings for the MacD and Stoch are the same as the original, you can remove the MacD or histogram, remove or see crosses, and even color in pivot points in the MacD
~~~
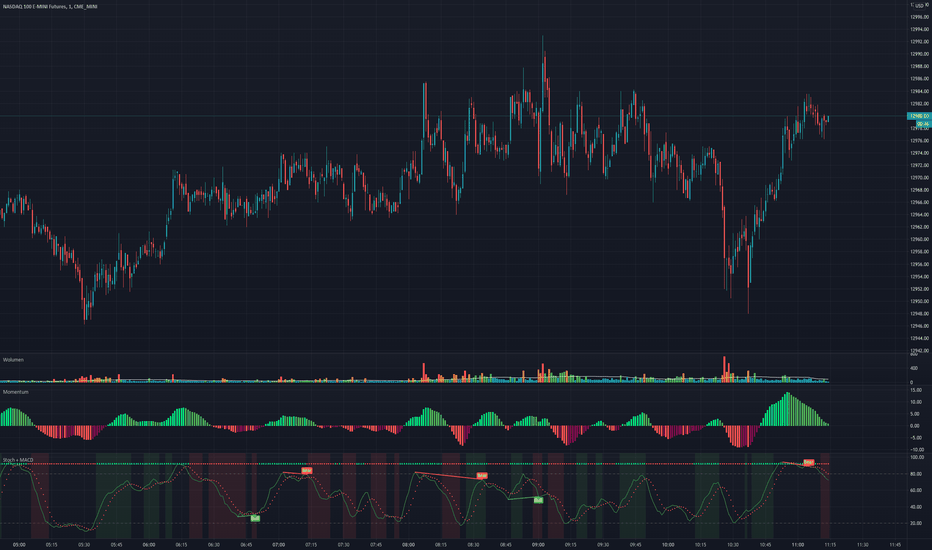
Added feature is this indicator by default shows the MacD to tell you the overall trend, but you can uncheck the Show MacD setting to remove the MacD and check the Show Stoch RSI to have the indicator show you the Stoch RSI all in the same indicator! This is extremely useful to see where the Stoch RSI is at when the MacD is turning or pivoting. If the stoch is turning as well and overbought or oversold, it is a good time to enter or exit a position.
Dark Green is showing buy signals, and dark maroon is showing sell signals.
The coloring in the background (red, lime) is showing the trend we are riding and when the color goes away it is an indication of a possible trend reversal or dip coming. These are mostly used to confirm positions.
~~~
The timeframes I recommend would be the 4hr on both, althought it has proven to work well (if you want more signals) to have either the MacD or Stoch RSI on a higher timeframe and the opposite on a lower timeframe.
All plots and inputs can be customized to your own liking, and there is the option to color the bars with the Stoch RSI being overbought or oversold.
Best Trading Strategy : Enter positions according to the colors being alerted (green = buy, red = sell) when the FIRST is alerted. This is the ideal and best entry.
For safer trading you can wait for a second to confirm and enter there.
Trades can be taken on the shading colors too, trading on trend waves, although this is risky as some waves end abruptly. Best signals are as stated above.
This indicator works very well on its own but can work well along side our other indicators listed here :
Bishop MA's or MA Cloud with Fill
This can be a very useful indicator, and I'm sure some may find settings that work even better
than the default or recommended settings.
This indicator works on all markets, forex, cryptocurrency, and stocks.
For access to this and all indicators available, please DM me here or See profile.
We are here to help each other succeed! The more one succeeds the more we all succeed! We are all in this
together and every person deserves to be financially independent and confident when taking trades
and investing. 指标
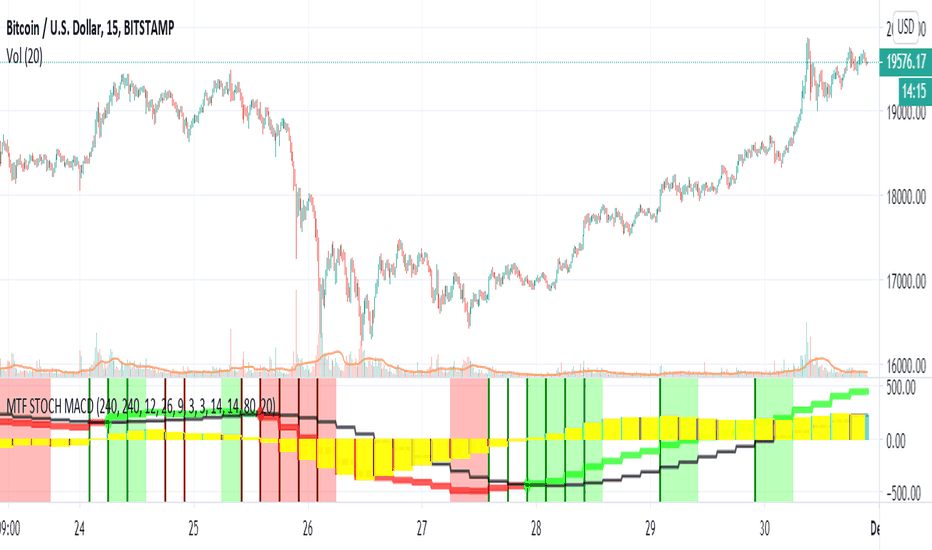
REDWOOD MTF MacD
This MTF MacD is a custom made indicator to show trends and potential trend changes.
As you see the MTF MacD is colored depending on the trend and if MacD is above or below the Signal.
This indicator shows the crossover or crossunder of these plots with the colored circles that
are plotted. This can be a very useful indicator to show you a start of a new trend or a trend that
is weak, giving you ideas of when to take profit or enter a new trade.
For more information on MacD in general (for reference) Please see the detailed
description here : www.investopedia.com
This MacD is a Multi Time frame MacD, meaning it can show you higher or lower timeframes of the MacD no matter what current time frame your chart is on. This is
applied in the settings of the indicator by default, with a default timeframe of 4hr.
You can easily change back to the current time frame by checking the box "Use Current MacD Timeframe?". This can be very useful to get into a trend early, entering or exiting on low time frame bars while seeing the live Long time frame MacD. This can help reassure a position if the asset dips, or see if the asset is having one last push up before the fall.
The inputs of Fast ema, Slow ema, signal length can be customized to your liking.
There are inputs that will remove the MacD & Signal crosses, the histogram, or the MacD in general, there are also inputs you can apply that shows when the macd is changing its trend and pivoting.
For trading with this indicator, it works very well with a indicator confirming the position or potential change that is happening, I recommend the RSI or StochRSI. Specifically, the REDWOOD MTF Stochastic RSI .
When MacD line crosses over the Signal (black) line and is showing the MacD line lime, with the Histogram showing aqua or light blue,
this is when to take a Long or buy position.
When MacD line crosses under the Signal (black) line and is showing the MacD line red, with the Histogram showing red, this is when to take a short or sell position.
To filter out false crosses or trades, this is where I recommend the MTF stoch or RSI, taking trades on the MacD when the Stoch or RSI is showing signs of overbought or oversold areas. These provide the strongest signals and buy and sell positions.
This is recommended as a swing indicator , but can be used for scalping at your own risk.
As for recommended time frames to use for the MTF settings, I would stick to longer timeframes to show the overall trend. With that being said, it can be used on shorter timeframes as well and works good. I would sick to the 1hr or 4hr timeframes, and for lower I recommend the 15min or 30min timeframes.
The lower you go the more signals will be provided, but with that lots more false signals will show as well if the asset is volatile.
All settings, colors, and plots can be customized, and all are labeled to make it easy for you.
Alerts for each setting will be added in the future for simplicity, as of now the alerts can be made as usual, having the indicator plot MacD crossing the indicator plot Signal, telling you of a change in the MacD.
This can be a very useful indicator, and I'm sure some may find settings that work even better than the default or recommended settings.
This indicator works on all markets, forex, cryptocurrency, and stocks.
For access to this and all indicators available, please DM me here or See profile.
We are here to help each other succeed! The more one succeeds the more we all succeed! We are all in this
together and every person deserves to be financially independent and confident when taking trades
and investing.
指标
指标
指标

指标

指标