指标

Spectra Inflection [JOAT]Spectra Inflection
Introduction
Spectra Inflection is an advanced open-source momentum oscillator that replaces conventional RSI with a Laguerre-domain filter, applies Jurik Moving Average (JMA) adaptive smoothing, and overlays a Zero-Lag EMA (ZEMA) signal line to produce a momentum reading with substantially less lag and noise than standard oscillators. The indicator then layers on Schmitt trigger state transitions, dynamic VWMA bands, gradient histogram rendering, momentum divergence detection, velocity and acceleration tracking, squeeze detection, exhaustion signals, and a comprehensive 16-row dashboard — all in a single pane.
This indicator exists because traditional momentum oscillators like RSI suffer from two fundamental problems: lag and noise. Lag causes late entries and exits. Noise causes false signals in choppy markets. Spectra Inflection addresses both by combining a Laguerre filter (which compresses price history into a shorter effective window without losing smoothness) with JMA adaptive smoothing (which tracks fast moves closely while filtering out chop). The result is a momentum curve that responds to genuine trend shifts quickly while remaining stable during consolidation.
Core Concepts
1. Laguerre RSI Core
The Laguerre filter is a four-element recursive filter originally developed by John Ehlers. Unlike a standard RSI that uses a fixed lookback window, the Laguerre filter uses a damping factor (alpha) to create an exponentially-weighted cascade of four internal registers (L0 through L3). This produces a smoother, more responsive oscillator:
float gamma = 1.0 - alpha
L0 := alpha * close + gamma * nz(L0 )
L1 := -gamma * L0 + nz(L0 ) + gamma * nz(L1 )
L2 := -gamma * L1 + nz(L1 ) + gamma * nz(L2 )
L3 := -gamma * L2 + nz(L2 ) + gamma * nz(L3 )
The cumulative up/down movements across all four registers are then computed to derive an RSI-like value scaled 0-100. Lower alpha values produce smoother output (more filtering), while higher values produce faster response. The default alpha of 0.07 provides a balance between responsiveness and noise rejection.
2. JMA Adaptive Smoothing
The raw Laguerre RSI output is then passed through a Jurik Moving Average, which is a proprietary-class adaptive filter. JMA uses a volatility-tracking mechanism to adjust its smoothing dynamically: when the input is volatile, JMA tracks more closely; when the input is stable, JMA smooths more aggressively. This means the momentum line hugs genuine reversals tightly while filtering out noise during consolidation. The JMA implementation uses three parameters: period (smoothing length), phase (lead/lag adjustment), and power (responsiveness curve).
3. ZEMA Signal Line
A Zero-Lag EMA is calculated on the JMA-smoothed momentum line. ZEMA works by computing two EMAs and extrapolating the difference to cancel out the inherent lag:
ema1 = ta.ema(src, len)
ema2 = ta.ema(ema1, len)
zema = ema1 + (ema1 - ema2)
Crossovers between the momentum line and the ZEMA signal line generate potential entry and exit signals. The indicator scores each crossover based on the angle of approach, distance from the midline, and volume context to produce a "cross quality" rating.
4. Schmitt Trigger State Machine
Rather than using simple threshold crossings (which produce whipsaws), the indicator uses a Schmitt trigger — a hysteresis-based state machine where the entry threshold differs from the exit threshold. For example, the momentum line must cross above 62 to enter a bullish state, but must drop below 55 to exit it. This prevents rapid flip-flopping in choppy conditions and produces cleaner, more tradeable state transitions.
5. Dynamic VWMA Bands
Volume-Weighted Moving Average bands are calculated around the momentum line. These bands expand when volume is high (indicating conviction) and contract when volume is low (indicating indecision). Price touching or exceeding the bands while momentum is extended signals potential exhaustion or continuation depending on the volume context.
Features
Gradient Histogram: A color-gradient histogram below the momentum line shows the distance from the midline (50). Colors shift smoothly from muted near the center to vivid at extremes, providing instant visual feedback on momentum intensity without cluttering the chart
Neon Glow Rendering: The main momentum line uses a multi-layer plot technique where progressively wider, more transparent copies of the line are stacked to create a subtle glow effect that intensifies with momentum strength
Momentum Divergence Detection: The indicator detects both regular and hidden divergences using fractal pivot anchoring. When price makes a new high but the Laguerre RSI makes a lower high (bearish divergence), or price makes a new low but the oscillator makes a higher low (bullish divergence), the indicator draws divergence lines and labels
Velocity and Acceleration Tracking: First and second derivatives of the momentum line are calculated and smoothed. Velocity shows the rate of momentum change; acceleration shows whether momentum is speeding up or slowing down. These are displayed in the dashboard
OB/OS Exhaustion Detection: When momentum reaches extreme overbought or oversold levels with declining velocity, the indicator flags potential exhaustion points where reversals are more likely
Cross Quality Scoring: Each momentum/signal crossover is scored 0-100 based on the angle of the cross, distance from the midline, and whether volume confirms the move. Higher scores indicate higher-conviction crosses
Band Squeeze Detection: When VWMA bands contract below a threshold, the indicator identifies a "squeeze" condition — compressed momentum that often precedes a sharp expansion move
Midline Conviction Signals: Crosses of the 50 midline are tracked with volume confirmation to identify shifts in the underlying momentum bias
Momentum Regime Classification: The dashboard classifies the current momentum state as Trending Bull, Trending Bear, Ranging, or Transitional based on the composite of all sub-systems
16-Row Dashboard: A comprehensive real-time table displays Laguerre RSI, JMA momentum, ZEMA signal, state, velocity, acceleration, cross quality, band width, squeeze status, divergence history, regime classification, and more
Input Parameters
Laguerre Core:
Alpha: Damping factor for the Laguerre filter (default: 0.07). Lower = smoother, higher = faster
JMA Smoothing:
Period: JMA smoothing length (default: 8)
Phase: Lead/lag adjustment from -100 to +100 (default: -50)
Power: Responsiveness curve (default: 0.6)
Signal Line:
ZEMA Length: Period for the zero-lag signal line (default: 13)
State Thresholds:
Bull Entry/Exit: Schmitt trigger thresholds for bullish state (default: 62/55)
Bear Entry/Exit: Schmitt trigger thresholds for bearish state (default: 38/45)
VWMA Bands:
Band Length: VWMA calculation period (default: 20)
Band Width: Multiplier for band distance (default: 1.5)
Visuals:
Toggles for histogram, glow, divergence lines, bar coloring, background zones, squeeze markers, and dashboard
How to Use This Indicator
Step 1: Identify the Momentum Regime
Check the dashboard's regime classification. In trending regimes, look for pullback entries in the direction of the trend. In ranging regimes, look for mean-reversion setups at the VWMA band extremes.
Step 2: Wait for Schmitt Trigger State Transitions
Rather than acting on every oscillator wiggle, wait for the Schmitt trigger to confirm a state change. A transition from neutral to bullish (momentum crossing above the bull threshold with hysteresis) is a higher-conviction signal than a simple RSI crossing 50.
Step 3: Confirm with Cross Quality
When a momentum/signal crossover occurs, check the cross quality score. Scores above 60 indicate strong, angled crosses with volume confirmation. Scores below 30 suggest weak, flat crosses that are more likely to fail.
Step 4: Watch for Divergences
Divergences between price and the Laguerre RSI often precede reversals. Regular divergences signal potential trend changes; hidden divergences signal trend continuation. Use these in conjunction with the regime classification for context.
Step 5: Monitor Squeeze and Exhaustion
Band squeezes indicate compressed momentum — prepare for a breakout. Exhaustion signals at OB/OS extremes with declining velocity suggest the current move is losing steam.
Indicator Limitations
Like all momentum oscillators, this indicator is a lagging derivative of price. It confirms moves rather than predicting them
The Laguerre filter's alpha parameter significantly affects behavior — values that work well on one timeframe or instrument may need adjustment for others
Divergence detection uses fractal pivots which require a right-bar confirmation delay (default 5 bars). Divergences are identified after the fact, not in real-time
The Schmitt trigger prevents whipsaws but also delays state transitions. In fast-moving markets, the state change may come after a significant portion of the move has already occurred
Volume-based features (VWMA bands, cross quality scoring) work best on instruments with reliable volume data. On forex or instruments with synthetic volume, these features may be less meaningful
This is a momentum tool, not a complete trading system. It should be combined with trend structure, support/resistance, and risk management for actual trading decisions
Originality Statement
This indicator is original in its synthesis of multiple advanced signal processing techniques into a unified momentum analysis system. While individual components (Laguerre filters, JMA smoothing, ZEMA, Schmitt triggers) are established concepts in technical analysis and signal processing, this indicator is justified because:
The Laguerre-to-JMA-to-ZEMA processing chain creates a momentum signal with properties not achievable by any single technique alone — the Laguerre provides the raw momentum extraction, JMA provides adaptive noise filtering, and ZEMA provides a lag-compensated reference
The Schmitt trigger state machine replaces simple threshold crossings with hysteresis-based transitions, substantially reducing false signals in choppy conditions
Cross quality scoring provides a quantitative measure of signal conviction that is not available in standard oscillator implementations
The integration of velocity, acceleration, exhaustion detection, squeeze detection, and divergence analysis into a single coherent pane eliminates the need for multiple separate indicators
Dynamic VWMA bands provide volume-contextual overbought/oversold boundaries rather than fixed levels
Disclaimer
This indicator is provided for educational and informational purposes only. It is not financial advice or a recommendation to buy or sell any financial instrument. Trading involves substantial risk of loss. Past performance of any indicator does not guarantee future results. The momentum readings, state classifications, and signals displayed are mathematical calculations based on historical price data — they do not predict future price movement. Always use proper risk management and conduct your own analysis before making trading decisions. The author is not responsible for any losses incurred from using this indicator.
-Made with passion by officialjackofalltrades
指标

指标

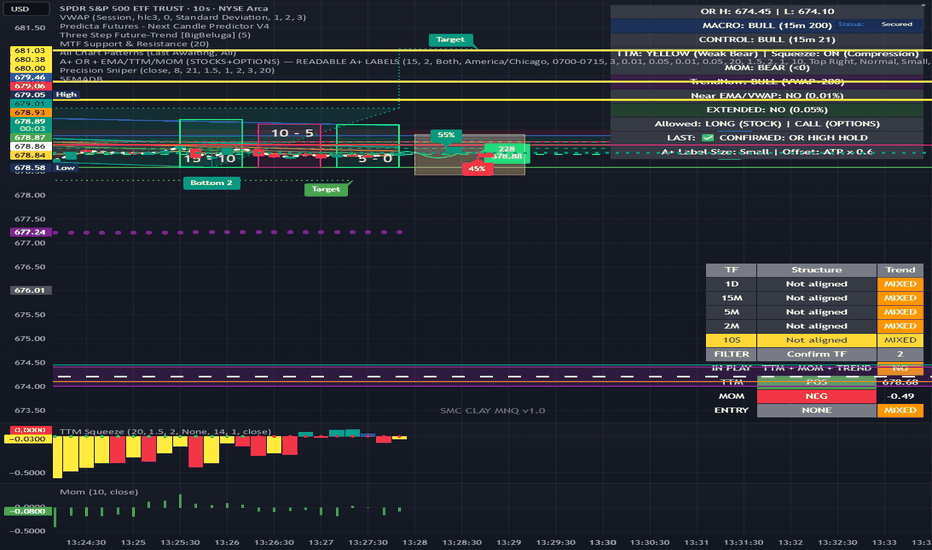
5 EMA Multi-Timeframe Dashboard (Trend, Momentum & Entry Signals5 EMA Dashboard is a multi-timeframe trend and confirmation tool built for traders who want a quick visual read on market structure, trend direction, momentum, and possible entry signals.
This script plots the 200, 55, 34, 21, and 8 EMAs directly on the chart and displays a dashboard table that tracks trend structure across multiple timeframes: 1D, 15M, 5M, 2M, and 10S. Trend logic is based on full EMA stacking with price included, so bullish structure is defined as Price > 8 > 21 > 55 > 200, while bearish structure is the reverse.
The table highlights the active chart timeframe in yellow and shows whether each timeframe is bullish, bearish, or mixed. In addition, the script includes a confirmation section using a user-selected timeframe to evaluate whether the stock is “in play” based on trend alignment, momentum, and a TTM-style linear regression filter. It also flags possible entry conditions when price crosses above or below the 8 EMA or VWAP.
This makes the script useful for traders who want:
multi-timeframe trend alignment
quick bullish vs bearish structure checks
confirmation that a stock is actively trending
simple visual cues for possible EMA 8 or VWAP entries
You can also use this shorter version for the public library summary:
Multi-timeframe EMA dashboard that shows bullish, bearish, or mixed structure across 1D, 15M, 5M, 2M, and 10S using price + EMA stacking. Includes trend confirmation, momentum/TTM-style filters, and possible EMA 8 or VWAP entry signals in a movable on-chart table.
And if you want, here is a more polished “How it works” section too:
How it works
This script defines bullish structure as price above the 8 EMA, with the 8 above the 21, the 21 above the 55, and the 55 above the 200. Bearish structure is the exact opposite. If those conditions are not fully aligned, the script labels the timeframe as mixed. The dashboard then combines that structure with confirmation-timeframe momentum and entry logic to help traders quickly judge whether a stock is trending cleanly and whether a possible setup is forming.
Short Description
Multi-timeframe EMA dashboard showing bullish, bearish, or mixed structure using price + EMA stacking. Includes trend confirmation, momentum filters, and EMA 8 / VWAP entry signals in a movable table.
Full Description
Overview
The 5 EMA Multi-Timeframe Dashboard is a structured trading tool designed to help you quickly identify trend direction, confirm momentum, and spot potential entry opportunities—all in one view.
This script combines price action, EMA stacking, and momentum confirmation into a clean dashboard format, allowing traders to assess whether a stock is trending cleanly or in a choppy, non-tradeable state.
Key Features
1. Multi-Timeframe Trend Dashboard
Tracks structure across:
1 Day
15 Minute
5 Minute
2 Minute
10 Second (if supported)
Automatically highlights your current chart timeframe in yellow
Displays:
Structure (EMA alignment)
Trend (Bull / Bear / Mixed)
2. EMA Structure Logic (Core Edge)
Trend is defined using full EMA stacking with price included:
Bullish Structure:
Price > 8 EMA > 21 EMA > 55 EMA > 200 EMA
Bearish Structure:
Price < 8 EMA < 21 EMA < 55 EMA < 200 EMA
Mixed:
Any misalignment → indicates chop or low-quality setup
3. “Stock In Play” Confirmation
Uses a selectable confirmation timeframe (default: 2-minute) to determine if a stock is actively trending.
A stock is considered “In Play” when:
EMA structure is aligned (bullish or bearish)
Momentum is moving in the same direction
TTM-style linear regression filter supports the move
This helps filter out low-quality trades and focus only on stocks with real momentum.
4. Momentum & TTM-Style Filter
Momentum (10-period) confirms directional strength
TTM-style linear regression acts as a trend acceleration filter
Displays:
POS (Positive)
NEG (Negative)
FLAT
5. Entry Signals (Simple & Actionable)
Identifies potential entries on the confirmation timeframe:
EMA 8 Cross
Bullish: price crosses above EMA 8
Bearish: price crosses below EMA 8
VWAP Cross
Bullish: price crosses above VWAP
Bearish: price crosses below VWAP
These are labeled clearly in the dashboard for quick decision-making.
6. Fully Customizable Dashboard
Move the table anywhere on the chart:
Top / Bottom / Left / Right / Center
Adjustable font size for visibility
Works across different trading styles (scalping → intraday → swing)
🧠 How to Use
Step 1: Check Structure
Look for alignment across multiple timeframes
Best setups occur when 2M, 5M, and 15M agree
Step 2: Confirm “In Play”
Only trade when:
Trend = Bull or Bear
“In Play” = Confirmed
Momentum + TTM align
Step 3: Wait for Entry
EMA 8 or VWAP cross signals provide timing
Avoid chasing extended moves
⚠️ Important Notes
Lower timeframes (especially 10-second) depend on your TradingView data plan
Multi-timeframe values may slightly adjust in real-time due to how data is aggregated
Best used with confirmed setups—not as a standalone signal generator
🚀 Best For
Intraday traders
Scalpers
Momentum traders
Anyone using EMA-based strategies
⚠️ Disclaimer
This indicator is for educational and informational purposes only. It does not constitute financial advice. Always perform your own analysis and risk management. 指标
CCI Stoic Continuation - Crossing SignalsDescription
The CCI Stoic Continuation is a refined take on the classic Commodity Channel Index, designed specifically for traders who prioritize clarity and trend persistence over chasing volatile swings. Instead of viewing the CCI as a simple overbought/oversold oscillator, this indicator treats it as a momentum thermometer .
By utilizing a multi-layered threshold system, the indicator helps traders distinguish between a nascent trend (Early Momentum) and a confirmed, high-velocity move (Strong Momentum).
How It Works
The script visualizes four distinct phases of price action based on the relationship between the CCI and key threshold levels ($10$ and $80$):
1 Early Bullish (Teal) : CCI crosses above $+10$. This suggests momentum is beginning to shift upward.
2 Strong Bullish (Cyan) : CCI crosses above $+80$. This indicates high-velocity trend continuation.
3 Early Bearish (Light Orange) : CCI crosses below $-10$. The first sign of downside pressure.
4 Strong Bearish (Red) : CCI crosses below $-80$. Indicates significant conviction in the downward move.
Key Features
• Heat Fills : The background of the indicator pane is shaded to provide an immediate psychological "feel" for the current market environment.
• Bar Coloring : Trend colors are applied directly to your price bars, allowing you to stay focused on the price action while monitoring momentum shifts.
• Transition Markers : Vertical dashed lines appear in the indicator pane whenever a momentum state changes, highlighting the exact moment a "Stoic" entry or exit might be considered.
• Precision Alerts : Built-in alert logic for both "Early" and "Strong" signals in both directions.
Usage Tips
• Trend Alignment (CRITICAL) : Do not take every signal. Only execute entries aligned with the higher-timeframe trend or overall market bias. This indicator is designed for continuation, not reversals.
• The Stoic Entry : Use the "Early" signal to prepare, and look for "Strong" confirmation to enter once the trend is clearly established.
• The Zero Line : The yellow zero line acts as the "Neutral Zone." Price action staying consistently above or below this line validates the broader trend bias.
• Timeframes : While optimized for standard settings, it performs exceptionally well on the 15m, 1h, and 4h timeframes.
Technical Settings
• CCI Length : Default 20 (Adjustable for sensitivity).
• Early Level: 10 (Customizable for tighter or looser entries).
• Strong Level: 80 (The threshold for confirmed momentum).
Author : Konstantinos Trovas
Version : 6.0 (Pine Script)
指标

AG Pro HTF Bias Dashboard [AGPro Series]AG Pro HTF Bias Dashboard
Overview / What it does
AG Pro HTF Bias Dashboard is a higher-timeframe context tool built for traders who want a fast, structured view of directional conditions across multiple larger timeframes without crowding the chart with extra signals, zones, or decision noise.
The script summarizes higher-timeframe bias in a compact dashboard and presents each selected row as Bull, Bear, or Neutral, together with a mode-specific status readout. The goal is not to predict the next candle or replace a full trade plan. The goal is to make larger-timeframe context easier to read at a glance.
This indicator is designed to answer a simple but important workflow question: "What is the broader directional environment across the higher timeframes I care about right now?" Instead of forcing the user to manually flip through multiple charts and compare structure or trend conditions one by one, the dashboard keeps that information visible in a single panel.
The script supports multiple bias engines so the same dashboard can be adapted to different styles of chart reading. Users can evaluate higher-timeframe context through EMA Stack alignment, confirmed Swing Structure, SuperTrend direction, or MACD Momentum agreement. This makes the tool flexible enough for trend-following traders, structure-based traders, and users who prefer momentum-style confirmation.
Unlike many overlays that try to combine entries, exits, alerts, pattern detection, and signal generation inside one study, this script stays focused on one task: higher-timeframe directional context. That single-purpose design is intentional. It keeps the output clean, readable, and easier to integrate into an existing process.
Unique Edge
The main strength of this script is not signal generation. Its edge is structured context compression.
Instead of plotting a large number of higher-timeframe elements directly on the chart, AG Pro HTF Bias Dashboard converts higher-timeframe conditions into a compact visual matrix. This makes it possible to assess multi-timeframe agreement quickly while keeping the chart itself relatively clean.
A second differentiator is the ability to switch the bias engine. The dashboard is not locked to one interpretation framework. Users can work with:
- EMA Stack, for ribbon-style alignment
- Swing Structure, for confirmed HH/HL and LH/LL progression
- SuperTrend, for ATR-based directional trend state
- MACD Momentum, for momentum agreement between line, signal, and histogram
Another important detail is the higher-timeframe validity filter. Rows that are not actually higher than the current chart timeframe are marked as Lower/EQ instead of being treated as valid higher-timeframe context. This helps keep the dashboard aligned with its intended purpose.
The script also includes confluence logic, so the user can see not only the state of each row, but also the dominant higher-timeframe bias and how many valid rows support that direction. In practice, this helps users distinguish between broad directional agreement and mixed conditions.
Methodology
The dashboard can display three to five higher-timeframe rows, depending on user settings. Each row evaluates one selected timeframe and classifies it into Bull, Bear, or Neutral.
Bias Mode options:
1) EMA Stack
This mode evaluates directional alignment using a three-EMA structure. A bullish state requires price and the EMA ribbon to be aligned in bullish order. A bearish state requires the opposite alignment. When the full sequence is not aligned, the row can remain neutral and display a partial status such as 2/3 or 1/3 rather than forcing a directional label.
2) Swing Structure
This mode uses confirmed pivot logic to read higher-timeframe structure. It looks for confirmed higher highs / higher lows or lower highs / lower lows, and then evaluates position relative to the active swing range. Because this logic depends on confirmed pivots, structure changes are naturally more selective and may appear later than faster trend models.
3) SuperTrend
This mode reads directional state using an ATR-based trend framework. It is intended for users who prefer a cleaner directional state model rather than ribbon alignment.
4) MACD Momentum
This mode classifies bias through agreement between the MACD line, signal line, and histogram. It is useful for traders who prefer momentum confirmation over structure or moving-average ordering.
The dashboard then calculates:
- the number of valid bullish rows
- the number of valid bearish rows
- the dominant higher-timeframe state
- the confluence count across valid rows
Optional chart context features are also included. Depending on settings, the script can color candles according to the active chart bias, plot the active EMA ribbon or SuperTrend on the chart, apply a subtle background tint when confluence is strong enough, and show a compact mini context tag on the chart.
States / Context Output
This indicator is a context dashboard, not an alert engine.
It does not generate buy or sell alerts, does not mark trade entries, and does not claim to identify optimal execution points. Its outputs are state-based and contextual:
- Bull
- Bear
- Neutral
- Confluence summary
- Mode-specific status text
The mini chart tag, when enabled, is only a compact summary of dominant higher-timeframe direction and current confluence. It should be read as context, not as a trade instruction.
Key Inputs
Higher Timeframes
Users can select three to five rows and define the exact higher timeframes to monitor.
Bias Mode
Choose between EMA Stack, Swing Structure, SuperTrend, and MACD Momentum.
Engine Parameters
The script exposes relevant inputs for each engine, including EMA lengths, Swing Strength, SuperTrend ATR settings, and MACD settings.
HUD Controls
The panel position and panel scale can be customized so the dashboard can fit different layouts and chart styles.
Style Controls
Users can adjust theme and directional colors for bullish, bearish, and neutral states.
Chart Context Controls
Optional features include candle coloring, active indicator plotting for EMA / SuperTrend, strong-confluence background tinting, mini context tag visibility, tag anchor, tag offset, and tag font size.
Limitations & Transparency
This script is not a prediction model. It summarizes directional context from user-selected higher-timeframe logic.
Higher-timeframe tools can update only when data from those larger intervals updates. Because of that, the dashboard should be understood as a context layer rather than a real-time trigger engine.
Swing Structure mode uses confirmed pivots. That means structure changes may appear later than faster directional methods, because confirmation requires completed pivot information.
Neutral states do not necessarily mean the market is untradeable. They simply indicate that the selected bias engine does not currently show clear directional alignment under the chosen rules.
The confluence count is a summary statistic, not a quality score. A larger number of aligned rows does not automatically mean a better trade. It only means more selected higher-timeframe rows currently point in the same direction.
Rows marked Lower/EQ are excluded from valid higher-timeframe confluence because they are not above the active chart timeframe.
This script is intended to support discretionary analysis and chart organization. It should be combined with the user’s own execution framework, risk model, and market understanding.
Risk Disclosure
This indicator is provided for analysis and educational use. It does not provide financial advice, investment advice, or guaranteed outcomes.
Market conditions can change quickly, and no single indicator or dashboard can remove uncertainty from trading or investing. Users should evaluate higher-timeframe context together with price action, liquidity, volatility, risk management, and their own decision process.
Past behavior, historical alignment, or current confluence does not guarantee future performance.
指标

_Trinity Matrix_
Short description
A structured multi-layer oscillator built around a refined Trinity Wave core, MFI regime columns, confidence scoring, divergence filtering, and TF / HTF context.
Full publication description
Trinity Matrix is a multi-layer oscillator designed to read continuation, reversal quality, regime strength, and divergence context inside a single panel.
It combines a refined Trinity Wave core, MFI regime structure, confidence scoring, mode-based signal filtering, divergence logic, and a compact TF / HTF dashboard into a unified workflow.
The name is a nod to layered market context: not a single signal, but a structured matrix of wave state, regime strength, confidence, and divergence.
Core Structure
Trinity Wave core with additional smoothing and soft limiting to reduce extreme spikes while preserving directional character
MFI Columns to separate baseline participation from stronger expansion phases
Strong zone highlighting to visually distinguish stronger bullish and bearish regime expansion
Confidence engine that blends Trinity Wave continuation and MFI continuation into a normalized directional score
Signal modes for different levels of selectivity: None, Early, Standard, and Strict
ATR-gated divergence filtering for cleaner divergence structures
TF / HTF confidence dashboard for comparing active timeframe conviction against a selected higher timeframe
Built-in alerts for buy, strong buy, elite buy, sell, strong sell, and elite sell conditions
How to Read It
Trinity Wave is the main directional layer. Green indicates bullish state, red indicates bearish state.
MFI Columns show regime participation.
White columns = baseline MFI flow
Shiny white columns = stronger bullish expansion
Orange columns = stronger bearish expansion
Average MFI bands help show where positive or negative regime strength is building relative to recent memory.
Confidence Dashboard summarizes directional conviction on both the active timeframe and the selected higher timeframe.
Row 1 = TF / HTF labels
Row 2 = confidence percentage
Row 3 = qualitative tag: Weak / Moderate / Strong
Signal Modes
None hides signal output
Early is faster and more aggressive
Standard is more balanced
Strict applies the strongest filtering and usually produces the fewest signals
Divergence Module
The divergence layer uses Trinity Wave turning points, confidence filtering, pivot distance control, and optional ATR gate filtering.
It can draw on the oscillator and, if enabled, on price as well.
The goal is not to maximize divergence count, but to keep the structures more selective and readable.
Alerts
This script includes separate alert conditions for:
TW Buy
TW Buy Strong
TW Buy Elite
TW Sell
TW Sell Strong
TW Sell Elite
Suggested Use
Trinity Matrix works best as a structured reading tool rather than a one-click decision engine.
A practical workflow is:
Read Trinity Wave direction and location
Check whether MFI is in baseline flow or strong expansion
Use confidence and HTF context to judge continuation or reversal quality
Use signal mode based on your desired aggressiveness
Use divergence as a contextual filter, not as a standalone trigger
Important Notes
Signal frequency changes significantly with the selected signal mode
HTF confidence reflects the live state of the selected higher timeframe
Divergence output is intentionally filtered and selective
This is an indicator framework, not a full trading strategy
Attribution
Core WaveTrend-style formulation was adapted from the open-source WaveTrend Oscillator by LazyBear, then extended with additional smoothing, soft limiting, MFI regime logic, confidence scoring, divergence filtering, dashboard structure, and alert workflow.
Acknowledgement
Built through many rounds of testing, refinement, and iteration — with a little help from ChatGPT and CodeGPT along the way.
Disclaimer
For educational and analytical use only. Not financial advice. 指标

Saga System [LB]
hello friend here is
Saga System
The Saga System is an advanced algorithmic trend-following tool designed to detect phases of institutional accumulation and distribution . By combining Relative Volume Analysis with Price Momentum , it filters out low-quality market noise and highlights only the most meaningful directional moves through dynamic Action Zones .
Overview
The core idea behind the Saga System is simple:
Identify when abnormal volume enters the market.
Confirm that this volume aligns with directional price momentum.
Display the result as a visual zone to help traders read market intent more clearly.
This allows traders to quickly identify whether the market is under strong buying pressure or selling pressure , while keeping the chart clean and readable.
📈 Buy Setup (Long Entries)
Conditions:
Wait for a Green Saga Zone to appear.
This confirms a bullish impulse supported by an institutional volume expansion.
Make sure price remains structurally above the system’s internal EMA trend line.
Key observations:
Zone size matters: the larger the green zone, the stronger the underlying buying pressure.
Momentum stacking: two separate consecutive green zones often indicate stronger continuation potential than a single isolated signal.
Entry precision: for better timing, combine the signal with horizontal support levels, discount zones, or RSI oversold conditions.
📉 Sell Setup (Short Entries)
Conditions:
Wait for a Red Saga Zone to form.
This reflects an aggressive bearish impulse confirmed by elevated volume.
Confirm that price is trading below the system’s fast control line.
Key observations:
Zone expansion: a wide red zone often reflects strong directional volatility and can mark the start of a sustained bearish leg.
Trend confirmation: multiple consecutive red zones show that sellers remain in control of market psychology.
Risk control: the system is designed to capture the core part of the move; a close back through the opposite side of the zone often signals momentum neutralization.
before reading any other text here are somme other screen
How to Read the Zones
The Action Zones are not just visual markers — they represent moments where volume and momentum align in the same direction .
Green Zone: bullish pressure, accumulation, and potential continuation.
Red Zone: bearish pressure, distribution, and potential continuation to the downside.
Large zones: stronger conviction and greater directional intent.
Repeated zones: increased probability that the trend is strengthening rather than fading.
⚙️ Technical Methodology
The Saga System is built on three core calculation layers:
1. Institutional Volume Filter
The script calculates a Simple Moving Average (SMA) of volume over a user-defined lookback period. A zone is triggered only when current volume exceeds a predefined threshold:
Current Volume > (SMA Volume * Multiplier)
This condition helps eliminate low-liquidity noise and improves the quality of detected impulses.
2. Directional Bias Confirmation
The system uses a reactive Exponential Moving Average (EMA) to determine short-term directional bias. For a zone to remain valid, price must move in agreement with the EMA slope.
In other words:
Bullish zones require price to remain aligned with upward momentum.
Bearish zones require price to remain aligned with downward momentum.
This ensures that volume is not analyzed in isolation , but in direct relation to trend direction.
3. Dynamic State Engine
Unlike static indicators, the Saga System updates zone coordinates in real time. Each zone evolves with market structure and automatically ends when momentum weakens, typically when price crosses the ultra-fast EMA used as the internal momentum control.
This creates a clean and adaptive block-style visualization, helping the trader focus only on relevant expansion phases.
Best Use Cases
The Saga System performs best when used in confluence with other high-quality tools or structural references:
Support and resistance levels
Market structure breaks
RSI exhaustion zones
Trend continuation setups
High-volume breakout environments
It is especially useful for traders looking to isolate high-conviction trend continuation phases rather than random short-term fluctuations.
Disclaimer
Disclaimer: Trading involves substantial risk. The Saga System is a decision-support tool only and does not constitute financial advice. Past performance does not guarantee future results.
指标

Trend Energy Filter
🚀 Trend Energy Filter
Introducing a new dimension in trend analysis: Trend Energy.
In automotive systems (like ECU sensor data), we use hysteresis and noise-gates to prevent "jitter" from triggering false responses.
This script applies that same logic to Momentum (Trend Energy):
ENERGY: Measures the "Engine Load" of the trend by calculating the distance from a long-term SMA.
NOISE FILTER: Uses an ATR-based threshold. The Energy value only updates if the change is significant, effectively filtering out the "market static" that causes false signals.
EXHAUSTION: Detects when the "Fuel" is running out by identifying peaks in energy and subsequent cooling.
While this type of signal processing is often hidden inside expensive commercial "black box" tools, this script provides it as a transparent, open-source engineering solution.
While standard indicators look at price in isolation, the Trend Energy Filter analyzes the "tension" between price and its long-term baseline (SMA). By focusing on the Surface Area of this tension, we gain a visual representation of market conviction that has been largely overlooked by traditional technical analysis.
The Innovation of the "Energy Surface"
Most traders view moving averages as simple static lines. The Trend Energy Filter reimagines the gap between price and the SMA as a dynamic surface.
Volumetric Visualization: Instead of thin lines, the indicator uses a neon-glow "Surface" with vertical gradients. This represents the total "Energy" currently held by the trend.
Volatility-Adjusted Noise Filter: Unlike standard oscillators that whipsaw during consolidation, this script utilizes a state-persistent ATR filter. It only updates the "Surface" when market energy moves significantly, effectively silencing the noise of minor price fluctuations.
XAUUSD 15min
Peak-Based Exhaustion Logic: By tracking the Highest energy peaks over a lookback period, the script identifies when a trend's "batteries" are running low—turning the surface blue when momentum begins to stall.
How to Trade with the Energy Surface:
1. Entering the Energy Flow (Momentum Resumption)
Watch for the "Surface" to break above its previous peak. When the color shifts from the "Exhaustion Blue" back to a vibrant Bullish Green or Bearish Red, it signals that the market has finished its rest and is ready to expand the surface area again.
NAS100 15min
Signal: Momentum Increasing alert.
2. Spotting the Blow-Off (Exhaustion Detection)
When the "Surface" is high but begins to contract (falling below its recent high), the trend is becoming "over-extended" or "exhausted." This is the ideal time to take profits or tighten trailing stops.
Visual: The surface turns blue (#5b9cf6) while still at high levels.
NAS100 15 min
3. The Squeeze (Energy Compression)
When the Energy Surface is exceptionally low and the Noise Filter prevents it from fluctuating, the market is in a "coiled spring" state. A sudden expansion of the surface from a flat baseline often precedes a massive directional breakout.
NAS100 15min
4. Baseline Context
Green Surface: Price is above the 200 SMA (Bullish Energy).
Red Surface: Price is below the 200 SMA (Bearish Energy).
Blue Surface: Trend is pausing or mean-reverting (Exhaustion). 指标

指标
指标

指标

AG Pro Trend Continuation Quality [AGPro Series]AG Pro Trend Continuation Quality
Overview / What it does
AG Pro Trend Continuation Quality is an overlay built to evaluate whether a pullback is behaving like a healthy retracement inside an active trend, or whether the move is losing structural quality before continuation can develop.
Instead of treating every dip in an uptrend or every pop in a downtrend as equally important, the script isolates pullback sequences and scores them through a continuation-quality framework. The goal is not to predict every next candle. The goal is to help traders judge whether the market is showing disciplined retracement behavior that often precedes trend continuation.
The model combines trend alignment, pullback depth, pullback duration, relative volume behavior during the retracement, and the strength of the bounce candle that attempts to resume the trend. These conditions are translated into a compact quality score so the user can quickly separate cleaner continuation structures from weaker ones.
On the chart, the script highlights pullback zones, tracks the retracement box, displays a continuation-quality label, and maintains an information panel that summarizes trend state, recent quality readings, best quality, average quality, and internal distribution data. The result is a workflow-oriented continuation map rather than a simple trend-following overlay.
Unique Edge
The distinctive part of this script is that it does not label trend continuation from trend direction alone. A bullish EMA stack or bearish EMA stack is not enough by itself. The script specifically evaluates the quality of the retracement before the continuation attempt is scored.
That makes it meaningfully different from basic EMA trend tools, pullback highlighters, or single-condition continuation signals. Many tools can say that price is above or below an average. Fewer tools attempt to measure whether the internal anatomy of the pullback remains constructive for continuation.
The scoring engine focuses on five practical questions:
1. Is the broader trend aligned?
2. Is the pullback still structurally controlled rather than excessively deep?
3. Did the retracement last a reasonable number of bars?
4. Did volume contract during the pullback instead of expanding aggressively against trend?
5. Did the bounce show enough intent to suggest renewed directional participation?
This creates a cleaner framework for evaluating continuation setups in a way that is visual, systematic, and easier to compare across multiple pullbacks on the same chart.
Methodology
The script first determines directional context using EMA alignment and, when needed, swing-structure logic. This creates a working trend state that frames whether the script should be looking for bullish or bearish pullback behavior.
Once a directional leg is active, the script begins tracking a pullback when price retraces against that trend. During the retracement, it measures:
- how far the pullback travels relative to the prior trend leg,
- how many bars the pullback lasts,
- how pullback volume compares with the prior expansion leg,
- and whether the bounce candle shows convincing re-engagement.
These components are translated into a 0 to 10 quality score. Higher scores represent more orderly and structurally coherent pullbacks. Lower scores represent weaker or more suspect retracements.
The visual output is designed to make those evaluations easier to read in real time:
- pullback boxes frame the retracement zone,
- optional fib-depth line shows the deepest retracement point tracked inside the pullback,
- labels display score, quality grade, depth, duration, and relative volume,
- panel metrics summarize the current continuation environment.
Signals & Alerts
The script is designed as a quality-mapping tool, not as an automatic trade system.
Its event logic revolves around the completion of a pullback and the appearance of a bounce candle that attempts to resume the trend. When that bounce qualifies, the script calculates the final continuation-quality score and can display the setup if it meets the user-defined minimum score threshold.
Available workflow signals include:
- active bullish or bearish trend state,
- pullback in progress,
- completed pullback with scored continuation attempt,
- high-quality continuation events when the score reaches stronger thresholds.
Optional alerts can be used for:
- high-quality continuation conditions,
- or any scored pullback event, depending on user preference.
Because alerts are tied to the script’s scoring and confirmation logic, they are intended to support chart review and decision-making rather than act as guaranteed execution instructions.
Key Inputs
EMA Fast Length / EMA Mid Length / EMA Slow Length
These define the trend stack used to frame directional bias.
Swing Pivot Length
Controls the swing-structure sensitivity used in secondary trend detection.
Max Pullback Depth (%)
Defines how strict the script is when assessing whether a retracement remains healthy relative to the prior trend leg.
Min Pullback Bars / Max Pullback Bars
Controls the acceptable pullback duration window.
Volume Decline Ratio
Helps determine whether the retracement is occurring on lighter activity relative to the prior directional leg.
Minimum Score to Display
Filters weaker continuation events from the chart.
Label Size / Label Offset / Reduce Label Overlap
Lets the user adapt chart readability to their own zoom level and instrument volatility.
Panel Position / Panel Font Size / Panel Theme
Allows the continuation dashboard to be integrated into different chart layouts without dominating screen space.
Limitations & Transparency
This script does not know future market intent. It evaluates observable price and volume behavior after conditions form on the chart.
A high score does not guarantee continuation. It only indicates that the completed pullback meets the script’s internal definition of stronger continuation quality relative to other pullbacks.
The model is also sensitive to market regime. Trend continuation behavior tends to be clearer in directional markets and less reliable in highly compressed, erratic, or news-driven conditions.
Volume behavior can vary across instruments and data feeds. On some assets, especially where volume data is synthetic, limited, or structurally uneven, the volume component should be interpreted with caution.
Like other structure-based tools, this script can produce different practical usefulness depending on timeframe, instrument, volatility regime, and chart cleanliness. Users should calibrate inputs based on the market they are studying rather than treating defaults as universal settings.
This script should not be viewed as:
- a prediction engine,
- a standalone trade system,
- a replacement for risk management,
- or a guarantee that a bounce will develop into a full continuation leg.
Risk Disclosure
This script is for chart analysis and educational use. It is designed to help users study pullback quality inside established trends, not to provide financial, investment, or trading advice.
All trading and investing involve risk. Market conditions can change quickly, and even high-quality continuation structures can fail. Users should apply their own confirmation process, position sizing rules, and risk controls before acting on any market observation.
Use the script as a structured continuation framework, not as certainty.
指标

策略

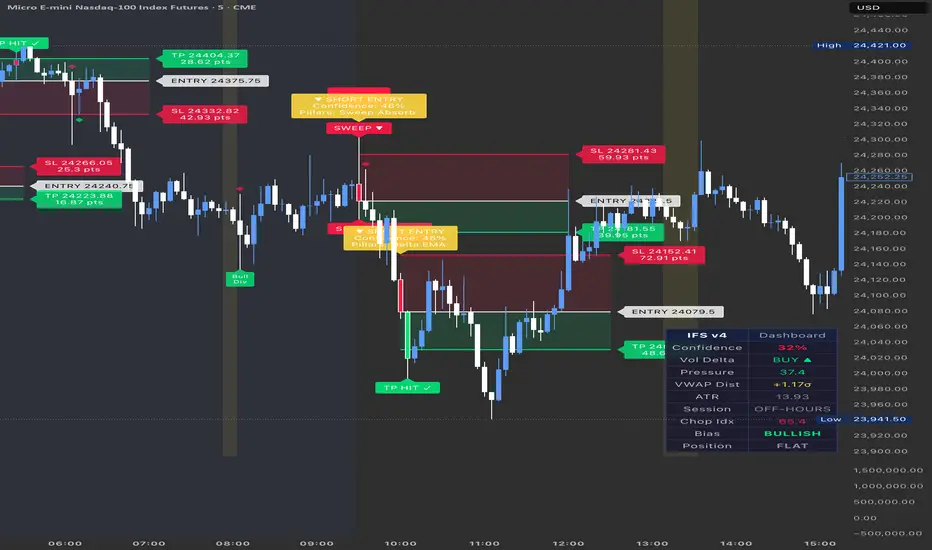
Institutional Flow Scalper [IFS] v4Institutional Flow Scalper
The Institutional Flow Scalper reconstructs institutional-grade order flow analysis using only price and volume data available on TradingView. Instead of relying on traditional lagging indicators, IFS detects the footprints that large players leave in the market through volume delta imbalances, liquidity sweeps, and order absorption patterns.
HOW IT WORKS
IFS uses a multi-pillar confirmation system. A signal only fires when 2 or more independent pillars align in the same direction, reducing false signals and filtering noise.
The 7 Pillars:
1. Synthetic Volume Delta: Reconstructs buying vs selling pressure by analyzing where price closes within each bar's range, weighted by volume. This approximates what institutional platforms like Bookmap show through actual order flow.
2. Momentum Divergence: Compares the rate of change between price and cumulative volume delta. When price moves one direction but volume pressure shifts the opposite way, it signals exhaustion before the chart reflects it.
3. Liquidity Sweep Detection: Identifies stop hunts where price sweeps beyond a recent swing high/low with a volume spike, then fails to hold. This is the "smart money" concept of grabbing liquidity before reversing.
4. Order Absorption: Detects bars with abnormally high volume but small bodies, indicating a large player is absorbing aggressive orders without letting price move. This is what footprint chart traders look for as "stacked imbalances."
5. VWAP Cross & Band Bounce: Monitors price interaction with session VWAP and its standard deviation bands. Crosses and bounces from the 1-sigma bands serve as mean-reversion confirmation.
6. EMA Trend Alignment: Uses 9/21 EMA structure. Signals are strengthened when a strong directional candle appears in alignment with the EMA trend, or when an EMA crossover occurs.
7. POC Breakout: Tracks a dynamic Point of Control (volume-weighted price center) and flags when price breaks through it, indicating acceptance of a new price level.
SIGNAL FILTERS
Choppiness Index Filter: Measures whether the market is trending or ranging using the Choppiness Index. When chop is high (above threshold), all signals are suppressed to avoid overtrading in sideways conditions.
Session Filter: Signals are restricted to high-liquidity sessions (NY Morning, NY Afternoon, London) where institutional activity is concentrated and price moves have follow-through.
Confidence Score: Each bar receives a composite score from 0 to 100 based on all pillar inputs. Only bars exceeding the minimum confidence threshold generate signals.
Position Management: Only one trade can be active at a time. No new signal fires until the current trade closes via TP or SL. This prevents signal stacking and overtrading.
VISUAL FEATURES
Clear entry labels showing direction (LONG/SHORT), confidence percentage, and which pillars confirmed the trade. On entry, colored zones project forward showing the risk area (red box from entry to SL) and reward area (green box from entry to TP), with exact price levels and point distances on the labels.
Exit labels display the outcome: TP HIT, SL HIT, or MOM EXIT. All visual elements are limited to the current day's session to keep the chart clean as you scroll through history.
The dashboard displays real-time metrics: Confidence Score, Volume Delta direction, Pressure Index, VWAP distance, ATR, Session status, Chop Index, directional Bias, and current Position state.
SETTINGS OVERVIEW
Signal Engine: Sensitivity mode (Low/Medium/High/Adaptive), minimum confidence threshold.
Volume Delta Engine: CVD lookback and smoothing periods.
Liquidity Sweep: Swing point lookback, volume spike threshold.
VWAP: Band multipliers, POC lookback.
Anti-Chop Filter: Chop Index length and threshold.
Session Awareness: Configurable session windows for NY, PM, and London.
Risk Management: ATR-based TP and SL multipliers, visual line extension length.
Visual Style: Fully customizable colors for bull, bear, entry, TP, and SL elements.
RECOMMENDED USE
Designed for scalping and day trading on futures (ES, NQ, MNQ, GC, CL) and high-liquidity instruments. Optimized for 1-minute, 5-minute, and 15-minute timeframes. Works on any instrument with reliable volume data.
Use with proper risk management. Position sizing should reflect your account size and risk tolerance. Past indicator signals do not guarantee future performance.
WHAT MAKES THIS DIFFERENT
Most scalping indicators on TradingView are variations of RSI + EMA + MACD. IFS takes a fundamentally different approach by reconstructing order flow concepts (volume delta, absorption, liquidity sweeps) that institutional traders use on specialized platforms, and making them accessible within TradingView's ecosystem. The multi-pillar confirmation system ensures signals only fire when multiple independent factors align, not just when a single oscillator crosses a threshold. 指标

Carrier Volatility [Pumori]Carrier Volatility
This is the foundational Pulse component of the ET Massif Framework research suite.
Description
Pumori is a high-resolution volatility and impulse response tool built around an ultra-short fractional length (0.1 EMA). It is a high-frequency carrier framework that exposes the formation of volatility through controlled instability rather than smoothing. Unlike traditional indicators that smooth or lag volatility, Pumori captures high-frequency energy, allowing volatility to be observed in near real-time as it forms.
Construct
At its core, Pumori uses:
Dual 0.1-length EMA
A sub-unit length (N < 1) is intentionally used to produce an anti-smoothing response, where the recursive term overreacts to incoming data and amplifies micro-movements. The EMA is applied twice recursively, producing a controlled oscillatory response. This interaction forms the carrier layer, where continuous oscillation exposes high-frequency volatility directly.
Flexible source input (RSI, RSI SMA, close, custom)
Three default source modes are available, allowing Pumori to operate across different domains. RSI is set as the default carrier as it represents normalized momentum in a bounded range, providing a stable domain for the transform. The chosen source defines how the carrier behaves and directly influences stability, noise profile, and interpretability.
Volatility Envelope
The recursive overshoot–correction cycle forces continuous oscillation around the source, forming a dynamic envelope that expands and contracts with volatility. Pumori does not measure volatility, it reveals volatility formation.
Think of Pumori like an AM radio carrier wave. The point is not signal transmission — it is that the carrier must operate at a high enough frequency for changes to become visible immediately. Most traditional volatility measures operate over a fixed lookback window, which makes them inherently lagging. Pumori Instead, it allows volatility to express immediately. The 0.1 EMA acts as a high-frequency baseline upon which expansion and contraction are directly observed.
Modes
Default
RSI is the default baseline configuration. because it provides a bounded and naturally oscillatory structure (0–100), allowing the carrier to behave in a stable and interpretable manner. Unlike price, which can expand unpredictably, RSI compresses extremes and standardizes movement, making volatility expansion and contraction easier to observe. The result is a clean carrier waveform that offers the best balance between responsiveness and readability.
Diagnostic
RSI (SMA) , the simple moving average of RSI is applied to the carrier transform. This reduces internal jitter while preserving underlying structure. It is used to assess movement quality, separating clean, controlled trends from noisy or chaotic trends.
Price
Applying it on price produces a highly reactive output where volatility expansion and contraction are expressed in a zig-zag band around price. The oscillations reflect immediate changes in movement and make volatility clustering visible within trend.
How to Use
Volatility Gauge
Band expansion indicates an active volatility state.
Band contraction indicates a suppressed environment
No volatility = no opportunity.
Market Progression
A low-volatility environment facilitates smooth, steady price progression. In contrast, high-volatility states produce a chaotic path characterized by erratic movement and uneven progression, signaling potential structural instability and reduced directional efficiency.
Future Development
Fractional EMA on price is further planned to be used as input component for adaptive filtering systems (e.g., Kalman filter integration). Specifically, the high-frequency oscillations of the volatility band provides a direct proxy for noise measurement, allowing dynamic adjustment of model responsiveness without introducing lag.
Default Settings
EMA Lengths: 0.1, 0.1
Default Mode: RSI (stable carrier behavior)
Diagnostic Mode: RSI SMA (reduced noise, structural clarity)
Price Mode: Close (Volatility clustering & envelop)
RSI Length: 14
RSI SMA Length: 14
日本語概要 (Japanese Summary)
Pumoriは、0.1という極短期間のEMA(指数平滑移動平均)を用いた高解像度なボラティリティ指標です。従来のATR(アベレージ・トゥルー・レンジ)のような遅行性の高い「平均型」ではなく、相場における瞬間的なボラティリティの拡張と収縮をリアルタイムに捉えることを目的としています。
主な特徴:
高精度なバンド形成: 価格データまたはRSIをベースに、ジグザグ状のボラティリティバンドを形成します。
ボラティリティの「発生」を直感的に把握: 従来の指標では見逃されがちな、微細な価格変化の初動(ボラティリティの発生)を直接観測可能です。
市場の質を識別: 相場が「滑らかなトレンド」にあるのか、あるいは「ノイズの多い不安定な状態」にあるのか、その動きの質を瞬時に判別できます。
中文概要(Chinese Summary)
Pumori 是一個基於 0.1 極短期 EMA 的高解析度波動率工具,旨在即時捕捉市場波動的擴張與收縮。不同於傳統 ATR 等滯後性的「平均型」指標,Pumori 能在第一時間反應波動的動態變化。
核心特點:
動態鋸齒型波動帶: 可靈活作用於價格、RSI 或平滑後的 RSI,形成緊隨走勢的動態帶狀區域。
捕捉「波動生成」: 直接觀測波動的初動與爆發,而非事後進行數值平均
高靈敏度動能偵測: 對市場動能變化極為敏感,能有效區分趨勢的平滑程度與市場雜訊(Noise)。
主要用途:
市場環境判斷: 辨識當前是否具備交易條件(穩定趨勢 vs. 混亂無序)。
波動品質分析: 評估市場走勢的品質,區分健康的波動與無效的雜訊。
進階算法基礎: 作為未來卡爾曼濾波器(Kalman Filter)進行波動調節的核心基礎。
Disclaimer:
This script is a research tool for market structure analysis and educational purposes only. It does not constitute financial advice. Trading involves risk. 指标

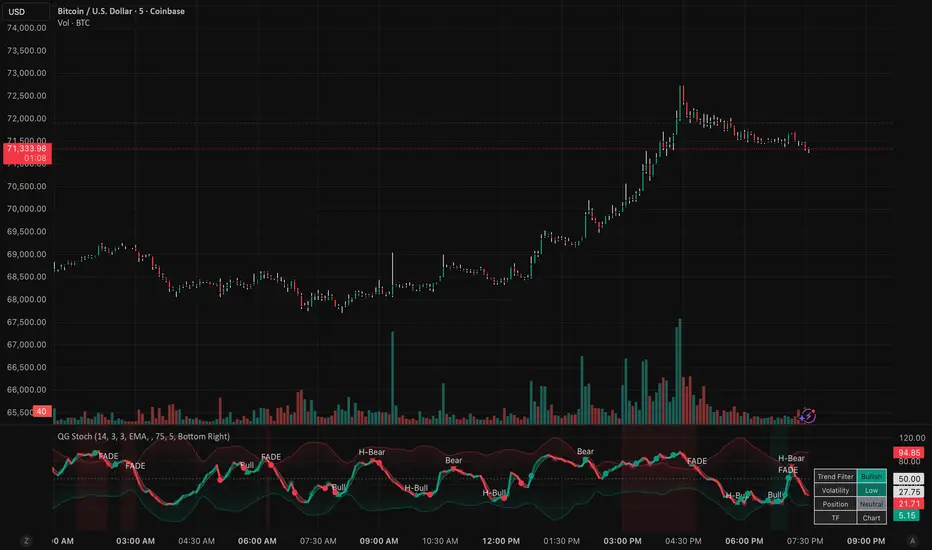
Quant Grade StochasticThe Quant Grade Stochastic is an institutional-level momentum workstation designed to solve the primary flaw of traditional oscillators: static overbought and oversold levels. In modern markets, static 80/20 or 70/30 levels often lead to "premature fading" in strong trends or missed entries during low-volatility regimes.
This script replaces fixed levels with Adaptive Volatility Zones—dynamic bands that expand and contract based on the market's standard deviation. This allows traders to identify true momentum extremes relative to current market conditions, not arbitrary numbers.
🚀 Key Quant Features
1. Adaptive Volatility Zones (Mean Reversion)
Unlike the standard Stochastic, the OB/OS levels are calculated using a volatility-adjusted engine. When volatility spikes, the zones expand to prevent "false" overbought signals. When volatility drops, the zones contract to catch micro-extremes.
2. Momentum Heatmap (Acceleration Analysis)
The %K line is color-coded based on its internal slope and acceleration.
Bright Colors: Indicate strong momentum and acceleration.
Dull Colors: Indicate momentum deceleration—a quant-grade "early warning" that a trend is tiring even before a crossover occurs.
3. Institutional Dashboard
A real-time status table that provides a high-level overview of market mechanics:
Trend Filter: Instant identification of the primary trend using a 200 EMA.
Volatility State: Quantifies if current market volatility is High or Low relative to its 50-period average.
Position State: Classifies the oscillator’s current location (Overbought, Oversold, or Neutral).
4. Dual Divergence Engine
Detects two distinct types of momentum anomalies:
Regular Divergence: Traditional reversal signals where price and momentum disconnect.
Hidden Divergence: Quant-grade trend continuation signals, identifying high-probability pullbacks in a trending market.
5. Smart Fade Signals
Markers specifically designed for the "Return-to-Range" strategy. When the %K line exits an extreme volatility zone and crosses back inside, a FADE signal is generated. These signals are visually filtered by the 200 EMA trend engine to prioritize "With-Trend" opportunities.
💡 How to Trade
The Fade Strategy: Wait for the %K line to go above the Adaptive Upper Zone. When it crosses back under that zone, look for a short entry. The "FADE" marker highlights this exact moment.
The Trend Follower: Use Hidden Divergence markers during pullbacks in a Bullish Trend (confirmed by the Dashboard) to find low-risk continuation entries.
Volatility Squeeze: When the Adaptive Zones are extremely tight (indicated by "Low" Volatility on the Dashboard), look for a Momentum Heatmap breakout to signify the start of a new expansion.
🛠️ Settings
Engine: Choose from 5 different smoothing types (SMA, EMA, WMA, HMA, ALMA).
Adaptive Zones: Customize the Standard Deviation multiplier to tighten or loosen your extremes.
Multi-Timeframe: Sync your momentum analysis with higher timeframes without leaving your current chart.
Quant Filter: Toggle the 200 EMA trend filter to clean up counter-trend noise. 指标

指标

指标

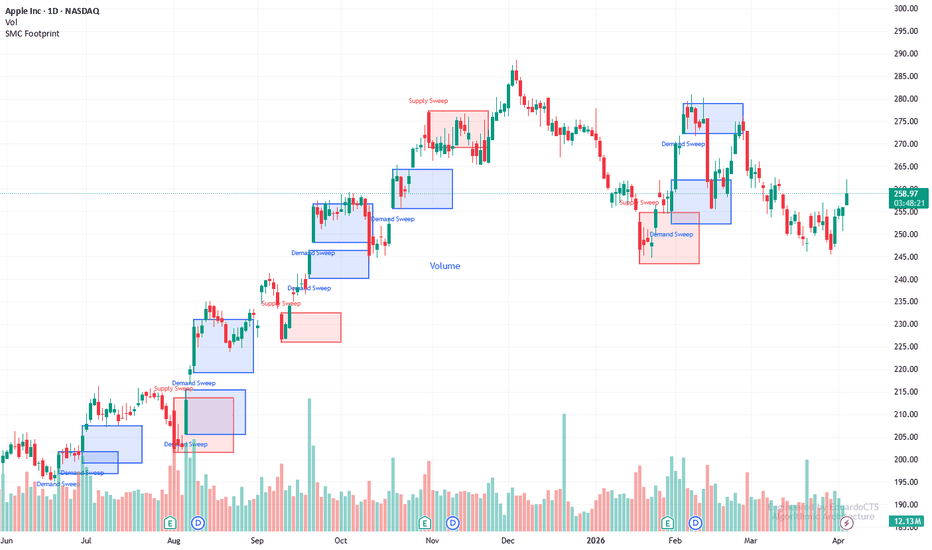
Institutional Smart Money Footprint (Volume Anomalies) by:EduardMost retail traders rely on moving averages and lagging oscillators, completely missing the fact that the market is governed by liquidity sweeps and algorithmic volume anomalies, I developed this stripped-down version of our institutional footprint tracker to map where the "Smart Money" is aggressively stepping in.
This engine doesn't just look at price action, it cross-validates extreme spread expansions with 150%+ volume surges to plot high-probability Demand and Supply blocks directly on your chart. When a whale moves, they leave a mathematical footprint. This algorithm highlights it.
If you are a discretionary trader, use these zones as hard exhaustion/reversal levels, if you are running a prop firm or need to translate complex logic like this into a fully automated, low-latency execution bot, my team specializes in custom algorithmic architecture (Pine Script, Python, and C#), feel free to study the open-source code or reach out directly for custom B2B engineering. 指标
MA + ATRHere’s a clean, professional **TradingView description** you can use when publishing your script:
---
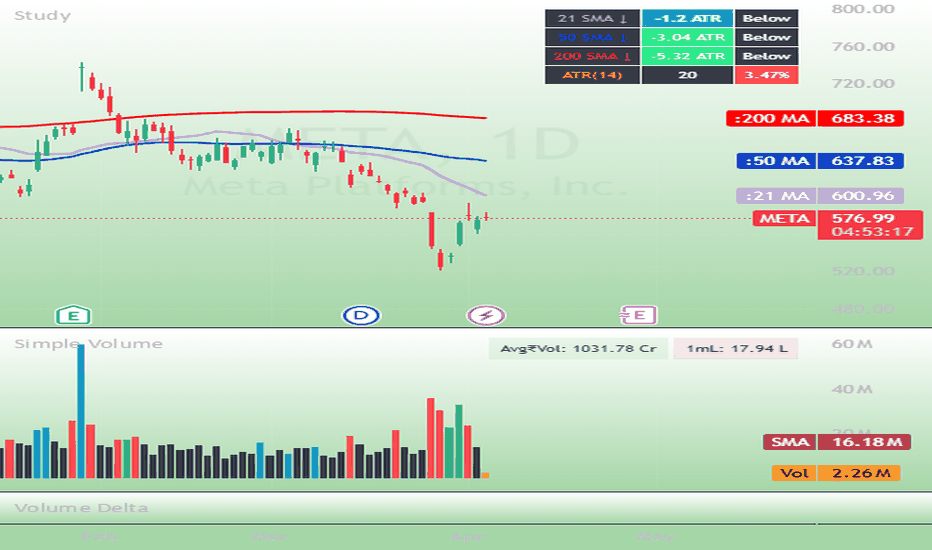
## 📊 Multi MA + ATR Extension Dashboard
This indicator combines key moving averages with volatility analysis to provide a clear, real-time view of trend structure, extension, and momentum.
---
### 🔧 Features
**Moving Averages**
* Plots **5, 21, 50, and 200 MA**
* Supports **SMA or EMA selection per MA**
* Clean color scheme for quick visual recognition
**ATR-Based Extension**
* Measures how far price is from each MA in **ATR units**
* Helps identify:
* Overextended moves
* Mean reversion zones
* Healthy vs stretched trends
**Trend Curl (Angle)**
* Displays **angle of curl (slope)** for 21, 50, and 200 MA
* Quickly shows:
* Trend acceleration
* Flattening structure
* Early reversal signals
**Smart Table Dashboard**
* Compact table showing:
* MA type + direction (arrow)
* Distance from MA (in ATR)
* Price position (above/below)
* Curl (angle) of key MAs
* Customizable position and size
**ATR Volatility Context**
* Shows ATR % (volatility relative to price)
* Helps compare volatility across instruments
---
### 🧠 How to Use
* **Trend Identification**
* Look for alignment (21 > 50 > 200 = bullish)
* Use curl to confirm strengthening or weakening trends
* **Extension Analysis**
* 1 ATR = normal move
* 2 ATR = extended
* 3 ATR = potential exhaustion
* **Mean Reversion**
* High ATR extension + flattening curl = pullback probability
* **Momentum Insight**
* Rising curl = strengthening trend
* Falling curl = weakening trend
---
### ⚙️ Best Use Cases
* Intraday trend trading
* Swing trading pullbacks
* Identifying exhaustion moves
* Volatility-aware risk management
---
### 💡 Notes
* ATR measures **volatility, not direction**
* Works best when combined with price structure and volume
指标
Pulse Heatmap [LB]
Pulse Reaction Heatmap
Overview
The Pulse Reaction Heatmap is a high-precision contextual price-reading indicator. It fuses an adaptive liquidity pulse with a dynamic volume density heatmap . Its core goal: reveal the "Market Footprint" —visually pinpointing price levels of institutional activity, liquidity absorption, and trend re-accumulation.
It delivers no mechanical signals; it spotlights zones primed for market reactions, defenses, or transitions .
Core Mechanism: The Pulse Line
Anchored by the Pulse , a hybrid trend-tracking line:
Adaptive Logic: Blends a Fast EMA ( 18 ) and Anchor EMA ( 34 ) to capture market equilibrium.
"Stickiness" Factor: ATR-based filter keeps it "glued" to price in consolidation, fluidly adapting during breakouts—eliminating the "lagging float" of standard MAs.
Dynamic Window: Pulse-centered workspace via multi-ATR , keeping the heatmap volatility-relevant.
Heatmap Construction & Scoring
Weighted scoring algorithm per bar in the lookback:
Conviction Weighting: Volume filtered by Body-to-Range ratio —large-body candles (low wicks) add max "conviction" density.
Positional Distribution: Weights across Full Range , Close (Acceptance) , and Wick Extremes (Test Levels) .
Temporal Decay: Older data fades mathematically (factor 0.978 ), prioritizing recent "hot" interest.
Visual Interpretation (Color Logic)
Gradient shows Market Interest Intensity :
Cold Zones (Blues/Greys): "Thin" liquidity; price slices through fast.
Intermediate Zones (Yellows/Oranges): Market Rotation —active order book equilibrium.
Hot Zones (Bright Red/Orange): Peak density; highly probable "accepted" prices for reactions/defenses.
Practical Trading Application
Confluence for AMT: Dynamic high-volume nodes and value areas as trends evolve.
Filtering Pullbacks: Target retraces into "Hot" zones for institutional defense confirmation.
Breakout Validation: Break + heatmap "re-densification" above = New Price Acceptance .
Important: The Pulse Reaction Heatmap is a Contextual Analysis Tool , not automated signals. Pair with Market Structure and Price Action to target true zones. 指标

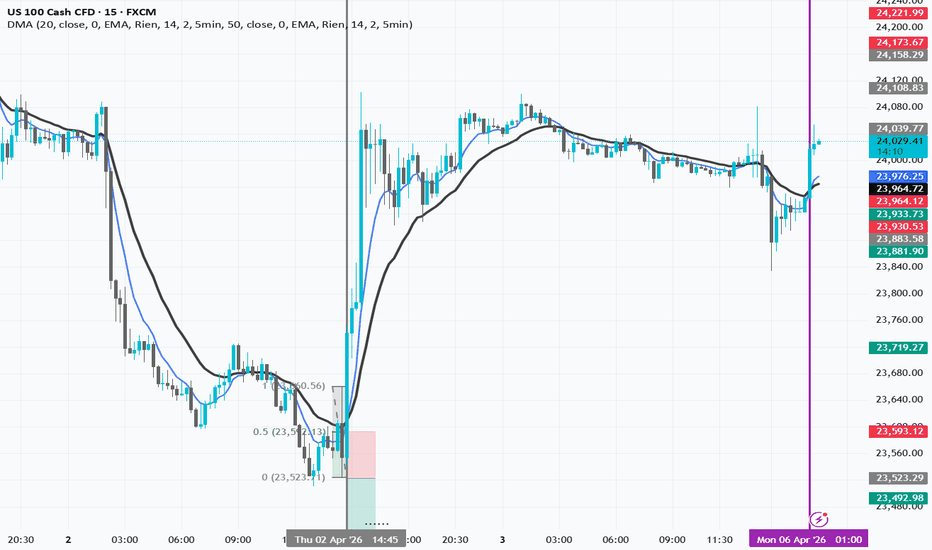
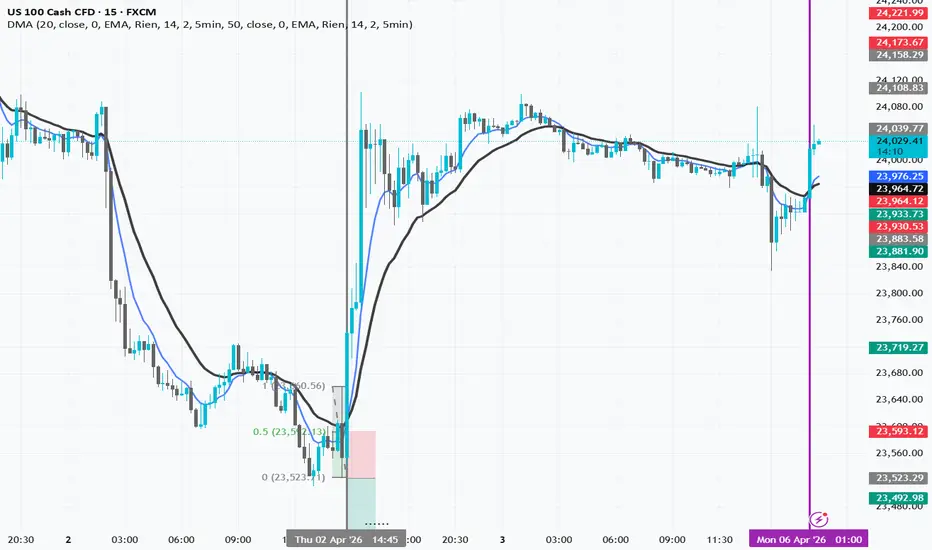
Double Moving Average## 📊 Double Moving Average (DMA)
**General Description:**
An indicator composed of two completely independent Moving Averages (MAs), each configured with its own parameters. Unlike a standard MA, each MA #1 and MA #2 can use a different timeframe, even if the chart displays another timeframe.
---
### **MA #1 - Parameters**
| Parameter | Default | Range | Description |
|-----------|---------|-------|-------------|
| **Enable MA #1** | ✓ | Yes/No | Activate/deactivate the first MA |
| **Length** | 50 | 1-500 | Calculation period of the MA |
| **Source** | Close | Open/High/Low/Close | Price source |
| **Offset** | 0 | 0-100 | Shift the curve to the right |
| **Type** | EMA | SMA/EMA/WMA | Type of moving average |
### **MA #2 - Parameters**
Identical to MA #1 but with default **Length: 200**
---
### **Smoothing - Per MA**
Each MA can have its own smoothing:
| Parameter | Options |
|-----------|---------|
| **Enable Smoothing** | Yes/No |
| **Type** | None / SMA / EMA / WMA |
| **Length** | 1-100 |
| **BB StdDev** | 0.1-10 (Bollinger Bands) |
---
### **Timeframe (Period) - Per MA**
Each MA calculates on an independent timeframe:
**Options:** 1min, 2min, 5min, 10min, 15min, 30min, 1hr, 2hr, 4hr, 1day
**"Wait for Close":** Waits for the timeframe candle to close before confirmation
---
### **Main Functions**
1. **`f_convert_timeframe()`** - Converts timeframe formats for Pine Script
2. **`f_calculate_ma()`** - Calculates SMA, EMA, or WMA
3. **`f_apply_smoothing()`** - Applies smoothing if enabled
---
### **Use Cases**
- Display short-term MA (5min) for scalping
- Display long-term MA (1day) for overall trend
- All on the same chart, independent of the displayed timeframe
- Compare two different trend periods simultaneously 指标