Money Flow Index GlauMoney Flow Index Glau (MFI)
Description
The Money Flow Index (MFI) is a technical analysis oscillator that combines price and volume to evaluate buying and selling pressure in an asset.
This indicator uses the typical price (HLC3 = (High + Low + Close) / 3) and calculates the MFI on a scale from 0 to 100.
In this version, in addition to the traditional MFI line, the line color changes according to its direction:
Green: MFI is rising compared with the previous period, indicating increasing buying pressure.
Red: MFI is falling compared with the previous period, indicating increasing selling pressure.
Yellow: MFI remains unchanged compared with the previous period.
The indicator displays three main levels:
80: Overbought
50: Middle Band
20: Oversold
How to Adjust the Length Parameter
The Length parameter determines the number of periods used to calculate the MFI.
The default value is 14, which is the traditional MFI setting.
Shorter Length
Examples: 5, 7, or 9
A shorter Length makes the MFI more responsive to recent price and volume changes.
It can be useful for:
Short-term trading
Scalping
Identifying faster changes in buying and selling pressure
However, shorter settings can also produce more fluctuations and potentially more false signals, especially in highly volatile markets.
Default Length
14 periods
This is the traditional MFI setting and provides a balanced starting point for different markets and timeframes.
Longer Length
Examples: 21, 30, or 50
A longer Length makes the indicator smoother and less sensitive to short-term price and volume fluctuations.
It can be useful for:
Swing trading
Broader trend analysis
Reducing short-term market noise
Keep in mind that a longer Length can also make the indicator react more slowly to changes.
How to Interpret the Levels
MFI Above 80
When the MFI moves above 80, the asset is traditionally considered to be in an overbought condition.
This does not automatically mean that the price will decline.
The MFI can remain above 80 during a strong uptrend. Therefore, price action and other technical factors should be considered before making a trading decision.
MFI Below 20
When the MFI moves below 20, the asset is traditionally considered to be in an oversold condition.
This does not automatically mean that the price will rise.
During a strong downtrend, the MFI can remain below 20 for an extended period.
MFI Between 20 and 80
When the MFI remains between 20 and 80, it is outside the traditional overbought and oversold zones.
The 50 level can be used as an additional reference to evaluate the relative balance between buying and selling pressure.
How to Use the Color Direction
One of the main visual features of this version is the color change of the MFI line according to its direction.
Green Line
When the MFI line is green, the current MFI value is higher than the previous value.
This indicates that money flow is increasing compared with the previous period.
It can be used as confirmation of increasing bullish momentum.
Red Line
When the MFI line is red, the current MFI value is lower than the previous value.
This indicates that money flow is decreasing compared with the previous period.
It can be used as confirmation of increasing bearish momentum.
Yellow Line
When the MFI line is yellow, the current MFI value is equal to the previous value.
In this situation, there has been no change in the MFI value between the two periods.
Example of a Potential Bullish Scenario
A possible bullish setup can occur when:
The MFI moves near or below 20.
The MFI begins to rise.
The line changes to green.
The MFI recovers above 20.
Price action provides additional confirmation of a potential recovery.
This combination can be used as part of a broader analysis of a potential reversal or recovery.
Example of a Potential Bearish Scenario
A possible bearish setup can occur when:
The MFI moves near or above 80.
The MFI begins to decline.
The line changes to red.
The MFI moves back below 80.
Price action provides additional confirmation of potential weakness.
This combination can be used as part of a broader analysis of a potential correction or reversal.
Failure Swings
The MFI can also be analyzed using patterns commonly known as Failure Swings.
Bullish Failure Swing
A traditional interpretation can occur when:
The MFI falls below 20.
The MFI moves back above 20.
The MFI pulls back again but remains above 20.
The MFI breaks above the previous high.
This behavior may indicate increasing buying pressure.
Bearish Failure Swing
A traditional interpretation can occur when:
The MFI rises above 80.
The MFI moves back below 80.
The MFI rebounds but remains below 80.
The MFI breaks below the previous low.
This behavior may indicate increasing selling pressure.
Suggested Settings
These settings are only general references and should be tested according to the asset and timeframe being used.
Short-Term / Scalping
Length: 5–9
Levels: 20 / 50 / 80
Day Trading
Length: 9–14
Levels: 20 / 50 / 80
Swing Trading
Length: 14–21
Levels: 20 / 50 / 80
Trend Analysis
Length: 21–50
Levels: 20 / 50 / 80
There is no universally optimal setting. MFI behavior depends on the asset, volume, volatility, and timeframe.
Recommended Use
The MFI should be used as a confirmation tool, rather than as a standalone source of buy or sell signals.
It can be combined with:
Market structure
Support and resistance
Trend analysis
Price action
Volume analysis
Moving averages
Divergences
Chart patterns
A touch or cross of the 20 or 80 levels should not automatically be interpreted as a buy or sell signal.
The MFI is generally more useful when combined with other technical analysis methods and price structure.
Limitations
The MFI is calculated from historical price and volume data. Therefore, it does not predict the future and can remain in overbought or oversold conditions during strong trends.
The line color only represents the direction of the MFI compared with the previous period. It does not, by itself, represent a confirmed buy or sell signal.
Parameters should be adapted and tested according to the asset and timeframe being analyzed.
TradingView Publishing Guidelines
This indicator was developed using Pine Script® v6.
For public publication on TradingView, the description should clearly explain the script's purpose, functionality, usage, and limitations.
The script should be presented accurately without misleading performance claims or guarantees of profitability.
Avoid claims such as:
Guaranteed profits
Guaranteed winning signals
Guaranteed accuracy
Unrealistic win rates
Promises of future performance
This indicator is intended as a technical analysis tool and should not be presented as financial advice.
Risk Disclaimer
This indicator is provided for educational and informational purposes only.
It is not financial, investment, or trading advice.
Past market behavior does not guarantee future results. Always conduct your own analysis and consider appropriate risk management before making any trading decision.
Trade responsibly. 指标

Order Book Ultimate# order book ultimate — synthetic depth, flow pressure and wall map
order book ultimate is a synthetic order book and market pressure tool for traders who want a visual way to study possible bid walls, ask walls, liquidity pressure, absorption, sweeps, imbalance and short-term directional bias.
this script does not read real exchange level 2 data, broker depth of market, or live limit order book data. it builds a synthetic depth model from chart price action, volume, volatility, round-number behavior, intrabar flow when available, and recent reactions around price levels. the goal is to help traders visualize where pressure may be building, where price may react, and when a setup has enough agreement between multiple conditions to deserve attention.
the script is designed as a decision-support tool, not as an automatic trading system. it should be used with market structure, risk management, and personal validation.
---
## what this script does
order book ultimate combines several components into one workflow:
* synthetic bid and ask depth levels around current price
* estimated bid/ask pressure using volume and candle position
* optional lower-timeframe intrabar flow analysis
* wall detection and wall stability tracking
* historical liquidity memory zones
* absorption detection near bid or ask walls
* bullish and bearish sweep detection
* pro score and confidence score
* market regime filter
* visual long and short setup markers
* visual stats for signal follow-up
* compact, full and debug dashboard modes
* alerts for stable walls, imbalance, setups, absorption, sweeps and invalidation
the main idea is to avoid reading one signal alone. the script looks for agreement between pressure, depth imbalance, wall strength, trend, obv flow, absorption, sweeps and market regime.
---
## important note about the order book model
this is a synthetic order book model.
it does not show the real resting orders from an exchange. instead, it estimates possible liquidity concentration by using:
* atr-based spacing
* recent volume
* candle rejection behavior
* round-number magnetism
* intrabar buy/sell pressure when available
* historical reactions around price
* volatility and market regime adjustments
because of this, the script should be treated as a market pressure map, not as real dom or level 2 data.
---
# engine modes
## engine mode
this setting controls how the script measures market pressure.
### classic synthetic
uses the current chart candles only. it estimates buy and sell pressure from candle position, volume, delta approximation and recent flow.
best for:
* higher timeframes
* symbols where lower-timeframe data is not needed
* cleaner and lighter calculations
### intrabar flow
uses lower-timeframe candles inside the current candle to estimate pressure more closely.
best for:
* scalping
* intraday trading
* checking whether the current candle has strong internal buying or selling pressure
### hybrid pro
combines classic synthetic pressure with lower-timeframe intrabar flow. this is the default balanced mode.
best for:
* most traders
* 5m, 15m, 30m and 1h charts
* users who want both stable context and intrabar sensitivity
---
## lower timeframe
this is the lower timeframe used by the intrabar flow engine.
example:
* if your chart is 15m and lower timeframe is 1m, the script studies the 1m candles inside each 15m candle.
* if your chart is 5m and lower timeframe is 1m, it studies the 1m movement inside each 5m candle.
beginner tip:
use 1m for scalping and 3m or 5m for smoother intraday reading.
---
## intrabar weight in hybrid
this controls how much the hybrid engine trusts lower-timeframe flow.
* 0.00 means almost no intrabar influence.
* 0.55 gives a balanced mix.
* 1.00 gives maximum intrabar influence.
beginner tip:
keep it near 0.50 to 0.60 for a balanced setup. raise it only if you want more reactive signals.
---
## use confirmed bars for signals
when enabled, signals only confirm after the candle closes.
this helps reduce noisy live-bar signals. when disabled, signals can appear during the current candle, but they may change before the candle closes.
beginner tip:
keep this enabled if you want cleaner signals.
---
# synthetic depth engine
## levels per side
this controls how many synthetic bid levels and ask levels are calculated around price.
* lower values make the display simpler.
* higher values create a wider synthetic depth map.
beginner tip:
15 is a good balanced setting.
---
## level spacing x atr
this controls the spacing between synthetic levels using atr.
* lower values place levels closer to current price.
* higher values spread them farther away.
beginner tip:
use lower values for scalping and higher values for swing trading.
---
## volume lookback
this sets how many candles are used to build the average volume baseline.
* shorter lookback reacts faster.
* longer lookback is smoother.
beginner tip:
100 is a balanced value for most intraday charts.
---
## refresh rate
this controls how often the synthetic depth levels refresh.
* 1 refreshes every bar.
* higher values refresh less often.
beginner tip:
keep it at 1 for active trading.
---
## depth multiplier
this increases or decreases the strength of the synthetic depth zones.
* higher values create stronger wall readings.
* lower values make the script more conservative.
beginner tip:
2.0 is a balanced default.
---
## depth decay sigma
this controls how quickly synthetic liquidity fades as price levels move farther from current price.
* lower values focus more on nearby levels.
* higher values include farther levels.
beginner tip:
use lower values for scalping and higher values for wider market context.
---
## liquidity memory bars
this tells the script how far back it should remember recent reactions around price levels.
* lower values focus on recent reactions.
* higher values keep more market memory.
beginner tip:
40 is a good starting point.
---
# round number engine
## round number magnetism
this increases the importance of round prices.
markets often react near round numbers because many traders place orders around them. this setting makes the synthetic depth engine give more weight to those areas.
beginner tip:
use higher values on indices and crypto, and lower values on forex if the levels feel too wide.
---
## auto round step
when enabled, the script automatically chooses a round-number step based on the symbol price.
beginner tip:
keep this enabled unless you know exactly which round levels you want to use.
---
## manual round step
this is used only when auto round step is disabled.
example:
* 100 for major crypto round zones
* 10 for some indices
* 1 or 0.5 for stocks depending on price
beginner tip:
leave it at 0.0 when auto round step is enabled.
---
## round zone width %
this controls how close price must be to a round level before the round-number magnet effect becomes important.
* lower values are stricter.
* higher values allow wider round-number zones.
beginner tip:
1.5 is a balanced default.
---
# flow / pressure engine
## delta length
this controls how many candles are used to estimate delta pressure.
* shorter length reacts faster.
* longer length is smoother.
beginner tip:
20 works well for general intraday use.
---
## obv ma length
this is the moving average length used for obv flow.
if obv is above its moving average, the script reads flow as more bullish. if it is below, flow is more bearish.
beginner tip:
20 is a good default.
---
## pressure smoothing
this smooths the pressure reading.
* low values react faster.
* high values reduce noise.
beginner tip:
5 is a balanced value.
---
# wall stability / memory
## wall stable bars
this controls how many bars a wall must remain active before it is considered stable.
* lower values confirm faster.
* higher values require more persistence.
beginner tip:
3 is a good starting point.
---
## same wall zone x tick
this controls how close a new wall must be to the previous wall to be treated as the same wall.
* lower values separate walls more strictly.
* higher values merge nearby walls more easily.
beginner tip:
3.0 is balanced.
---
## max historical zones
this controls how many historical wall zones are kept in memory.
beginner tip:
12 keeps the chart useful without too much clutter.
---
## historical merge x tick
this controls how close historical zones must be to merge together.
* lower values create more separate zones.
* higher values combine nearby levels.
beginner tip:
6.0 is a balanced default.
---
## historical strength decay
this controls how slowly old historical zones lose strength.
* 1.0 means they do not decay.
* lower values make old zones fade faster.
beginner tip:
0.985 keeps useful memory while still allowing old zones to fade.
---
# absorption / sweep / filters
## anti-noise confirmation
when enabled, the script requires extra filters before confirming long or short setups.
it checks for enough volume, pressure agreement, stable walls, absorption or sweep context, and avoids low-liquidity conditions.
beginner tip:
keep this enabled for cleaner signals.
---
## min volume x avg
this is the minimum volume required compared to average volume.
example:
0.90 means current volume should be at least 90% of average volume.
beginner tip:
raise it if you want fewer but stronger signals.
---
## absorption volume x avg
this controls how much volume is required to detect absorption.
absorption means price touches or pushes into a wall area, but the candle shows rejection instead of clean continuation.
beginner tip:
1.20 is balanced. raise it for stricter absorption signals.
---
## absorption zone x atr
this controls how close price must be to a wall for absorption detection.
* lower values require price to be very close to the wall.
* higher values allow a wider absorption area.
beginner tip:
0.18 works well for many intraday charts.
---
## sweep zone x atr
this controls how far price must move beyond a wall before a sweep can be detected.
a bullish sweep happens when price moves below a bid wall or historical bid zone and then closes back above it.
a bearish sweep happens when price moves above an ask wall or historical ask zone and then closes back below it.
beginner tip:
0.10 is a good starting value.
---
## exhaustion rsi high
this level is used to warn when a long setup may be overextended.
if a long setup appears while rsi is very high and the candle shows rejection, the setup can be marked as exhausted.
beginner tip:
72 is a balanced default.
---
## exhaustion rsi low
this level is used to warn when a short setup may be overextended.
if a short setup appears while rsi is very low and the candle shows rejection, the setup can be marked as exhausted.
beginner tip:
28 is a balanced default.
---
# regime / asset calibration
## asset profile
this adjusts the behavior of the script for different markets.
available profiles:
* auto
* crypto
* forex
* index
* stock
* futures
* generic
auto reads the symbol type and applies a matching profile.
beginner tip:
use auto first. switch manually only if the script feels too sensitive or too slow on your market.
---
## auto-calibrate thresholds
when enabled, the script adjusts wall strength, round-number behavior and memory based on the selected asset profile.
beginner tip:
keep this enabled.
---
## adx length
this controls the adx calculation used to identify trending or ranging conditions.
beginner tip:
14 is a standard value.
---
## volatility baseline
this controls the baseline used to compare current volatility with normal volatility.
* lower values react faster.
* higher values are smoother.
beginner tip:
100 is a balanced setting.
---
# spread / range proxy
## spread display
this chooses how the script estimates spread or micro-range conditions.
### adaptive proxy
uses an adaptive estimate based on recent range.
### bar range
uses the full current candle range.
### atr micro
uses a small atr-based estimate.
beginner tip:
use adaptive proxy for most markets.
---
## adaptive spread factor
this controls the size of the adaptive spread proxy.
beginner tip:
0.05 is a balanced default. raise it if the spread reading looks too small.
---
# visual / panel
## show panel
shows or hides the dashboard.
the panel displays score, confidence, regime, bid/ask depth, pressure, wall state, absorption, sweeps, visual stats and more depending on the selected panel mode.
---
## panel mode
### compact
shows only the most important information.
best for:
* small screens
* clean charting
* quick decision making
### full
shows the complete dashboard.
best for:
* normal trading use
* studying pressure, walls, volume and flow
### debug
shows additional internal values.
best for:
* testing settings
* understanding how the engine is reacting
* advanced users
---
## panel position
chooses where the dashboard appears on the chart.
options:
* top right
* top left
* bottom right
* bottom left
---
## show best wall zones
when enabled, the script draws the strongest stable bid and ask wall zones on the chart.
bid wall zones appear below price and can act as possible support areas.
ask wall zones appear above price and can act as possible resistance areas.
---
## show signal markers
when enabled, the script plots markers for:
* long setup
* short setup
* bid absorption
* ask absorption
* bullish sweep
* bearish sweep
* invalidation
---
## wall zone forward bars
this controls how far the wall zone boxes extend into the future.
beginner tip:
30 is a good value for intraday charts.
---
## panel bg
sets the dashboard background color.
---
## bid color
sets the color used for bullish or bid-side elements.
---
## ask color
sets the color used for bearish or ask-side elements.
---
## neutral color
sets the color used for neutral readings.
---
## accent color
sets the color used for highlights and active dashboard elements.
---
## warning color
sets the color used for warnings, exhaustion and invalidation.
---
# alerts / scoring
## wall threshold x avg
this controls how strong a wall must be compared to the average depth before it is considered important.
* lower values create more wall signals.
* higher values require stronger walls.
beginner tip:
2.0 is a balanced default.
---
## imbalance threshold
this controls how strong the bid/ask imbalance must be before the script labels the market as bid heavy or ask heavy.
beginner tip:
1.6 is a good starting point.
---
## long bias score
this is the score level required for a long bias.
example:
70 means the pro score must reach 70 or higher before a long setup can be confirmed.
---
## short bias score
this is the score level required for a short bias.
example:
30 means the pro score must fall to 30 or lower before a short setup can be confirmed.
---
## min confidence
this is the minimum agreement score needed before the script confirms a setup.
confidence is based on agreement between pressure, imbalance, wall direction, trend, obv, intrabar quality, absorption, sweeps and regime.
beginner tip:
55 is a balanced default. raise it for stricter signals.
---
# visual backtest stats
## enable visual stats
when enabled, the script tracks basic visual follow-up stats after confirmed signals.
this is not a full strategy backtest. it is a visual stats module that checks whether a signal reaches an atr-based target or invalidation level within a chosen number of bars.
---
## target x atr
this controls the target distance used by visual stats.
example:
0.75 means the target is 0.75 atr from the signal price.
---
## invalidation x atr
this controls the invalidation distance used by visual stats.
example:
0.55 means the invalidation level is 0.55 atr from the signal price.
---
## max bars in signal
this controls how long the visual stats module gives a signal to reach target or invalidation.
if neither target nor invalidation is reached before this number of bars, the signal is closed by time.
---
# dashboard guide
## score
the score ranges from 0 to 100.
* above the long bias score: long bias
* below the short bias score: short bias
* between both levels: neutral
the score is built from pressure, imbalance, wall strength, trend, obv, rsi, absorption, sweep and regime.
---
## confidence
confidence measures how much agreement exists between the engine components.
a high score with low confidence should be treated carefully. a high score with strong confidence is cleaner.
---
## regime
the regime label describes the current market environment.
possible states include:
* high vol
* low liq
* breakout
* trending
* ranging
* balanced
beginner tip:
avoid forcing trades in low-liquidity conditions.
---
## bid / ask
this shows the estimated synthetic bid depth and ask depth.
if bid depth is much stronger than ask depth, the market may be bid heavy.
if ask depth is much stronger than bid depth, the market may be ask heavy.
---
## pressure
this shows whether buying or selling pressure is dominant.
pressure is not a signal by itself. it should agree with walls, imbalance and confidence.
---
## walls
this shows whether bid and ask walls are:
* none
* weak
* building
* holding
a holding wall is more important than a fresh or weak wall.
---
## abs / sweep
this shows whether absorption or a sweep is currently detected.
absorption can show rejection at a wall.
a sweep can show liquidity being taken before price returns.
---
## bt stats
this shows the visual stats result of recent confirmed signals.
it should be used for observation, not as proof of future performance.
---
# chart markers
## l marker
a long setup marker appears when the script confirms long bias conditions, confidence is high enough, and the noise filter allows the signal.
---
## s marker
a short setup marker appears when the script confirms short bias conditions, confidence is high enough, and the noise filter allows the signal.
---
## abs marker
an absorption marker appears when price interacts with a wall area with strong volume and rejection.
bid absorption appears below price.
ask absorption appears above price.
---
## sw marker
a sweep marker appears when price raids a wall or historical liquidity zone and then closes back through it.
bullish sweep appears below price.
bearish sweep appears above price.
---
## x marker
an invalidation marker appears when a setup is invalidated by price moving beyond the relevant wall area.
---
# available alerts
the script includes alerts for:
* stable synthetic bid wall
* stable synthetic ask wall
* bid heavy imbalance
* ask heavy imbalance
* long setup confirmed
* short setup confirmed
* bid absorption
* ask absorption
* bullish sweep
* bearish sweep
* setup invalidated
beginner tip:
start with only a few alerts. for example:
* stable bid wall
* stable ask wall
* long setup confirmed
* short setup confirmed
* bullish sweep
* bearish sweep
too many alerts can make the workflow noisy.
---
# beginner tutorial
## step 1 — choose the correct engine mode
start with hybrid pro.
hybrid pro is the most balanced mode because it combines classic chart pressure with lower-timeframe flow.
use classic synthetic if you want a smoother reading.
use intrabar flow if you want maximum short-term sensitivity.
---
## step 2 — choose the lower timeframe
for a 15m chart, start with 1m or 3m.
for a 5m chart, start with 1m.
for a 1h chart, try 5m or 15m.
if the script feels too reactive, use a higher lower-timeframe setting or lower the intrabar weight.
---
## step 3 — read the panel first
before looking at markers, read the panel:
1. check the market regime.
2. check the score.
3. check confidence.
4. check bid/ask imbalance.
5. check pressure.
6. check wall state.
7. check absorption or sweep.
do not take a marker if the panel does not make sense.
---
## step 4 — use walls as zones, not exact entries
a stable bid wall can act as a possible support area.
a stable ask wall can act as a possible resistance area.
price may react around the zone, not exactly at one tick.
---
## step 5 — wait for context
a better long idea usually has:
* stable bid wall
* bid-heavy or improving depth
* positive pressure
* bullish sweep or bid absorption
* score above the long bias level
* confidence above the minimum
a better short idea usually has:
* stable ask wall
* ask-heavy or weakening bid depth
* negative pressure
* bearish sweep or ask absorption
* score below the short bias level
* confidence above the minimum
---
# example use cases
## example 1 — bullish wall reaction
price moves down into a stable bid wall.
the panel shows:
* bid wall holding
* bid/ask ratio improving
* pressure turning positive
* confidence rising
* bid absorption appears
a trader may wait for price to hold above the wall and then look for a long setup marker.
possible invalidation:
price closes below the bid wall area and an invalidation marker appears.
---
## example 2 — bearish wall rejection
price moves up into a stable ask wall.
the panel shows:
* ask wall holding
* ask-heavy imbalance
* pressure turning negative
* ask absorption appears
* confidence is above the minimum
a trader may wait for rejection from the ask wall and a short setup marker.
possible invalidation:
price closes above the ask wall area.
---
## example 3 — bullish sweep
price moves below a bid wall or historical bid zone and then closes back above it.
the script marks a bullish sweep.
this can mean sellers pushed price below liquidity, but buyers absorbed the move and price returned above the zone.
a trader may then check:
* is pressure improving?
* is confidence strong enough?
* is the score moving toward long bias?
* is the market not in low-liquidity mode?
---
## example 4 — bearish sweep
price moves above an ask wall or historical ask zone and then closes back below it.
the script marks a bearish sweep.
this can mean buyers pushed price above liquidity, but sellers absorbed the move and price returned below the zone.
a trader may then check:
* is pressure weakening?
* is ask absorption present?
* is confidence strong enough?
* is the score moving toward short bias?
---
## example 5 — avoiding a weak signal
a long marker appears, but the panel shows:
* low liquidity regime
* weak confidence
* no stable bid wall
* no absorption
* no sweep
this is a low-quality context.
the better choice is to wait for stronger agreement.
---
## example 6 — using visual stats
enable visual stats and keep default atr target and invalidation settings.
after each confirmed setup, the panel tracks whether price reached the target, invalidation or timed out.
this is useful for studying the behavior of the signals on your market, but it is not a complete strategy backtest.
---
# suggested starting settings
## scalping
chart:
1m to 5m
settings:
* engine mode: hybrid pro
* lower timeframe: 1m
* intrabar weight: 0.55 to 0.70
* use confirmed bars: enabled
* wall threshold: 2.0 to 2.5
* min confidence: 60 to 70
* panel mode: compact or full
best use:
watch for stable walls, sweeps and absorption during active sessions.
---
## intraday
chart:
5m to 30m
settings:
* engine mode: hybrid pro
* lower timeframe: 1m to 5m
* intrabar weight: 0.45 to 0.60
* use confirmed bars: enabled
* wall stable bars: 3 to 5
* min confidence: 55 to 65
* panel mode: full
best use:
use stable walls as reaction zones and wait for score plus confidence agreement.
---
## swing or higher timeframe
chart:
1h to 4h
settings:
* engine mode: classic synthetic or hybrid pro
* lower timeframe: 5m to 15m
* intrabar weight: 0.25 to 0.45
* volume lookback: 100 to 200
* liquidity memory bars: 60 to 120
* panel mode: full
best use:
focus on larger wall zones, market regime and historical liquidity memory.
---
# practical workflow
1. open the chart and choose the market.
2. set engine mode to hybrid pro.
3. choose a lower timeframe smaller than the chart timeframe.
4. keep confirmed bars enabled.
5. check the panel regime.
6. wait for a stable wall.
7. watch bid/ask imbalance and pressure.
8. wait for absorption, sweep or a confirmed setup marker.
9. define invalidation around the wall zone.
10. use visual stats to observe signal behavior over time.
---
# limitations
this script uses synthetic calculations. it does not access real order book liquidity, real level 2 data, broker depth, or exchange resting orders.
signals may perform differently depending on symbol, timeframe, session, liquidity and volatility.
visual stats are only a simple chart-based follow-up tool. they are not a full trading strategy backtest.
the script should be combined with risk management, market structure, session context and personal testing.
---
# risk notice
this indicator is for technical analysis and education. it does not provide financial advice and does not guarantee future results. every trader is responsible for their own decisions, risk management and testing.
指标

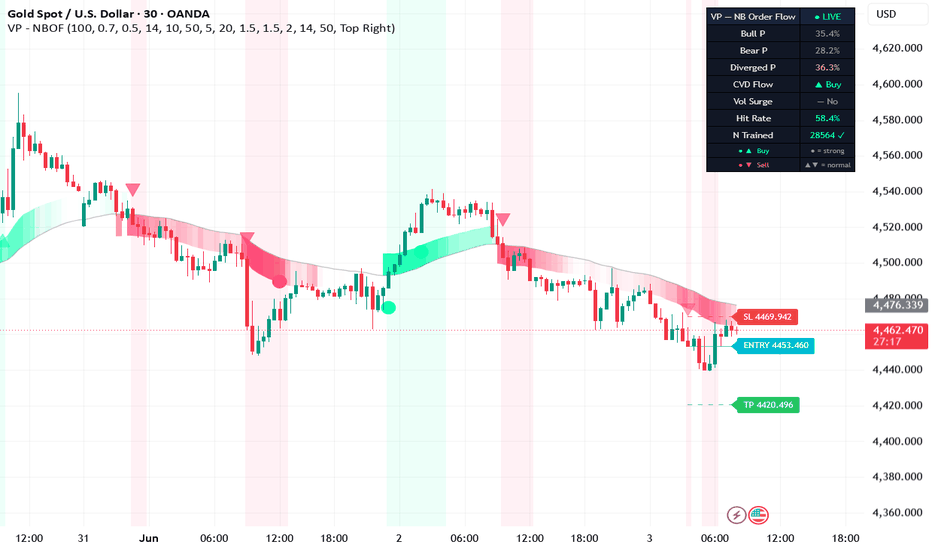
Viprasol Naive Bayes Order FlowOverview
This indicator is based on "Institutional Order Flow Signals " by PMT, an open-source script that classifies order-flow conditions with a Naive Bayes classifier trained on Cumulative Volume Delta (CVD) features. The original produces a posterior probability that the current bar belongs to a Bull, Bear, or Diverged regime, then prints directional signals when that probability clears a threshold and price agrees with a trend EMA. This version keeps that classifier intact and layers a Viprasol signal-filter stack on top: a signal cooldown, an optional volume-surge confluence requirement, a bar-close confirmation gate, live classifier hit-rate tracking, and regime-flip detection.
It is built for traders who want a probabilistic read on whether buying or selling pressure (measured through volume delta) is currently dominating, with explicit noise controls applied before any signal fires.
How It Works
Cumulative Volume Delta (from original):
Each bar's volume is split into buying and selling pressure by where the close sits inside the bar's range. Buy volume = volume × (close − low) / range; sell volume = volume × (high − close) / range. The bar delta is buy minus sell, and these deltas are summed into a running CVD line. CVD rising means net buying pressure is accumulating; falling means net selling.
Three Classifier Features (from original):
The classifier is trained on three z-score-normalised features so they are comparable across instruments:
- F1 — CVD rate of change over the momentum period, normalised against its own rolling mean and standard deviation.
- F2 — price/flow divergence: price ROC minus CVD ROC, normalised. Large values flag price moving without matching flow (or vice versa).
- F3 — CVD slope: the first difference of a linear regression on the CVD line, normalised. Captures the acceleration of flow.
Naive Bayes Classification (from original):
Every bar is labelled into one of three classes from the prior bar's outcome — Bull (price up and CVD up), Bear (price down and CVD down), or Diverged (anything else). For each class the script maintains running sums of each feature and each feature squared, from which it derives a per-class mean and standard deviation online (no arrays of history needed). The likelihood of the current feature vector under each class is the product of three Gaussian PDFs (the "naive" independence assumption). Combined with class priors (the observed class frequencies), Bayes' rule yields the posterior probability of each class:
posterior(class) = prior(class) × likelihood(class) / evidence
A signal requires the posterior to clear the entry threshold, price to be on the correct side of the trend EMA, and CVD to be moving in the signal's direction. Signals fire only on the first bar of a new cluster to avoid consecutive repeats.
Signal Cooldown (new):
After any signal fires, a configurable number of bars must elapse before the next signal of any direction is allowed, tracked as bar_index − lastSignalBar >= cooldown. During fast moves the classifier can re-cross the threshold repeatedly; the cooldown collapses those into one actionable signal. A cooldown of 5 bars on a 15-minute chart enforces a 75-minute minimum gap between entries.
Volume-Surge Confluence (new):
When enabled, a signal is additionally gated on current volume exceeding its rolling average by a multiplier (default 1.5×). The logic is volume > sma(volume, length) × multiplier. This filters out classifier signals that occur on thin participation, where flow estimates are least reliable.
Bar-Close Confirmation (new):
When enabled, signals are only confirmed on a fully closed bar (barstate.isconfirmed). Because the posterior and CVD update intrabar, a developing bar can flip in and out of a signal state before it closes; this gate holds the signal until the bar settles.
Classifier Hit-Rate Tracking (new):
On every live bar the script takes the argmax of the three posteriors as its prediction, then on the following bar compares that prediction to the realised class label. It accumulates a running hit count and evaluation count and displays the ratio as a live "Hit Rate" in the dashboard. This is an honest in-sample diagnostic of how often the classifier's single most-likely class matched the next realised label — not a trade win rate.
Regime-Flip Detection (new):
The script tracks the active regime (+1 bull, −1 bear, 0 neutral) and fires a dedicated alert whenever it transitions into a new bull or bear regime, independent of the entry-cluster logic. Useful for traders who want to be notified of context shifts rather than individual entries.
Diverged Class Surfaced (new):
The original computes a third "Diverged" class but never displays its posterior. This version surfaces P(Diverged) in the dashboard so the trader can see when the classifier considers the tape conflicted (price and flow disagreeing) rather than directional.
What Is Original (Viprasol Additions)
1. Signal cooldown system — enforces a minimum bar gap between signals to prevent clustering during fast moves.
2. Volume-surge confluence filter — optionally requires above-average volume on the signal bar so signals occur on real participation.
3. Bar-close confirmation gate — optionally holds signals until the bar closes, removing intrabar flip-flop.
4. Classifier hit-rate tracking — online comparison of the argmax-posterior prediction to the next realised class, displayed live.
5. Regime-flip detection — separate state machine and alert for bull/bear regime transitions.
6. Diverged-class posterior surfaced in the dashboard, exposing the third class the original computed but hid.
Key Features
From the Original (PMT):
- CVD line built from close-position volume splitting
- Three z-score-normalised classifier features (CVD ROC, price/flow divergence, CVD slope)
- Online Naive Bayes classifier over Bull / Bear / Diverged classes with Gaussian likelihoods
- Posterior-probability entry threshold with trend-EMA and CVD-direction agreement
- Confidence tiers (high / mid / normal) driving signal shape and band opacity
- Confidence-scaled posterior band and regime background shading
- ATR-based SL/TP projection lines
- Warmup gate (LIVE only after the classifier has trained on enough bars)
- Zen mode for clean screenshots
Added in This Version (Viprasol):
- Signal cooldown, volume-surge confluence, and bar-close confirmation filters
- Live classifier hit-rate diagnostic
- Regime-flip detection and alert
- Diverged-class posterior in the dashboard
- Colored TP / ENTRY / SL price labels on the projection lines
- Expanded info dashboard with selectable position
- Six alert conditions with dynamic {{ticker}} / {{close}} / {{interval}} messages
How to Use
Getting Started:
1. Add to a standard candlestick chart (not Heikin Ashi).
2. Wait for the dashboard to read LIVE — the classifier needs to train on enough bars first (status shows WARMUP and an N-trained counter until then).
3. Long signals print below the bar (circle = high conviction, triangle = normal); short signals print above the bar.
Reading the Dashboard:
- Bull P / Bear P / Diverged P — the three class posteriors. The dominant one drives the regime.
- CVD Flow — whether net delta is currently rising (buy) or falling (sell).
- Vol Surge — whether the current bar cleared the volume-surge threshold.
- Hit Rate — share of bars where the most-likely class matched the next realised class.
- N Trained — how many bars the classifier has trained on; ✓ once warmed up.
Recommended Starting Points:
- Crypto/Forex (5m-15m): Lookback 100, Threshold 0.70, Cooldown 3
- Stocks (15m-1H): Lookback 120, Threshold 0.72, Cooldown 5
- Indices (1H-4H): Lookback 150, Threshold 0.75, Cooldown 8
These are starting points only. Volume data quality and tape behaviour differ by instrument — backtest and adjust before trading live.
Settings
Naive Bayes Classifier: classifier lookback (bars before signals go live), entry threshold (minimum posterior), and prior bull probability.
CVD Features: CVD momentum period, CVD slope period, and the z-score normalisation window applied to all features.
Signal Filters (Viprasol): signal cooldown in bars, bar-close confirmation toggle, volume-surge requirement with average length and multiplier.
Signal Levels: show SL/TP lines, show price labels, SL ATR multiplier, risk:reward ratio, ATR period, and trend EMA period.
Visual: posterior band toggle, regime background toggle, and bull / bear / diverged colors.
Dashboard / Display: Zen mode, dashboard toggle, and dashboard position.
Alerts
1. Long Signal — bull posterior cleared the threshold with CVD rising and all filters passed
2. Short Signal — bear posterior cleared the threshold with CVD falling and all filters passed
3. Any Signal — either direction fired
4. High-Conviction Long — long signal with P(Bull) at or above 85%
5. High-Conviction Short — short signal with P(Bear) at or above 85%
6. Regime Flip — the active regime transitioned into a new bull or bear state
All alerts include {{ticker}}, {{close}}, and {{interval}} for dynamic notification messages.
Limitations & Disclaimer
- The classifier trains in-sample on the chart's own history and updates continuously; the displayed hit rate is a diagnostic of class-label agreement, not a trade win rate, and is not predictive of future results.
- CVD here is approximated from candle range and volume, not from true bid/ask tick data. Volume quality varies by broker and instrument, so the same symbol on different feeds can produce different signals.
- The classifier needs a warmup period before signals appear; on fresh charts or low-history symbols it may stay in WARMUP for a long time.
- Posteriors and CVD update intrabar; without bar-close confirmation enabled, signals can appear and disappear before a bar closes.
- SL/TP lines and price labels are visual references only — they do not place or manage trades.
- Filters reduce noise but also reduce signal count; in fast trends the cooldown may delay otherwise valid entries.
- Past performance does not guarantee future results. This indicator is for educational and analytical purposes only and is not financial advice. Always use proper risk management and test on historical data before trading live.
Credits & Attribution
Based on "Institutional Order Flow Signals " by PMT, which provided the CVD construction, the three z-score-normalised classifier features (CVD ROC, price/flow divergence, CVD slope), the online Naive Bayes classifier over Bull/Bear/Diverged classes with Gaussian likelihoods, the posterior-threshold entry logic with trend-EMA and CVD agreement, the confidence tiers, the posterior band and regime background, and the ATR-based SL/TP projection lines. Added by Viprasol: signal cooldown, volume-surge confluence filter, bar-close confirmation gate, live classifier hit-rate tracking, regime-flip detection and alert, the surfaced Diverged-class posterior, TP/ENTRY/SL price labels, an expanded dashboard, and a six-condition dynamic alert set.
Published open-source per TradingView House Rules.
指标
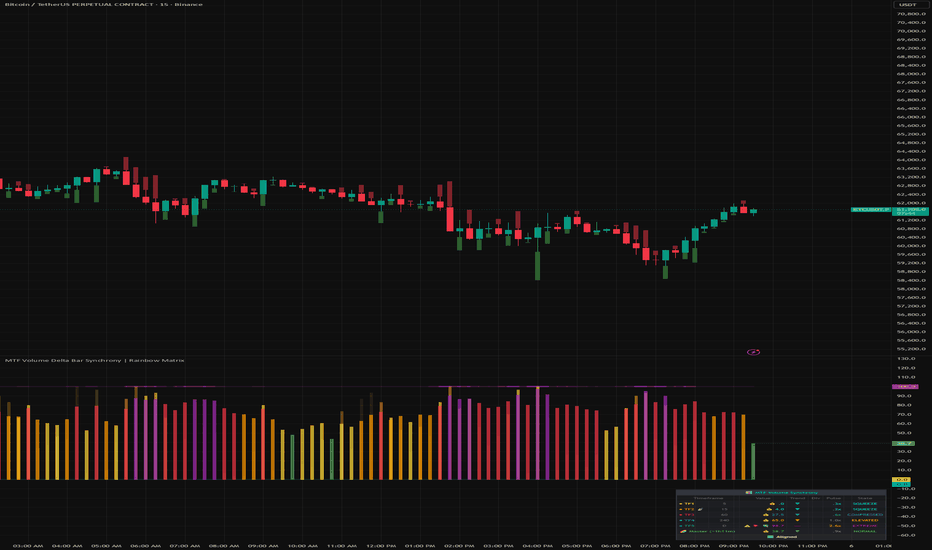
MTF Volume Delta Bar Synchrony | Rainbow MatrixGENERAL OVERVIEW
MTF Volume Delta Bar Synchrony is a multi-timeframe volume percentile fusion oscillator that condenses five independent volume readings — one per Fibonacci-spaced timeframe — into a single weighted Master Line, surrounded by per-TF "ghost lines" that fade visually as they diverge from the consensus. When the five timeframes align, the rainbow becomes a solid band; when they spread apart, the disagreement becomes a visible density property of the indicator itself. A compact 7×9 MTF Legend Table surfaces every dimension simultaneously: per-TF volume percentile values, trend direction, divergence flags, Pulse magnitude ratio, and named State classification — with an antenna marker flagging the row whose timeframe matches your chart's native resolution.
Optional Delta Twin Bars project per-candle directional overlays directly onto the price chart via force_overlay=true, combining the oscillator pane and an order-flow approximation in a single indicator. A hybrid Black Swan zone detects volume climax (surge) and squeeze (drought) extremes — either as static 80/20 thresholds (classic) or as a dynamic Fibonacci-scaled channel that adapts to recent volatility. A classic price↔volume divergence engine detects Wyckoff-style "no demand" rallies and selling-climax bottoms on every timeframe and on the Master line.
Designed as a sibling to the MTF RSI Synchrony indicator. Apply both side-by-side for the complete momentum + volume picture: RSI shows where price sits in its momentum range; Volume Synchrony shows whether the move has institutional backing. Same visual signature, same canonical color zones, same Legend Table layout — instant cross-indicator readability.
WHAT IS THE THEORY BEHIND THIS INDICATOR
Most volume indicators on TradingView operate on a single timeframe — volume bars, OBV, CVD approximations — and report raw, unbounded volume values that vary wildly across timescales. A 5-minute volume bar of 50,000 contracts is meaningless without context: is that "high" for 5-minute bars on this asset, or "low"? Compared to what window? A trader watching a 5-minute chart cannot intuitively cross-reference whether that surge corresponds to anything notable on the 4-hour view.
This indicator solves the cross-timescale comparison problem by bounding every volume reading to a 0-100 percentile rank: the same scale, regardless of timeframe, regardless of asset. The percentile answers a single question: "where does this bar's volume sit in the distribution of recent volume on this timeframe?" — a number anyone can read at a glance.
Five percentile readings are then fused via canonical Fibonacci weights (0.15 / 0.20 / 0.25 / 0.25 / 0.15 — peak weight on the macro TF3/TF4 where institutional consolidation tends to occur) into a single weighted Master Line. The Master adapts to a self-calibrating Fibonacci channel built from its own highest/lowest values over a configurable lookback, smoothed by EMA. Channel boundaries use the brand's canonical ratios: Z-Breathing (1.50σ), Z-Alert (1.85σ anchor), Z-Exhaustion (2.75σ), Black Swan (3.85σ) — same proportions as the RSI sibling for cross-indicator consistency.
The result is a volume picture that updates in real time, accounts for five timescales simultaneously, encodes "synchrony" itself as a visible rainbow density property, and triggers as an alertable signal when extremes converge.
FEATURES
🔹 Multi-Timeframe Volume Percentile Fusion Engine
🔹 Adaptive Fibonacci Channel (Z-Breathing → Z-Alert → Z-Exhaustion → Black Swan)
🔹 Hybrid Black Swan Zones (static 80/20 or dynamic Fibonacci-scaled)
🔹 Classic Price↔Volume Divergence Detection (per-TF + Master)
🔹 MTF Legend Table (7 columns × 9 rows, multilingual)
🔹 Volume Profile Reading (Pulse magnitude + State classification — 7-tier vocabulary)
🔹 Delta Twin Bars (per-candle chart overlay with 4 display modes + live intra-bar updates)
🔹 Multilingual Interface (EN / PT / ES / RU / ZH)
🔹 Multi-Timeframe Volume Percentile Fusion Engine
What It Does
Aggregates five independent volume percentile readings — one per Fibonacci-spaced timeframe — into a single weighted Master Line. Each per-TF reading is plotted as a "ghost" line that fades by distance to the Master, so the rainbow becomes a visual representation of multi-timeframe consensus.
Method
Default timeframes are 5 / 15 / 60 / 240 / D (Trigger / Intraday / Macro 1 / Macro 2 / Base). On each timeframe, ta.percentrank(volume, length) produces a 0-100 percentile rank with lookahead=barmerge.lookahead_off for anti-repaint integrity. The five percentiles are fused via canonical Fibonacci weights (0.15 / 0.20 / 0.25 / 0.25 / 0.15 — peak weight on TF3 and TF4 where institutional volume tends to consolidate). The Master itself is then clamped to for pane containment.
Per-TF length defaults are tuned to each timeframe's natural look-back window:
◇ TF1 (5m): 30 bars = 2.5 hours
◇ TF2 (15m): 50 bars = 12.5 hours
◇ TF3 (60m): 80 bars = 3.3 days
◇ TF4 (240m): 100 bars = 16 days
◇ TF5 (D): 150 bars = ~5 months
Set any per-TF override to 0 to inherit the global default (50). One-size-fits-all 50 bars across timeframes either lags on TF1 (16 hours of stale 5-minute history) or feels too reactive on TF5; the per-TF defaults match each horizon's natural cadence.
Why It Matters
Volume distribution is regime-dependent and timeframe-dependent. A single timeframe view can miss whether a 5-minute volume surge is the leading edge of a broader institutional move (visible on TF3/TF4) or a one-off scalper spike. The fusion engine surfaces alignment and disagreement instantly.
🔹 Adaptive Fibonacci Channel
What It Does
Renders six color-coded bands around the Master Line that adapt to its own recent volatility, using the brand's canonical Fibonacci ratios.
Method
Highest/lowest of the Master over lookback_dyn bars (default 50) are smoothed by EMA (default 10) to form dyn_up and dyn_dn. Channel bands are placed at canonical Fibonacci proportions:
◇ Z-Breathing: 1.50/1.85 ≈ 0.811 of half-channel
◇ Z-Alert: anchor at 1.85σ (the channel boundary itself)
◇ Z-Exhaustion: 2.75/1.85 ≈ 1.486
◇ Black Swan: 3.85/1.85 ≈ 2.081
All six band values are mathematically clamped to before rendering, so the rainbow stays inside the visible pane in volatile regimes (no auto-scale stretching). The algorithm itself is preserved bit-exact; only the rendered values are bounded.
Why It Matters
Static thresholds (e.g., 80/20) cannot adapt to regime changes. During a low-volatility consolidation, "70" might be a meaningful surge; during a news-driven trend, "70" might be the new baseline. The Fibonacci channel calibrates the warning levels to the asset's current regime, so the alerts stay informative regardless of market state.
🔹 Hybrid Black Swan Zones
What It Does
Flags volume climax (surge) and squeeze (drought) extremes either at static 80/20 thresholds (top 20% / bottom 20% historically) or at the dynamic Fibonacci 3.85σ band, depending on the operator's preference. Each zone is rendered as a glow line that brightens proportionally as the Master approaches.
Method
By default, Dynamic Black Swan Mode is ON for this indicator (matching the volume distribution's wider range vs canonical RSI). The Black Swan high/low values become osc_up4 / osc_dn4 — the Fibonacci 3.85σ proportion of the Master's channel. Toggle the mode OFF to revert to static 80/20 (top/bottom 20% volume thresholds — classic).
The proximity glow uses the canonical f_calc_glow pattern: transparency = 95 - (1 - dist/range) × 75, where range is the half-channel width. At zero distance, transparency = 20 (solid); at full range distance, transparency = 95 (invisible).
Why It Matters
Black Swan events on volume mark institutional climax moments — news breakouts, capitulation, distribution. The dynamic mode lets the indicator self-calibrate per asset and per regime, so a "climax" on a calm Forex pair and a "climax" on a meme stock both trigger at the appropriate statistical extremes rather than at an arbitrary 80% line.
🔹 Classic Price↔Volume Divergence Detection
What It Does
Detects regular bear divergences (price makes higher high while volume percentile pivot makes lower high — Wyckoff "no demand" rally) and regular bull divergences (price makes lower low while volume percentile pivot makes higher low — selling climax / capitulation). Runs on every individual timeframe AND on the Master line directly.
Method
For each TF, f_classic_divergence_vol(length, lookback) runs inside request.security: it detects pivot highs/lows on the per-TF volume percentile via ta.pivothigh / ta.pivotlow, captures pivot values using ta.valuewhen, and compares the current pivot vs the previous pivot. Default pivot lookback is 5 bars (matches the community standard).
Master divergence runs on the chart-TF directly (no request.security), so it always reflects the current chart resolution's pivot structure. When detected, it renders a connecting line + label between the two pivots on the indicator pane (red for bear, green for bull) and triggers the alert_divergence_native alert if enabled.
Per-TF divergence surfaces in the Legend Table's "Div" column: 🔻 for bear, 🔺 for bull, — for none. Multiple timeframes showing the same divergence direction = stronger conviction signal.
Why It Matters
Divergences between price and volume have been a cornerstone of Wyckoff/Volume Spread Analysis for decades. Most TradingView divergence indicators run on a single timeframe — by detecting per-TF AND Master simultaneously, this indicator surfaces both fast warnings (TF1 divergence) and high-conviction confirmations (Master + multiple TFs aligning).
🔹 MTF Legend Table
What It Does
Compact 7×9 table positioned in a configurable chart corner. Surfaces every dimension of the analysis at a single glance: per-TF resolutions, volume percentile values, trend direction, divergence status, Pulse magnitude, named State classification, plus a Master row and a status row.
Method
The table is rendered via table.new(force_overlay=false) on the indicator pane (kept off the price chart for mobile readability). Per-TF cells use:
◇ Col 0: ● TF label (matches ghost line color) + 📡 antenna marker if this TF == chart's native resolution
◇ Col 1: TF resolution string ("5", "15", "60", "240", "D"...)
◇ Col 2: Volume percentile value (color-coded by zone via the thermal matrix)
◇ Col 3: Trend arrow ▲ rising / ▼ falling / ▬ flat (±0.5 percentile point deadzone to avoid flicker)
◇ Col 4: Div indicator 🔺 bull / 🔻 bear / — none
◇ Col 5: Pulse magnitude ratio (color-coded by intensity tier)
◇ Col 6: State name (multilingual EXTREME / HIGH / ELEVATED / NORMAL / LOW / COMPRESSED / SQUEEZE)
The Master row (row 7) merges cols 0-1 into "🌈 Master (~XhYm)" — the "~XhYm" suffix is the geometric weighted mean of the 5 TF resolutions (same weights as the Master volume fusion), giving you the "effective timeframe" the Master is reading. The status row (row 8) merges cols 0-6 and shows the MTF Divergence summary: Aligned / Strong Top / Strong Bottom / Moderate Top / Moderate Bottom — with background color matching the severity.
All header strings, status messages, and state names support 5 languages via the System Language input (English / Português / Español / Русский / 中文).
Why It Matters
The Legend Table compresses what would otherwise require 5 separate chart panels into a single ~150-pixel-wide compact widget. The antenna marker is especially useful on mobile: it tells you instantly which row is "your" timeframe, so you can scan up/down to see whether faster/slower TFs confirm or contradict.
🔹 Volume Profile Reading — Pulse Magnitude + State Classification
What It Does
Two complementary readings that answer different questions about volume — both surfaced as dedicated columns in the Legend Table.
Method — Pulse Column
Pulse is the ratio volume / SMA(volume, length) per TF. 1.0× = volume at the baseline; below = drought; above = elevated. Color-coded by intensity tier:
◇ < 0.5× → aqua (drought extreme)
◇ 0.5-0.8× → teal (below baseline)
◇ 0.8-1.3× → gray (typical)
◇ 1.3-2.0× → yellow (elevated)
◇ 2.0-3.5× → orange (high activity)
◇ 3.5-6.0× → red (surge)
◇ ≥ 6.0× → purple (climax extreme)
Pulse values cap display at "9.9x+" to avoid overflow in narrow cells.
Method — State Column
State classifies the percentile rank into 7 named tiers using a multilingual dictionary:
◇ ≥ 85 → EXTREME (purple zone — top 15% historically)
◇ 71-85 → HIGH (red — top 30%)
◇ 62-71 → ELEVATED (orange)
◇ 38-62 → NORMAL (yellow / green — middle 24%)
◇ 29-38 → LOW (teal)
◇ 15-29 → COMPRESSED (blue)
◇ ≤ 15 → SQUEEZE (aqua — bottom 15%)
Why It Matters
Pulse and State answer different questions about the same volume reading:
◇ Value (percentile column 2): "Where in the historical distribution?" — a ranking answer.
◇ Pulse (column 5): "How intense vs recent baseline?" — a magnitude answer.
◇ State (column 6): "What's the human-readable label?" — a vocabulary answer.
These three columns together tell a complete story. A bar can be at Percentile 60 (NORMAL state) with Pulse = 3.5x (red surge) — meaning: "this bar's volume isn't historically rare, but it's a massive jump versus what's been happening recently." That's a different signal than Percentile 95 / Pulse = 1.0x (EXTREME state but typical magnitude) — meaning: "this is a rare historical bar, but the magnitude is normal relative to recent activity." The columns disambiguate.
🔹 Delta Twin Bars (Chart Overlay)
What It Does
Renders per-candle directional bars on the price chart (via force_overlay=true) whose dimensions encode the selected volume score and whose color encodes buy/sell pressure approximation. Bridges the gap between this script's oscillator pane and the price action itself.
Method
For each candle, the bar size = candle_range × (score / 100) × user_multiplier. The score source is configurable (Master or any TF1-TF5; default TF1 Trigger for the most responsive read).
Four display modes:
◇ Fixed High: bar always projects above the candle high (regardless of direction)
◇ Fixed Low: bar always projects below the candle low
◇ Dynamic: buy candles get bar above high, sell candles get bar below low (intuitive directional reading)
◇ Dynamic Inverted (default): buy candles get bar BELOW low, sell candles get bar ABOVE high — an order book metaphor where buy pressure builds support and sell pressure presses resistance
Bar color follows the user-configured buy/sell colors (green / red by default — matching the OHLC tick rule: close > open = buy bias, close < open = sell bias). An optional toggle ("Use Master Line Color") overrides this with the Master zone color via the thermal matrix — giving rainbow-colored bars that match the pane oscillator.
Bar width is pixel-controlled (1-8, default 8) via line.new with the user-selected linewidth — visually independent of chart zoom, distinguishable from candle wicks at any chart density.
Two update modes:
◇ Live (default): the current bar's twin bar updates on every tick — score, direction, and color reflect real-time data. When the bar closes, the live line is "frozen" into the confirmed pool. One additional persistent line is used (zero pool overhead).
◇ Confirmed-only: twin bar appears only when the candle closes (useful for backtesting comparisons where intra-bar flicker is unwanted).
The last 500 bars are rendered (Pine v6 line pool limit) with rolling FIFO management — older candles fall out of the pool and lose their twin bar, but the most recent 500 stay live.
🚨 Honest tick-rule disclosure
The buy/sell direction encoding uses the OHLC tick rule — close > open = buy bias, close < open = sell bias. This is NOT order-flow tick-data delta. Pine Script v6 has no tick-by-tick data access in indicator scripts on the free tier. The OHLC approximation is what virtually every "delta" indicator on TradingView free uses; this script discloses it transparently rather than claiming real order flow.
For most use cases (visual confirmation, trend bias, magnitude readings) the OHLC approximation captures the essential information. Traders who need true bid/ask delta should look at paid Order Flow tools or Sierra Chart / Bookmap.
Why It Matters
The Delta Twin Bars combine two analytical layers in a single indicator: the oscillator pane (Master fusion + ghost lines + Legend Table) and the chart overlay (per-candle directional reference). Most TradingView indicators force users to choose between oscillator-only or overlay-only paradigms; this script delivers both via force_overlay=true on selectively-rendered lines, preserving full pane functionality while adding a quick visual reference directly on the price candles.
🔹 Multilingual Interface
What It Does
Translates all HUD labels, status messages, alert text, state classifications, and Legend Table headers to 5 languages: English (default), Português, Español, Русский, 中文 (Chinese). 33 multilingual keys are maintained across all 5 languages.
Method
A single language dropdown input (in the GLOBAL SETTINGS group) selects the active language. The script uses Pine v6's _l == "PT" ? ... : _l == "ES" ? ... ternary chain pattern for each translated string, evaluated once at startup. Configuration tooltips, variable names, and code comments remain in English by convention — this script is designed to be readable to developers globally.
Why It Matters
Trading is a global activity. The Rainbow Matrix product family is designed for traders worldwide; multilingual UI removes a friction point for non-English-native users without adding development overhead.
HOW TO USE
Reading the Rainbow (Pane Oscillator)
◇ Master between 30 and 70 with all 5 ghost lines solid: typical volume profile, no anomaly to flag.
◇ Master entering Z-Alert (orange / teal bands): notable volume deviation — watch for follow-through confirmation across timeframes.
◇ Master in Z-Exhaustion (red high / blue low): elevated probability of climax or drought completing.
◇ Master touches Black Swan High (purple glow): volume climax event — statistically rare top-of-distribution moment, often coincides with news catalysts, breakouts, or capitulation.
◇ Master touches Black Swan Low (aqua glow): volume drought / squeeze — extreme compression, often precedes breakouts when paired with price consolidation.
Reading the Legend Table
The antenna marker (📡) flags your chart's native timeframe. Start your read there, then scan up/down the table to see whether faster/slower TFs confirm or contradict the current volume bias. Look at the relationship between Value (where in distribution), Pulse (how intense vs baseline), and State (named tier) for each row — divergences between these three readings within a single TF are early warnings.
The status row at the bottom summarizes MTF divergence: Aligned (TFs in agreement, default), Strong Top (TF1 ≥ 70 vs TF5 ≤ 30 — fast surge with slow drought), Strong Bottom (TF1 ≤ 30 vs TF5 ≥ 70 — fast quiet with slow surge), or Moderate variants of either.
Reading the Delta Twin Bars (Chart Overlay)
Tall bars = high volume score for that candle's TF source. With Dynamic Inverted mode (default), bars projecting BELOW buy candles signal "support building"; bars projecting ABOVE sell candles signal "resistance pressing" — an order book metaphor. Switch to Dynamic mode for a more intuitive directional read (buy bars project up, sell bars hang down). Use Fixed High/Low for cleaner price action when delta-only context is needed.
Reading Divergences
Master divergence (red line + 🔻 label on the pane) = price made a higher high while Master volume percentile made a lower high — Wyckoff "no demand" rally, often precedes reversal. Master bull divergence (green + 🔺) = price made a lower low while Master volume made a higher low — selling climax, often precedes bottom.
Per-TF divergences in the Legend Table's Div column give early granular warning: a TF1 divergence might fire 5-10 candles before the Master confirms. Multiple TFs aligning on the same divergence direction = high-conviction signal.
Tactical Combinations
◇ Master Black Swan High + Strong Top divergence + Bear Master divergence simultaneously = strongest reversal signal from highs.
◇ Master Black Swan Low + Strong Bottom divergence + Bull Master divergence = strongest reversal signal from lows.
◇ Master SQUEEZE state + multiple TFs SQUEEZE state + Pulse < 0.5x = pre-breakout compression — often precedes expansion events.
◇ Pulse spikes (red / purple tier) preceding percentile shifts = often mark turning points before the percentile catches up.
◇ Pair with MTF RSI Synchrony: Aligned RSI + Aligned Volume = high-conviction setup. Bear RSI div + Bear Volume div on Master simultaneously = strongest reversal signal.
INPUTS EXPLAINED
GLOBAL SETTINGS
◇ System Language (EN / PT / ES / RU / ZH) — affects HUD and alerts only; code stays in English.
◇ Table / Labels Font Size — Tiny / Small (default) / Normal / Large.
MULTI-TIMEFRAME
◇ AI Auto-Sync TFs — when ON, auto-adjusts the 5 TFs based on chart resolution.
◇ TF1-TF5 — manual TF override (defaults: 5/15/60/240/D).
◇ Default Volume Percentile Length — global default (default 50).
◇ TF1-TF5 Length Overrides — per-TF overrides; defaults 30/50/80/100/150; set to 0 to inherit global.
ENGINE
◇ Dynamic Black Swan Mode — ON by default (Fibonacci 3.85σ adaptive). OFF = static 80/20.
◇ Dynamic Channel Lookback (default 50) and Smoothing (default 10).
◇ Divergence Pivot Lookback — default 5 (community standard).
VISUALIZATION
◇ TF1-TF5 Color + Show toggles — TF1 and TF5 visible by default; TF2/3/4 hidden (opt-in).
◇ Ghost Fade Sensitivity — default 3.5 (lines invisible at ~20 percentile points from Master).
◇ Show Master Line / Show Rainbow Fills / Show Black Swan / Show Dynamic Channel — all default ON.
◇ Show MTF Legend Table — default ON.
◇ Show Divergence Column / Pulse Column — both default ON.
◇ Show Master Divergence Chart Line — default ON.
◇ Legend Table Position — Top/Bottom × Left/Right (default Bottom Right).
◇ Show Divergence Event Markers — default OFF (reduces clutter; toggle ON to display triangles).
◇ Show Static Reference Lines — default OFF (cleaner pane on install; toggle ON for 20 / 50 / 80 guides).
ALERTS
◇ Alert on Black Swan crossings (high / low) — default ON.
◇ Alert on Strong MTF Divergence — default ON.
◇ Alert on Z-Exhaustion zone entries — default OFF (opt-in).
◇ Alert on Master Classic Divergence — default ON.
DELTA TWIN BARS
◇ Show Delta Twin Bars — default ON.
◇ Score Source — Master / TF1 (default) / TF2 / TF3 / TF4 / TF5.
◇ Display Mode — Fixed High / Fixed Low / Dynamic / Dynamic Inverted (default).
◇ Buy / Sell Colors + Transparency + Size Multiplier — fully customizable.
◇ Use Master Line Color (override) — default OFF; toggle ON for rainbow-colored bars.
◇ Bar Width (pixels) — 1-8, default 8 (bold, high-visibility).
◇ Lookback (bars) — default 500 (Pine v6 pool maximum).
◇ Live Bar (intra-bar update) — default ON; toggle OFF for confirmed-only rendering.
IMPORTANT NOTES
🔸 Pine Script v6 — uses request.security with lookahead=barmerge.lookahead_off for anti-repaint integrity. The 5 per-TF volume fetches + 5 per-TF Pulse fetches + 5 per-TF divergence fetches + 6 other security calls = 21 total request.security calls; within TradingView's free-tier limits but noteworthy if combining with other heavy multi-TF indicators on the same chart.
🔸 Repaint behavior — historical bars use confirmed close data; the current real-time bar updates as ticks arrive (especially with Live Delta Bars enabled). The pivot-based divergence detection requires div_lookback confirmed bars before triggering — so divergence labels appear on the pivot bar in retrospect, not as live signals. This is standard pivot divergence behavior across all TradingView divergence indicators.
🔸 Tick rule approximation — Delta Twin Bars use the OHLC tick rule (close > open = buy bias) as a direction encoder. This is NOT real order-flow tick data. Pine Script v6 has no tick data access in indicator scripts. Same approximation is used by virtually every "delta" indicator on the TradingView free tier; this script discloses it transparently. For real bid/ask delta, use paid order flow tools.
🔸 Pine v6 line pool limit — Delta Twin Bars are bounded to 500 lines (Pine v6 hard limit). Older candles fall out of the rolling FIFO and lose their twin bar — this is a Pine engine constraint, not a bug. The current bar's live line uses ONE persistent slot reused across bars (no additional pool consumption).
🔸 Fibonacci ratios are canonical — the channel proportions (1.50 / 1.85 / 2.75 / 3.85) match the Rainbow Matrix brand standard across all sibling indicators. They are derived from the brand's design system and are not user-configurable — preserving cross-indicator visual consistency.
🔸 Master effective TF — the "~XhYm" label in the Master row is the geometric weighted mean of the 5 TF resolutions (same weights as the Master fusion: 0.15/0.20/0.25/0.25/0.15). With defaults 5/15/60/240/D, the effective TF is approximately 71 minutes (~1h11m). This tells you the "average horizon" the Master is reading.
🔸 License: MPL 2.0 (Mozilla Public License 2.0) — open source. Free to fork, modify, and republish under the same license terms.
UNIQUENESS
Three pillars differentiate this from the dozens of volume indicators already on TradingView:
1. Multi-timeframe percentile fusion with synchrony as a visual property. Most volume tools operate on a single timeframe with raw unbounded readings. This indicator bounds every reading to a 0-100 percentile scale, fuses five timeframes via Fibonacci-proportioned weights, and expresses synchrony itself as a "rainbow density" — solid when aligned, spread-out when diverging. The disagreement between fast and slow timeframes becomes immediately readable.
2. Three complementary volume readings in one Legend Table. Value (percentile rank), Pulse (magnitude ratio), and State (named tier) answer three different questions about the same volume reading. Most indicators give you one number; this one disambiguates "rare historical event" from "extreme recent magnitude" from "elevated relative position." The combination catches signals that single-metric views miss.
3. Combined oscillator + chart overlay in a single script. Delta Twin Bars project the per-candle volume score and tick-rule direction directly onto the price chart via force_overlay=true, while the full pane oscillator (Master fusion, ghost lines, Legend Table, divergence engine, dynamic channel) continues to operate independently. Most TradingView indicators force you to choose between oscillator-only or overlay-only paradigms; this script gives you both, with honest disclosure about the OHLC tick rule approximation.
Rainbow Matrix AI | Multi-timeframe institutional analysis tools for traders.
🌐 rainbowmatrix.ai
✉️ Contact: contact@rainbowmatrix.ai 指标
MFI + RSI Overbought/Oversold w/ Independent Controls [idahodev]This indicator displays the Money Flow Index (MFI) and Relative Strength Index (RSI) together in a single oscillator pane, with fully independent settings for each.
Both MFI and RSI can be customized with separate source inputs, lengths, smoothing types, smoothing lengths, overbought thresholds, and oversold thresholds. This makes it easier to compare price momentum and volume-weighted momentum without forcing both oscillators to use the same settings.
The script also includes conditional threshold fills. When RSI or MFI moves above its configured overbought level, the area between the oscillator line and the overbought threshold is filled. When RSI or MFI moves below its configured oversold level, the area between the oscillator line and the oversold threshold is filled. Fill colors and opacity can be customized independently for each oscillator and condition.
Features:
- Combined RSI and MFI oscillator display
- Independent RSI and MFI lengths
- Independent RSI and MFI smoothing
- SMA, EMA, RMA, WMA, or no smoothing
- Independent overbought and oversold levels
- Conditional overbought and oversold fills
- Custom fill colors and opacity
- Useful for spotting momentum extremes, divergences, and confluence between RSI and MFI
This indicator does not generate buy or sell signals by itself. It is intended as a visual analysis tool for identifying momentum conditions and possible exhaustion zones. 指标

Zookoff-Zookonacci Cipher B + DivergencesThe Zook Ciphernator — Cipher B
The Zook Ciphernator is a multi-layer momentum, divergence, and reversal dashboard inspired by the classic Cipher B / VuManChu-style oscillator layout, but redesigned with cleaner visuals, improved toggle control, flexible display positioning, enhanced RSI divergence options, and a more refined dot/legend system.
This indicator is designed to help read momentum shifts, exhaustion, divergence, and possible reversal conditions in one pane. It is not intended to be used as a standalone buy/sell system. The signals are contextual tools and should be combined with price action, market structure, volume, risk management, and your own trading plan.
Core Components
WaveTrend
WaveTrend is the main momentum structure of the indicator.
It consists of:
Fast WaveTrend
Slow WaveTrend
The fast WaveTrend crossing above or below the slow WaveTrend can indicate a possible momentum shift.
In this version, the WaveTrend hills are rendered as layered blue/dark areas so the interaction between the fast and slow waves is easier to read visually.
WaveTrend is also used for standard buy/sell signals, WaveTrend divergence, and the Gold Dot logic.
Fast WT / VWAP
The VWAP layer in this indicator is not traditional price VWAP.
Here, it is calculated from the gap between the fast WaveTrend and the slow WaveTrend. In other words, it acts like a fast WaveTrend impulse layer.
When it rises, it suggests the fast WaveTrend is gaining strength relative to the slow WaveTrend. When it falls, it suggests momentum is weakening.
It can often give an earlier clue that momentum is starting to turn before the full WaveTrend structure becomes obvious.
Money Flow
The Money Flow area is a background pressure gauge.
It helps show whether the recent candle structure is leaning bullish or bearish.
Cyan Money Flow = bullish pressure
Red Money Flow = bearish pressure
This Money Flow is best used as context, not as a direct entry trigger. For example, a bullish reversal setup is usually cleaner if Money Flow is improving, flattening, or moving back toward positive territory.
Stochastic RSI
Stochastic RSI is included as a timing tool.
It is useful for identifying when momentum is stretched, bottoming, topping, or beginning to turn.
Typical use:
Low Stoch RSI beginning to curl up = possible early bullish timing clue
High Stoch RSI beginning to roll over = possible early bearish timing clue
Stochastic RSI can be displayed in the upper or lower half of the pane using the display-position controls.
RSI
RSI is included with optional smoothing, overbought/oversold guide levels, and divergence detection.
The RSI line uses dynamic colouring:
Gold = neutral RSI zone
Cyan = RSI oversold zone
Red = RSI overbought zone
The RSI smoothing line can be used as a quieter reference line to help see the broader RSI direction.
RSI can also be displayed in the upper or lower half of the pane.
RSI Divergence Engines
The indicator includes two RSI divergence modes.
1. Cipher Classic
This uses a stricter, confirmed-fractal style divergence method.
It tends to produce fewer signals, but they are cleaner and more selective.
2. Realtime Pivot
This uses a more responsive pivot-scanning divergence engine.
It can detect more RSI divergences and can pick them up earlier. Because it can work closer to the current candle, some signals may change or disappear before confirmation.
There is also an Auto mode:
When WaveTrend is visible, RSI divergences default toward the classic cipher style.
When WaveTrend is hidden, RSI divergences can use the realtime pivot style.
Schaff Trend Cycle
Schaff TC is an optional trend-cycle filter.
It is based on MACD-style momentum, then normalized into a cyclic oscillator. It can help show whether the broader momentum cycle is improving or weakening.
It is not a primary entry trigger, but it can be useful as a background confirmation tool.
Schaff TC can also be displayed in the upper or lower half of the pane.
Sommi Flag and Sommi Diamond
The indicator also includes the original Sommi-style Flag and Diamond pattern logic.
These are optional advanced signals that combine WaveTrend behaviour with higher-timeframe context.
Sommi Flag
The Sommi Flag is designed to highlight potential continuation or reversal-style conditions using:
Money Flow direction
WaveTrend position
WaveTrend cross direction
Higher-timeframe VWAP / Fast WT behaviour
A bearish Sommi Flag can appear when Money Flow is weak, WaveTrend is elevated and crossing down, and the higher-timeframe Fast WT / VWAP context is bearish.
A bullish Sommi Flag uses the opposite logic.
Sommi Diamond
The Sommi Diamond uses higher-timeframe Heikin Ashi candle direction together with WaveTrend crossing behaviour.
A bearish Sommi Diamond can appear when higher-timeframe Heikin Ashi candles are bearish and WaveTrend crosses down from a relevant level.
A bullish Sommi Diamond uses the opposite logic.
How to Use Sommi Signals
Sommi signals should be treated as optional confluence markers, not standalone trade signals.
They are most useful when they agree with the broader context shown by:
WaveTrend
Money Flow
VWAP / Fast WT
Stochastic RSI
RSI divergence
Price structure
Because this version of the Zook Ciphernator focuses mainly on WaveTrend, RSI, Stoch RSI, Money Flow, VWAP, and the dot system, the Sommi tools remain available as legacy/advanced features for users who like that style of signal filtering.
Display Position Controls
The indicator includes quick display controls for:
RSI
Stochastic RSI
Schaff TC
Each can be set to:
Auto
Upper
Lower
Auto uses the current adaptive layout rules. Upper and Lower allow manual override.
This makes it easier to avoid visual clashes between RSI, Stochastic RSI, WaveTrend, and Schaff TC.
Dot Legend
TOP ROW DOTS
Purple/pink dot = RSI bearish divergence
Price has made a higher high, but RSI has made a lower high. This suggests upside momentum may be weakening.
Red dot, slightly faded = Standard WaveTrend sell signal
The fast WaveTrend crosses down through the slow WaveTrend while WaveTrend is in an overbought area.
Red dot, brighter = Standard WaveTrend sell signal + confirmed WaveTrend bearish divergence
The normal WaveTrend sell signal has triggered and it coincides with a confirmed WaveTrend bearish divergence. This means price has pushed higher, but WaveTrend has failed to make a stronger high.
BOTTOM ROW DOTS
Lime dot = RSI bullish divergence
Price has made a lower low, but RSI has made a higher low. This suggests downside momentum may be weakening.
Cyan dot, slightly faded = Standard WaveTrend buy signal
The fast WaveTrend crosses up through the slow WaveTrend while WaveTrend is in an oversold area.
Cyan dot, brighter = Standard WaveTrend buy signal + confirmed WaveTrend bullish divergence
The normal WaveTrend buy signal has occurred and it coincides with a confirmed WaveTrend bullish divergence. This means price has pushed lower, but WaveTrend has failed to make a weaker low.
Gold dot, larger = Stronger bullish reversal setup
This is a higher-alert bullish reversal condition. It generally combines a bullish divergence / oversold WaveTrend structure with RSI oversold confirmation.
Important: the Gold Dot is not an instruction to buy immediately. It is a warning that a potentially stronger reversal setup may be forming. Confirmation from price action, structure, and your trading plan is still required.
DOTS ON THE WAVETREND HILLS
Red dot on WaveTrend hill = Fast WaveTrend crossing down through slow WaveTrend
This marks a possible bearish momentum shift.
Cyan dot on WaveTrend hill = Fast WaveTrend crossing up through slow WaveTrend
This marks a possible bullish momentum shift.
These hill dots mark all WaveTrend crosses. They are useful for reading momentum shifts, but they are not the same as the stronger top/bottom row buy/sell signals.
Visibility Behaviour
The top and bottom row dots are designed to remain in place even if the WaveTrend hills are hidden.
This allows you to hide the WaveTrend visual layer while still preserving the key signal information.
Similarly, RSI divergence dots can remain visible even if the RSI line itself is hidden.
Suggested Reading Framework
A simple way to read the indicator:
Stochastic RSI = timing and stretched momentum
WaveTrend = main momentum structure
VWAP / Fast WT = early impulse clue
Money Flow = background pressure
RSI divergences = momentum disagreement with price
Gold Dot = stronger bullish reversal warning
Schaff TC = optional trend-cycle confirmation
Sommi Flag / Diamond = optional higher-timeframe confluence markers
For bullish setups, look for oversold conditions, improving VWAP / Fast WT, Stoch RSI turning up, bullish divergence, and Money Flow stabilising or improving.
For bearish setups, look for overbought conditions, weakening VWAP / Fast WT, Stoch RSI rolling over, bearish divergence, and Money Flow weakening.
Future Development
This version focuses on the core Cipher B-style workflow: WaveTrend, VWAP / Fast WT, Money Flow, Stochastic RSI, RSI divergence, Schaff TC, Sommi tools, and the refined dot system.
Future iterations may include additional modules such as:
MACD-based confirmation
DSS Bressert
Further divergence refinements
Additional display and confluence options
These may be added in future versions if they improve the indicator without making the layout too cluttered.
Disclaimer
This indicator is for educational and analytical use only. It does not provide financial advice and should not be treated as a standalone trading system.
No signal is guaranteed. Always use proper risk management and make your own trading decisions.
Some examples of customisable views:
Stripping down to just RSI and Stoch RSI while dots are preserved:
指标

指标

MACD + RSI + MFI + A/D by Ismael█ OVERVIEW
A 4-in-1 oscillator panel combining MACD, RSI with Bollinger Bands and
custom Buy/Sell signals, Money Flow Index (MFI), and Accumulation/Distribution.
Each module can be toggled on/off independently from a single "Toggle
Indicators" group, so the user can display only what they need instead of
loading four separate scripts.
═══════════════════════════════════════════════════════════════════════
█ ORIGINALITY
This script does not invent new math — it integrates four well-known
built-in indicators into a single pane and adds three conveniences:
- A unified toggle system to show/hide each indicator on demand.
- A custom RSI signal layer based on Bollinger Band breakouts of the
RSI itself, combined with the classic overbought/oversold zones.
- An A/D module that replicates the configuration style of the
MetaTrader 5 implementation (Tick/Real volume option and configurable
horizontal levels).
═══════════════════════════════════════════════════════════════════════
█ WHAT IT INCLUDES
▪ MACD (default: ON)
Standard MACD with configurable fast/slow lengths, signal smoothing,
and choice of SMA or EMA for both the oscillator and signal line.
Includes alerts for histogram polarity changes.
▪ RSI with Bollinger Bands and Buy/Sell signals (default: ON)
Classic RSI with optional smoothing MA (SMA, EMA, WMA, VWMA, SMMA,
or SMA + Bollinger Bands). When "SMA + Bollinger Bands" is selected:
- Buy signal: RSI closes below its lower Bollinger Band AND below 30.
- Sell signal: RSI closes above its upper Bollinger Band AND above 70.
Signals are plotted as arrows and include alert conditions.
▪ MFI (default: OFF)
Standard Money Flow Index with 80/50/20 horizontal levels.
▪ Accumulation/Distribution (default: OFF)
Classic cumulative A/D line. Configurable like the MT5 version:
- Volume mode: Real or Tick (1 per bar, useful for FX).
- 3 user-defined horizontal levels with individual visibility/color.
- Color and line width.
Includes alerts for crossovers against its own SMA(20).
═══════════════════════════════════════════════════════════════════════
█ HOW TO USE
1. Activate from "Toggle Indicators" only the modules you need.
2. RSI Buy/Sell signals are intended as confluence — not standalone
entries. They mark statistically rare conditions (extreme RSI combined
with a Bollinger Band breakout on the RSI) and should be confirmed
with price action, structure, or trend context.
3. MACD histogram polarity alerts can be paired with RSI signals.
4. The A/D line is most useful when watched for divergences against price,
not for its absolute value.
═══════════════════════════════════════════════════════════════════════
█ LIMITATIONS
- The A/D line uses cumulative values that produce very large numbers.
When combined with MACD/RSI/MFI in the same pane, auto-scale will
compress the smaller-range indicators. Workaround: right-click the
A/D plot → "Pin to scale" → assign it to a separate scale.
- "Tick" volume here is approximated as 1 per bar; Pine Script does not
expose the tick-volume data used by MetaTrader 5. For instruments with
reliable real volume, use "Real".
- RSI Buy/Sell signals only fire when the smoothing MA type is set to
"SMA + Bollinger Bands". Other MA types disable the signal layer.
- This is an aggregator/utility script. It does not predict market
direction and is not a complete trading system.
═══════════════════════════════════════════════════════════════════════
█ DISCLAIMER
This script is shared for educational purposes only and is not financial
advice. Indicator signals do not guarantee future results. Always perform
your own analysis and apply proper risk management.
═══════════════════════════════════════════════════════════════════════
█ DESCRIPCIÓN (Español)
Panel de osciladores 4-en-1 que combina MACD, RSI con Bandas de Bollinger
y señales de compra/venta, MFI y Acumulación/Distribución. Cada módulo se
activa o desactiva de forma independiente desde el grupo "Toggle
Indicators".
Incluye:
- MACD estándar con alertas de cambio de polaridad del histograma.
- RSI con MA opcional (SMA, EMA, WMA, VWMA, SMMA o SMA+BB). Cuando
se elige "SMA + Bandas de Bollinger", aparecen señales:
- Compra: RSI por debajo de la banda inferior Y menor a 30.
- Venta: RSI por encima de la banda superior Y mayor a 70.
- MFI estándar con niveles 80/50/20.
- Acumulación/Distribución estilo MT5: volumen Real/Tick, 3 niveles
horizontales configurables, color y grosor ajustables, alertas de
cruce contra su SMA(20).
Las señales del RSI son herramientas de confluencia, no entradas
automáticas. La línea A/D se interpreta principalmente por divergencias
con el precio, no por su valor absoluto. Al activar A/D junto con los
demás osciladores, conviene moverla a una escala separada (clic derecho
sobre la línea → "Fijar a escala" → escala nueva).
Este script tiene fines educativos. No constituye asesoría financiera.
█ HOW TO USE
The RSI Buy/Sell signals (with their attached alerts) are the main
actionable element of this script and can be used to anticipate potential
entries — long on Buy signals, short on Sell signals. They fire under
statistically rare conditions (RSI breaking out of its own Bollinger Band
envelope while also being in extreme oversold/overbought territory),
which often precede a reversion or a meaningful move.
However, these signals should NOT be taken as standalone entries. They
work best as an early-warning system that must be confirmed before
acting on them. Recommended workflow:
1. RSI Buy/Sell signal fires → set alert and prepare the trade idea.
2. Look at the MACD for confirmation:
- For a Buy: histogram should be turning from falling to rising,
or MACD line crossing above Signal.
- For a Sell: histogram turning from rising to falling, or MACD
line crossing below Signal.
3. Check the MFI (if enabled): values pulling back from oversold (<20)
on Buys, or pulling back from overbought (>80) on Sells, add
confluence by confirming a money-flow shift.
4. Check the A/D line for divergences with price:
- Bullish divergence (price makes lower low, A/D makes higher low)
strongly supports a Buy signal.
- Bearish divergence (price makes higher high, A/D makes lower
high) strongly supports a Sell signal.
Divergences on RSI itself against price work the same way and are
one of the most reliable confirmation tools in this panel.
5. Always combine with price-action context: trend direction on higher
timeframes, key support/resistance, and your own risk management.
In short: the RSI signals are designed to ANTICIPATE trades, not to
trigger them automatically. The other modules (MACD, MFI, A/D) and
divergence analysis exist to filter the false positives and validate
the ones worth taking.
═══════════════════════════════════════════════════════════════════════
█ CÓMO USAR (Español)
Las señales de Compra/Venta del RSI (con sus alertas configuradas) son
el elemento principal accionable de este script y pueden usarse para
anticipar entradas — largos en señales de Compra, cortos en señales de
Venta. Se activan en condiciones estadísticamente poco frecuentes
(el RSI rompe su propia envolvente de Bandas de Bollinger mientras
está en zona de sobreventa o sobrecompra extrema), que suelen preceder
una reversión o un movimiento significativo.
Sin embargo, NO deben tomarse como entradas automáticas. Funcionan
mejor como un sistema de alerta temprana que debe confirmarse antes
de operar. Flujo recomendado:
1. Se dispara la señal del RSI → preparar la idea de trade.
2. Confirmar con MACD:
- Compra: histograma pasando de bajista a alcista, o cruce
del MACD por encima de la Signal.
- Venta: histograma pasando de alcista a bajista, o cruce
del MACD por debajo de la Signal.
3. Confirmar con MFI (si está activo): valores saliendo de
sobreventa (<20) en Compras o saliendo de sobrecompra (>80)
en Ventas indican un cambio en el flujo de dinero.
4. Buscar divergencias en la línea A/D contra el precio:
- Divergencia alcista (precio hace mínimo más bajo, A/D hace
mínimo más alto) refuerza una señal de Compra.
- Divergencia bajista (precio hace máximo más alto, A/D hace
máximo más bajo) refuerza una señal de Venta.
Las divergencias del propio RSI contra el precio funcionan igual
y son una de las confirmaciones más fiables de este panel.
5. Siempre combinar con contexto de price action: tendencia en
temporalidades superiores, soportes/resistencias clave y gestión
de riesgo propia.
En resumen: las señales del RSI están diseñadas para ANTICIPAR
trades, no para dispararlos automáticamente. Los otros módulos
(MACD, MFI, A/D) y el análisis de divergencias existen para filtrar
los falsos positivos y validar las entradas que realmente valen
la pena. 指标
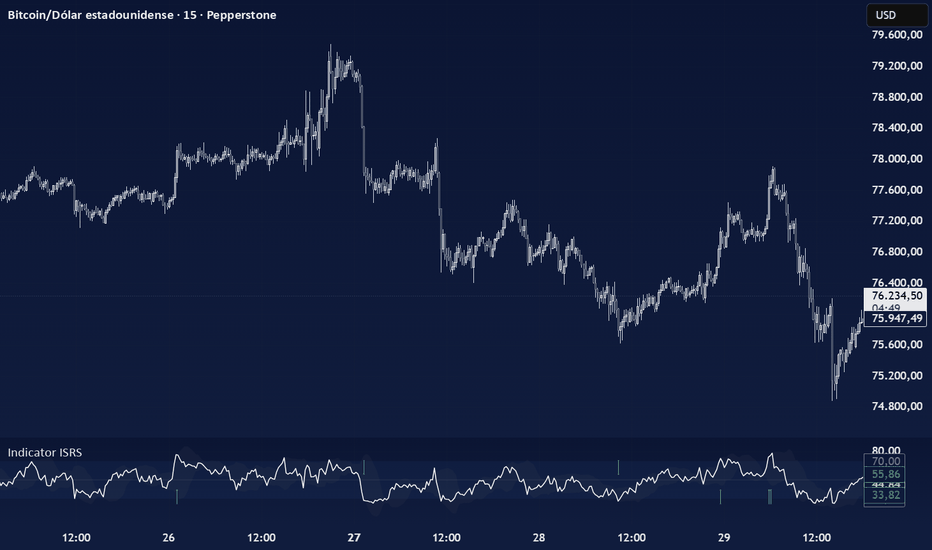
指标

策略

指标

_Trinity Matrix_
Short description
A structured multi-layer oscillator built around a refined Trinity Wave core, MFI regime columns, confidence scoring, divergence filtering, and TF / HTF context.
Full publication description
Trinity Matrix is a multi-layer oscillator designed to read continuation, reversal quality, regime strength, and divergence context inside a single panel.
It combines a refined Trinity Wave core, MFI regime structure, confidence scoring, mode-based signal filtering, divergence logic, and a compact TF / HTF dashboard into a unified workflow.
The name is a nod to layered market context: not a single signal, but a structured matrix of wave state, regime strength, confidence, and divergence.
Core Structure
Trinity Wave core with additional smoothing and soft limiting to reduce extreme spikes while preserving directional character
MFI Columns to separate baseline participation from stronger expansion phases
Strong zone highlighting to visually distinguish stronger bullish and bearish regime expansion
Confidence engine that blends Trinity Wave continuation and MFI continuation into a normalized directional score
Signal modes for different levels of selectivity: None, Early, Standard, and Strict
ATR-gated divergence filtering for cleaner divergence structures
TF / HTF confidence dashboard for comparing active timeframe conviction against a selected higher timeframe
Built-in alerts for buy, strong buy, elite buy, sell, strong sell, and elite sell conditions
How to Read It
Trinity Wave is the main directional layer. Green indicates bullish state, red indicates bearish state.
MFI Columns show regime participation.
White columns = baseline MFI flow
Shiny white columns = stronger bullish expansion
Orange columns = stronger bearish expansion
Average MFI bands help show where positive or negative regime strength is building relative to recent memory.
Confidence Dashboard summarizes directional conviction on both the active timeframe and the selected higher timeframe.
Row 1 = TF / HTF labels
Row 2 = confidence percentage
Row 3 = qualitative tag: Weak / Moderate / Strong
Signal Modes
None hides signal output
Early is faster and more aggressive
Standard is more balanced
Strict applies the strongest filtering and usually produces the fewest signals
Divergence Module
The divergence layer uses Trinity Wave turning points, confidence filtering, pivot distance control, and optional ATR gate filtering.
It can draw on the oscillator and, if enabled, on price as well.
The goal is not to maximize divergence count, but to keep the structures more selective and readable.
Alerts
This script includes separate alert conditions for:
TW Buy
TW Buy Strong
TW Buy Elite
TW Sell
TW Sell Strong
TW Sell Elite
Suggested Use
Trinity Matrix works best as a structured reading tool rather than a one-click decision engine.
A practical workflow is:
Read Trinity Wave direction and location
Check whether MFI is in baseline flow or strong expansion
Use confidence and HTF context to judge continuation or reversal quality
Use signal mode based on your desired aggressiveness
Use divergence as a contextual filter, not as a standalone trigger
Important Notes
Signal frequency changes significantly with the selected signal mode
HTF confidence reflects the live state of the selected higher timeframe
Divergence output is intentionally filtered and selective
This is an indicator framework, not a full trading strategy
Attribution
Core WaveTrend-style formulation was adapted from the open-source WaveTrend Oscillator by LazyBear, then extended with additional smoothing, soft limiting, MFI regime logic, confidence scoring, divergence filtering, dashboard structure, and alert workflow.
Acknowledgement
Built through many rounds of testing, refinement, and iteration — with a little help from ChatGPT and CodeGPT along the way.
Disclaimer
For educational and analytical use only. Not financial advice. 指标

Advanced Volume [v3.1]Advanced Volume Indicator & Divergence Dashboard -
Volume is the fuel that drives market structure. While price dictates *where* the market is going, volume reveals *how much conviction* is behind the move.
The **Advanced Volume Indicator** is a comprehensive, multi-factor analysis toolkit designed to move beyond single-metric volume analysis. By aggregating seven distinct volume indicators, a cooldown-aware divergence engine, and a dynamic scoring dashboard, this tool provides a complete, institutional-grade picture of market participation and order flow.
Core Metrics Included
You can select any of the following primary oscillators to display on your main indicator pane. Regardless of your visual selection, the background engine continuously tracks all of them:
* **Chaikin Money Flow (CMF):** Measures the balance of accumulation and distribution over a rolling period.
* **Money Flow Index (MFI):** A volume-weighted relative strength index used to spot volume exhaustion and overbought/oversold extremes.
* **Volume RSI:** Applies momentum calculations strictly to volume, identifying periods of expanding or contracting participation.
* **Relative Volume (RVOL):** Compares the current bar's volume against a rolling baseline average to highlight significant spikes.
* **Volume Oscillator:** Tracks the percentage spread between short-term and long-term volume moving averages to determine volume trend direction.
* **VWAP Position:** Evaluates price action relative to the session's Volume Weighted Average Price (an institutional benchmark).
* **Estimated Cumulative Volume Delta (CVD):** Approximates net buying and selling pressure.
The Weighted Aggregate Dashboard
The centrepiece of this indicator is the on-chart Heads-Up Display (HUD). It provides real-time status updates for all seven metrics and combines them into a **Weighted Aggregate Signal**.
The engine evaluates all data points simultaneously and outputs a directional score ranging from **-9 (Strong Sell)** to **+9 (Strong Buy)**.
The scoring is weighted based on metric reliability:
* **CMF:** ±2 points (Primary money flow driver)
* **MFI:** +2 (oversold), +1 (neutral bullish), or -1 (overbought/bearish bias)
* **Volume Oscillator:** ±1 to ±2 points (Based on trend expansion strength)
* **Volume RSI:** ±1 point
* **VWAP Position:** ±1 point
* **Volume Trend (vs 20 SMA):** ±1 point
Smart Divergence Engine
The script features a robust momentum divergence engine applied to your chosen primary oscillator. It includes three distinct filters to prevent false signals and alert spam:
1. **Divergence Strength Scoring:** Evaluates the severity of both the price displacement and the oscillator displacement.
2. **Minimum Strength Filter:** Allows you to ignore weak, insignificant divergences. (A typical strong signal scores between 1.0 and 5.0).
3. **Cooldown Gate:** Requires a minimum number of bars between signals of the same direction, preventing the engine from spamming repeated alerts during a slow, grinding trend.
Actionable Signals & Alerts
The indicator provides visual markers and fully configurable alerts for:
* **Bullish & Bearish Divergences:** Confirmed momentum shifts.
* **Volume Spikes:** Bars exceeding your custom RVOL threshold (default 2.0x average).
* **Hidden Liquidity:** High-volume Doji candles. These represent extreme volume participation resulting in price indecision—often a footprint of institutional absorption or hidden liquidity resting in the order book.
Recommended Settings by Trading Style
* **Scalping (1m–5m):** Lookback = 3, Cooldown = 5, Min Strength = 0.5, Session CVD Reset = ON
* **Day Trading (15m–1H):** Lookback = 5, Cooldown = 10, Min Strength = 1.0, Session CVD Reset = ON
* **Swing Trading (4H–D):** Lookback = 5, Cooldown = 15, Min Strength = 2.0, Session CVD Reset = OFF
* **Portfolio/Macro (D–W):** Lookback = 8, Cooldown = 20, Min Strength = 1.0, Session CVD Reset = OFF
Strategy Integration
This script exports its internal data silently to the TradingView Data Window. You can easily import these values into your own automated strategy scripts using the `request.security()` function. The exported plots are: `Export_CMF`, `Export_MFI`, `Export_RVOL`, and `Export_DivStrength`.
---
MANDATORY MODERATION DISCLOSURES
**1. Historical Plotting / Offset Confirmation**
By design, the divergence markers plotted by this script appear in the past. To ensure a divergence signal is permanently locked in and mathematically valid, the engine waits for `div_lookback` bars to close *after* the suspected pivot high/low before confirming it. Once confirmed, it plots the marker backward onto the actual pivot bar using a negative offset. **This is not a repainting bug.** It is a strict, standard confirmation feature to prevent repainting and false signals mid-move. Alerts can be set to fire only upon bar close.
**2. Estimated CVD Calculation**
True Cumulative Volume Delta requires tick-by-tick bid/ask order flow data, which is not available on standard TradingView chart feeds. The CVD in this script is explicitly an **Estimated CVD**. It uses the intra-bar close position relative to the high/low range as a mathematical proxy to approximate net buying and selling pressure. A "Session Reset" toggle is included (and recommended) for equities and futures to restart the accumulation daily, mitigating gap-open distortion. 指标

AG Pro MFI Flow Imbalance [AGPro Series]AG Pro MFI Flow Imbalance
Overview
AG Pro MFI Flow Imbalance is a directional money-flow study built to evaluate whether buying pressure and selling pressure are developing in a balanced way or becoming meaningfully one-sided. Instead of using the classical Money Flow Index as a simple overbought/oversold gauge, this script reframes money flow as an imbalance problem. The objective is not to predict future price with certainty, and it is not presented as a standalone trading system. Its role is to help traders inspect how strongly flow is leaning to one side, how persistent that imbalance has become, and whether the condition is expanding, stabilizing, fading, or returning toward balance.
This publication is designed around a very specific analytical question: is money flow distributed relatively evenly between both sides, or is participation clustering in a way that suggests directional dominance? That is the core problem the script is trying to organize visually. In practical terms, the script separates positive and negative money flow, normalizes the relationship between them, smooths the result for readability, and then classifies the current state using threshold bands, persistence logic, event labels, and a compact summary panel. The result is a tool focused on flow asymmetry rather than on generic oscillator levels.
This distinction is important because many money-flow and volume-based studies are ultimately used as broad momentum proxies. That is not the purpose here. AG Pro MFI Flow Imbalance is built to track directional imbalance itself. The central read is not simply “high” or “low”; the central read is whether flow is bullish or bearish, whether that condition is weak or strong, whether it is becoming more one-sided or less one-sided, and whether the move is persistent enough to deserve more attention.
Within the AG Pro catalog, this script is intentionally solving a different problem than the other tools. It is not a break-and-retest study, not a reclaim tool, not a trendline or structure-mapping script, not a trend-quality score, not a session-based framework, not a cumulative OBV-style divergence tool, and not an RSI pressure oscillator. Those tools ask different questions. This script focuses on directional flow asymmetry: how unevenly money flow is being allocated between bullish and bearish participation over a rolling window. That difference is deliberate and central to the design.
What the script does
The script computes a directional money-flow relationship using typical price and volume, then compares positive flow and negative flow over a configurable lookback. That relationship is converted into a normalized imbalance score. A smoothed score line is then used to reduce noise and improve interpretability. The study also tracks whether the current imbalance is inside a neutral band, above a strong threshold, or in an extreme zone. It further evaluates persistence, meaning whether the imbalance has remained outside the neutral band for enough bars to be treated as more than a brief fluctuation.
The visual structure is built around several coordinated layers:
- a histogram that shows directional imbalance strength,
- a signal line for smoother state tracking,
- an optional raw score for users who want to inspect unsmoothed swings,
- threshold zones that separate neutral, strong, and extreme conditions,
- a subtle directional tint to keep the pane readable at a glance,
- optional event labels for selected state changes,
- and a compact panel summarizing state, bias, imbalance, strength, persistence, flow mode, MFI regime, and threshold status.
The script also includes alert conditions for directional starts, strong-threshold transitions, extreme imbalance events, fading conditions, and balance restoration. These events are not promises of future performance. They are structured notifications describing the current state of the internal flow model.
Unique edge
The unique edge of this script is not that it “improves” MFI by making stronger claims. Its edge is conceptual. Classical MFI is often read primarily as an overbought/oversold oscillator. AG Pro MFI Flow Imbalance uses MFI-related inputs as a flow framework, but the main output is a directional asymmetry engine. The question is not “is MFI high or low?” The question is “how skewed is money flow, how persistent is that skew, and is the current skew expanding or fading?”
That is why the classical MFI layer is treated as secondary context rather than as the primary engine. In this script, the MFI regime is an auxiliary read that can support or fail to support the main imbalance state. The main analytical product remains the normalized imbalance score and the way that score behaves through time.
How this differs from other AG Pro scripts
This point deserves to be explicit.
AG Pro MFI Flow Imbalance is not a structure script. It does not map swing highs, swing lows, break points, reclaim levels, retest quality, support-resistance interaction, or breakout geometry. Users looking for structural confirmation should not expect this tool to replace scripts built for structural analysis.
It is not a cumulative pressure-divergence script. It does not frame the market through OBV-style accumulation paths or through price-versus-cumulative-volume disagreement. Its emphasis is current directional flow imbalance over a rolling window, not cumulative divergence logic.
It is not an RSI pressure tool. It does not try to express internal price pressure through RSI-derived compression or momentum-pressure logic. The model here is flow allocation, not RSI pressure mapping.
It is not a trend-quality or regime-classification tool. While strong one-sided flow can sometimes align with directional trends, this script is not built to classify broad market regimes on its own. It is a flow diagnostic, not a complete regime engine.
It is not a dashboard or screener. It is a single-study analytical tool focused on one chart at a time, designed to help interpret the quality and persistence of directional money flow in context.
Because of those boundaries, this publication should not be read as a renamed variant of earlier AG Pro concepts. Its design problem, internal framing, visual hierarchy, and interpretation model are distinct.
Methodology
At a conceptual level, the script begins with typical price and volume to form raw money flow. It then separates that flow into positive and negative components based on directional change. Those components are aggregated over a lookback period and compared through a normalized formulation so the result can be interpreted as a directional imbalance score rather than as a raw cumulative total.
That normalized score is then smoothed for readability. Persistence logic is applied to distinguish short-lived pushes from conditions that remain outside the neutral band for multiple bars. The script then classifies the output using three broad layers of interpretation:
1. direction: bullish, bearish, or neutral,
2. strength: neutral, moderate, strong, or extreme,
3. behavior: expanding, fading, stabilizing, or balanced.
A secondary classical MFI context layer is also displayed in the panel. This is intentionally subordinate to the main engine. Its purpose is to tell the user whether the classical MFI backdrop is broadly supportive of the current imbalance read, not to replace the imbalance model.
How to read it
A positive histogram indicates bullish directional flow imbalance. A negative histogram indicates bearish directional flow imbalance. The further the score moves away from the neutral band, the more one-sided the flow condition becomes according to the script’s current settings.
The signal line is there to help users judge whether the imbalance is strengthening, flattening, or reversing. The raw score can also be displayed for users who want to compare unsmoothed behavior with the smoothed model.
The neutral band is important because it separates relatively balanced participation from meaningful directional skew. Movement beyond the strong threshold suggests a more assertive one-sided condition. Movement into the extreme zone signals a more stretched imbalance state. None of these states should be interpreted in isolation. A strong bullish imbalance is not automatically a bullish trade signal, and a strong bearish imbalance is not automatically a bearish trade signal. They are context states.
Persistence is also important. A one-bar excursion outside the neutral band does not carry the same informational weight as an imbalance that has remained active across several bars. That is why the panel includes a persistence read and why the optional event labels are intentionally restricted to selected events rather than every minor fluctuation.
Signals and alerts
The script includes structured event logic for the following types of conditions:
- bullish directional imbalance started,
- bearish directional imbalance started,
- bullish imbalance strengthening above the strong threshold,
- bearish imbalance strengthening above the strong threshold,
- bullish extreme imbalance,
- bearish extreme imbalance,
- imbalance fading,
- and balance restored.
These alerts describe what the internal model is detecting. They do not guarantee that price will continue in the same direction, reverse, or reach any target. Their function is organizational: they help users identify when the script’s flow state changes materially.
Key inputs
The main controls are MFI Length, Imbalance Lookback, Smoothing Length, Signal Length, Persistence Bars, Neutral Threshold, Strong Threshold, and Extreme Threshold. These settings alter how sensitive the model is to short-term changes and how quickly it escalates a condition from neutral to strong or extreme.
Visual controls allow users to show or hide the histogram, signal line, raw score, threshold zones, bias tint, MFI guides, summary panel, and event labels. Label behavior can also be filtered through event mode, size, spacing, and transparency settings so the pane can remain readable without becoming over-annotated.
Practical use
This script is generally most useful when the user wants to inspect whether directional participation is broadening or weakening under the surface. For example, a user may observe price moving higher while checking whether the flow imbalance remains supportive, is fading, or never became strong in the first place. Likewise, when price weakens, the script can help distinguish between shallow bearish flow and more persistent bearish dominance.
It can also be used as a filter alongside other tools. A trader using structural tools, trend tools, or volatility tools may find it useful to ask whether those reads are accompanied by balanced flow, strengthening directional skew, fading imbalance, or a return toward neutrality. In that role, AG Pro MFI Flow Imbalance functions as a context layer rather than as a one-click decision engine.
Limitations and transparency
This script does not know market intent, external news, hidden liquidity, or order-book behavior. It works only with the price and volume data available on the chart and the transformations applied to that data inside the model. Different symbols, exchanges, sessions, liquidity profiles, and volatility regimes can all change how the output behaves.
The study also does not eliminate the tradeoff between sensitivity and stability. Shorter settings may react faster but can become noisier. Longer settings may produce smoother states but react later. Threshold placement matters as well. If thresholds are too loose, the script may classify too many minor swings as meaningful. If thresholds are too strict, it may ignore useful early changes.
Users should also remember that strong imbalance is not inherently bullish or bearish in a simple predictive sense. A strong condition can persist, fade, stall, or reverse depending on context. The script is descriptive and analytical. It is not a guarantee engine.
Why it may be useful to traders
The usefulness of this publication comes from clarity, not from exaggerated claims. Many traders already work with price structure, trend tools, moving averages, or oscillators. What is often less explicit is whether money flow is becoming more balanced or more one-sided while those other reads are developing. This script offers a structured way to inspect that question and to keep the answer visually organized.
By focusing on directional money-flow asymmetry, persistence, threshold behavior, and event transitions, the study provides a clear framework for discussing flow conditions without collapsing everything into a generic overbought/oversold interpretation.
Risk disclosure
This script is an analytical indicator. It is not financial advice, not a promise of future results, and not a substitute for risk management, market context, or independent judgment. It does not guarantee profitable trades, trend continuation, reversals, or improved performance. Use it as one input among others. 指标

指标

TX Volume Spike Overview:
TX Volume Spike Pro is a sophisticated technical analysis tool designed to identify high-probability breakout and breakdown opportunities in STOCK trading. The core philosophy is "Volume confirms price." By combining price action breakout levels with directional volume spikes and advanced momentum filters, this script helps traders filter out market noise and identify institutional accumulation or distribution.
Key Features:
Directional Volume Spike Logic: Unlike standard volume indicators, TX Pro distinguishes between Bullish Spikes (accumulation) and Bearish Spikes (distribution). A signal is only valid if the recent volume surge aligns with the candle's direction.
Hybrid Confirmation System: The "Hybrid" mode integrates several technical indicators—On-Balance Volume (OBV), Money Flow Index (MFI), and Volume Oscillator—to ensure that momentum and money flow are fully supporting the price move.
Breakout/Breakdown Engine: Automatically identifies dynamic resistance (High) and support (Low) levels based on user-defined lookback periods.
Institutional Trend Filter: Includes a 200-period SMA filter to ensure traders stay on the right side of the long-term trend, significantly reducing risk in trending markets.
Professional UI: Features clean visual plots of key levels, directional bar highlighting for volume anomalies, and optimized signal labels.
How to Use:
Bullish Signal (BUY): Triggered when the price crosses over the Resistance level, confirmed by a Bullish Volume Spike within the lookback window, and supported by Hybrid filters (OBV/MFI/VO) if enabled.
Bearish Signal (SELL): Triggered when the price crosses under the Support level, confirmed by a Bearish Volume Spike, and supported by momentum filters.
Recommended Setting: Use the "Hybrid (All Filters)" mode for stock trading to ensure maximum confirmation.
Disclaimer:
This script is a technical analysis tool and should not be considered financial advice. Always use proper risk management and stop-loss orders in your trading strategy. 指标

指标

指标

指标

Double Money Flow Index - DMFI | TR🎯 Overview
Double Money Flow Index - DMFI | TR is an advanced volume‑weighted oscillator developed by Tiagorocha1989 that enhances the classic Money Flow Index (MFI) by applying the MFI formula twice. This “double MFI” approach amplifies shifts in money flow, reduces lag, and helps traders identify accumulation/distribution phases and potential reversals earlier than traditional MFI. With dual‑mode operation (centerline or moving‑average crossovers), an extensive selection of moving average types, and comprehensive visual customization, DMFI provides a powerful tool for volume‑based momentum analysis.
🔧 How It Works
The standard Money Flow Index (MFI) combines price and volume to measure buying and selling pressure, ranging from 0 to 100. Double MFI applies the same logic to the MFI series itself, creating a “momentum of money flow” effect that highlights changes in the underlying MFI’s behaviour.
Core Calculation Logic:
First MFI:
MFI = 100 - (100 / (1 + Money Flow Ratio))
where the period is user‑defined Length MFI and the source is Source MFI.
(MFI internally uses typical price and volume to compute positive and negative money flow.)
Double MFI (DMFI):
DMFI = 2 × MFI - ta.mfi(MFI, Length_MFI)
i.e., the current MFI minus the MFI of MFI (applied to the MFI series) and then doubled, effectively smoothing and amplifying changes in MFI.
Reference Line (Entry_DMFI):
The indicator compares DMFI to a reference line that can be either:
50 Line (classic MFI mode) – the traditional centerline separating bullish ( >50) and bearish ( <50) money flow. Signals occur when DMFI crosses above or below 50.
DMFI MA (enhanced mode) – the reference line becomes a moving average of DMFI itself, providing smoother, filtered signals.
The moving average type and length are fully customizable, with support for 12 different MA variants (see Key Features).
The resulting oscillator oscillates around the chosen reference line:
DMFI above reference → strengthening buying pressure (bullish money flow acceleration)
DMFI below reference → strengthening selling pressure (bearish money flow acceleration)
Magnitude indicates the strength of the acceleration. Values above 80 or below 20 are often considered overbought/oversold in classic MFI, but DMFI is unbounded.
✨ Key Features
🔹 Dual Operating Modes
50 Line Mode: Classic signals when DMFI crosses above or below 50 – simple and intuitive for MFI users.
DMFI MA Mode: Smoother signals when DMFI crosses its own moving average – reduces whipsaws in choppy markets.
🔹 Extensive Moving Average Selection
Choose from 12 MA types for the DMFI MA line, each with its own characteristics:
EMA, SMA, RMA, WMA, VWMA, HMA, DEMA, TEMA, TRIMA, FRAMA, SWMA, T3.
The T3 MA includes an adjustable T3 Factor for fine‑tuning smoothness.
🔹 Customizable MFI Parameters
Length MFI: Lookback period for both MFI calculations (default 14).
Source MFI: Price source for the first MFI (default Close).
(MFI internally uses typical price and volume.)
🔹 Extended Range Visualization
Gradient fills are drawn between DMFI and the reference line, with fixed bounds at 120 and 0. These zones help visualise extreme readings, referencing classic MFI overbought/oversold levels while accommodating DMFI’s unbounded nature.
🔹 Customizable Color Themes
Eight distinct color schemes to match your chart aesthetics:
Classic, Modern, Robust, Accented, Monochrome, Moderate, Aqua, Cosmic
Each theme defines separate colors for bullish and bearish states.
🔹 Comprehensive Visual Feedback
Colored DMFI Line: Changes colour based on its position relative to the reference line.
Signal Line: Yellow line representing the 50 or MA reference.
Gradient Fill Zones: Semi‑transparent fills showing extreme money flow areas (overbought/oversold zones).
Dynamic Zone Fills: Additional fill between DMFI and the reference line, coloured by the prevailing bias.
Color‑Coded Candles: Bars reflect the current DMFI bias (above or below reference).
Signal Markers: Triangle up/down symbols at crossover points.
Live Value Display: Current DMFI value shown in a floating label near the last bar.
Trend Table: Bullish/Bearish status displayed in a table on the chart.
🔹 Ready‑to‑Use Alerts
Built‑in alert conditions trigger LONG on bullish crossovers and SHORT on bearish crossunders, for both operating modes.
⚙️ Settings Summary
Setting Description Default
Color Choice Select from eight visual themes Classic
Length MFI Lookback period for both MFI calculations 14
Source MFI Price source for the first MFI Close
Entry/Exit Signal Choose between 50‑line or DMFI MA mode 50
Length MA Moving average period for DMFI MA mode 365
Moving Average Type of moving average for the signal line (12 options) EMA
T3 Factor Factor for T3 moving average (0–1) 0.7
📈 Practical Applications
🔹 Money Flow Acceleration Detection
The slope and position of DMFI relative to the reference line quickly reveal whether money flow is accelerating or decelerating. Steeply rising DMFI indicates strengthening buying pressure; steeply falling DMFI signals strengthening selling pressure.
🔹 50‑Line Crossovers
In 50 Line mode, crossovers provide clear signals:
Crossover above 50 → shift from bearish to bullish money flow, potential trend reversal up.
Crossunder below 50 → shift from bullish to bearish money flow, potential trend reversal down.
🔹 Signal‑Line Crossovers
In DMFI MA mode, crossovers between DMFI and its moving average generate filtered signals:
DMFI crosses above its MA → bullish signal (buying pressure accelerating).
DMFI crosses below its MA → bearish signal (selling pressure accelerating).
These signals work well in trending markets by reducing false entries.
🔹 Overbought / Oversold Conditions
Although DMFI is unbounded, traditional MFI levels (e.g., 80/20) can be referenced. Extreme DMFI readings (above 120 or below 0) often coincide with strong money flow and may precede reversals or pullbacks, especially when combined with divergences.
🔹 Divergence Trading
Double MFI is excellent for spotting divergences with price:
Bullish Divergence: Price makes a lower low while DMFI forms a higher low → possible upside reversal (accumulation).
Bearish Divergence: Price makes a higher high while DMFI forms a lower high → possible downside reversal (distribution).
Divergences are most reliable after extended trends or when DMFI is at extreme levels.
🔹 Money Flow Confirmation
The magnitude of DMFI confirms the strength of money flow:
Large positive values (well above reference) → strong buying pressure.
Large negative values (well below reference) → strong selling pressure.
Values nearing the reference line → money flow slowing, potential trend change.
🔹 Centerline Rejections
When DMFI approaches the reference line (50 or MA) but reverses before crossing, it can signal continuation of the current money flow trend – a common pattern in strong trends.
🔹 Multiple Timeframe Analysis
Compare DMFI readings across timeframes: higher‑timeframe DMFI defines the primary money flow trend, while lower‑timeframe DMFI helps pinpoint entry and exit timing.
🎯 Ideal For
✅ MFI Enthusiasts looking for a more responsive, smoothed version of the classic volume‑weighted indicator.
✅ Volume‑Based Traders wanting to measure buying/selling pressure acceleration.
✅ Trend Traders seeking confirmation of trend strength and direction with volume.
✅ Momentum Traders wanting an early view of money flow shifts.
✅ Divergence Traders looking for leading reversal signals in price/volume relationships.
✅ Swing Traders capturing medium‑term money flow shifts.
✅ System Developers needing a robust, customisable crossover‑based strategy.
✅ Beginner Traders who appreciate clear visual signals and multiple learning modes.
📌 Key Takeaways
Double MFI Logic: Applying the MFI formula twice amplifies money flow signals and reduces lag compared to standard MFI.
Dual‑Mode Flexibility: Choose 50‑line simplicity for classic MFI entries or MA‑smoothed signals for filtered trades.
Unbounded Nature: DMFI has no fixed upper/lower limits; traditional levels (e.g., 80/20, 120/0) serve as useful reference zones.
Volume Integration: Because MFI incorporates volume, DMFI provides a unique volume‑weighted perspective on momentum.
Extensive MA Options: 12 moving average types give you complete control over the smoothness and responsiveness of the signal line.
Rich Visuals: Colour themes, gradient fills for extreme zones, candle colouring, and live value labels provide immediate market context.
Divergence Capability: The double calculation often reveals divergences earlier than simple MFI.
Alert‑Ready: Pre‑built alerts for both LONG and SHORT signals based on crossovers.
⚠️ Important Notes
Because DMFI is unbounded, its scale can vary significantly between instruments and timeframes. The gradient fills at 120 and 0 are arbitrary reference points derived from classic MFI overbought/oversold levels; they may not represent actual extreme conditions for all instruments.
The default Length MFI of 14 is the standard MFI period, offering a balanced perspective. Shorter lengths (e.g., 9) produce more responsive signals, while longer lengths (e.g., 21) smooth out noise.
The default Length MA of 365 in DMFI MA mode is designed for a long‑term context on daily charts; adjust it to match your trading horizon.
Divergences are most reliable when they occur after extended trends and are confirmed by other tools.
Always combine Double MFI with proper risk management and additional confirmation before live deployment.
Disclaimer: This indicator is provided for educational and informational purposes only. Past performance does not guarantee future results. Always test thoroughly and align with your personal risk management strategy. 指标

Money Flow Index - MFI | TR🎯 Overview
Money Flow Index - MFI | TR is a volume-weighted momentum oscillator that measures the strength of money flowing in and out of a security over a specified period. Developed by Tiagorocha1989, this enhanced version of the classic Money Flow Index combines price and volume data to identify overbought and oversold conditions, detect divergences, and generate clear trading signals with dual-mode operation and comprehensive visual features.
🔧 How It Works
The Money Flow Index (MFI) is often referred to as the volume-weighted Relative Strength Index (RSI). It uses both price and volume to measure buying and selling pressure, providing a more complete picture of market dynamics than price-only oscillators.
Core Calculation Logic:
The MFI calculation follows these steps:
Typical Price: (High + Low + Close) / 3 for each period
Money Flow: Typical Price × Volume
Money Flow Ratio:
If Typical Price increases, it's Positive Money Flow
If Typical Price decreases, it's Negative Money Flow
Money Flow Ratio = (Sum of Positive Money Flow over n periods) / (Sum of Negative Money Flow over n periods)
MFI: 100 - (100 / (1 + Money Flow Ratio))
The resulting oscillator oscillates between 0 and 100, with:
Readings above 80 suggesting overbought conditions (potential reversal down)
Readings below 20 suggesting oversold conditions (potential reversal up)
50 level serving as the centerline indicating neutral momentum
The indicator compares MFI to a reference line that can be either:
The traditional 50 level (centerline)
A user-defined moving average of MFI itself (MFI MA mode)
✨ Key Features
🔹 Dual Operating Modes
50 Level Mode: Classic MFI implementation where signals occur when MFI crosses above or below the 50 centerline, indicating momentum shifts
MFI MA Mode: Enhanced version where signals occur when MFI crosses its own moving average, providing smoother, filtered entries
🔹 Flexible Moving Average Selection
Choose from six MA types for the MFI MA mode:
EMA (Exponential Moving Average) for responsive signals
SMA (Simple Moving Average) for smoother readings
RMA (Rolling Moving Average) for weighted recent data
WMA (Weighted Moving Average) for customizable weighting
VWMA (Volume-Weighted Moving Average) incorporating volume
HMA (Hull Moving Average) for reduced lag
🔹 Customizable MFI Parameters
Length MFI: Lookback period for MFI calculation (default 14)
Source MFI: Price source for calculations (default Close)
🔹 Volume Integration
Unlike price-only oscillators, MFI incorporates volume, making it particularly effective for identifying genuine buying and selling pressure.
🔹 Customizable Color Themes
Eight distinct color schemes to match your charting preferences:
Classic – Green for bullish, Red for bearish
Modern – White for bullish, Purple for bearish
Robust – Amber for bullish, Maroon for bearish
Accented – Violet for bullish, Pink for bearish
Monochrome – Light gray for bullish, Dark gray for bearish
Moderate – Green for bullish, Red for bearish
Aqua – Blue for bullish, Orange for bearish
Cosmic – Pink for bullish, Purple for bearish
🔹 Comprehensive Visual Feedback
Colored MFI Line: Changes color based on position relative to the reference line
Signal Line: Yellow line showing 50 or MA reference
Gradient Fill Zones: Clear visualization of overbought (above 80) and oversold (below 20) conditions
Dynamic Zone Fills: Semi-transparent fills showing when MFI is above or below the reference line
Color-Coded Candles: Bars reflect current MFI bias (above or below reference)
Signal Markers: Triangle up/down symbols at crossover points
Live Value Display: Current MFI value shown in a floating label
Trend Table: Bullish/Bearish status displayed on the chart
🔹 Ready-to-Use Alerts
Built-in alert conditions trigger LONG signals on bullish crossovers and SHORT signals on bearish crossunders across both operating modes.
⚙️ Settings Summary
Color Choice: Select from eight visual themes (Default: Classic)
Length MFI: Lookback period for MFI calculation (Default: 14)
Source MFI: Price source for calculations (Default: Close)
Entry/Exit Signal: Choose between 50 level or MFI MA mode (Default: 50)
Length MA: Moving average period for MFI MA mode (Default: 365)
MFI MA Type: Moving average method for signal line (Default: EMA)
📈 Practical Applications
🔹 Overbought/Oversold Detection
Traditional MFI usage identifies extreme conditions:
Readings above 80 suggest overbought conditions and potential reversal down
Readings below 20 suggest oversold conditions and potential reversal up
The indicator provides gradient fills in these zones for visual clarity
Volume weighting makes these signals more reliable than RSI alone
🔹 Centerline Crossovers
In 50 Level mode, crossovers provide momentum signals:
Crossover above 50 → Bullish momentum strengthening (buying pressure exceeding selling pressure)
Crossunder below 50 → Bearish momentum strengthening (selling pressure exceeding buying pressure)
🔹 Signal Line Crossovers
In MFI MA mode, crossovers between MFI and its moving average provide filtered signals that reduce whipsaws in ranging markets while maintaining sensitivity in trends.
🔹 Divergence Trading
MFI is excellent for spotting divergences, often more reliable than price-only oscillators due to volume confirmation:
Bullish Divergence: Price makes lower low, MFI makes higher low → Potential upside reversal (weakening selling pressure)
Bearish Divergence: Price makes higher high, MFI makes lower high → Potential downside reversal (weakening buying pressure)
Divergences are most significant when occurring at extreme levels (above 80 or below 20)
🔹 Volume Confirmation
The volume component adds an extra dimension:
MFI rising with price confirms bullish trend (volume supporting the move)
MFI falling while price rises suggests weak buying pressure (potential reversal)
MFI rising while price falls suggests hidden accumulation
🔹 Failure Swings
Look for MFI moves above 80 (or below 20), a pullback, and then a move beyond the previous extreme, confirmed by volume patterns.
🔹 Multiple Timeframe Analysis
Compare MFI readings across different timeframes:
Higher timeframe MFI confirms primary trend direction with volume confirmation
Lower timeframe MFI identifies entry timing and short-term momentum shifts
🎯 Ideal For
✅ Volume-Aware Traders seeking to incorporate volume into momentum analysis
✅ Mean Reversion Traders looking for overbought and oversold opportunities with volume confirmation
✅ Divergence Traders wanting more reliable reversal signals through volume confirmation
✅ Swing Traders capturing medium-term momentum shifts with volume support
✅ System Developers needing volume-weighted momentum signals
✅ Institutional Traders who value volume analysis for confirmation
📌 Key Takeaways
Volume-Weighted Momentum: Unlike RSI, MFI incorporates volume, providing a more complete picture of buying and selling pressure
Dual-Mode Flexibility: Choose between classic 50-level crossovers for traditional signals or MA-smoothed signals for filtered entries
Comprehensive Visualization: Color themes, gradient fills for overbought/oversold zones, candles, and labels provide immediate market awareness
Divergence Capability: Volume-weighted divergences are often more reliable than price-only divergences
Alert-Ready: Built-in alerts for both LONG and SHORT signals across both operating modes
⚠️ Important Notes
MFI, like RSI, can remain in overbought or oversold territory for extended periods during strong trends. The default length of 14 is standard but can be adjusted for different trading styles. The 365-day MA default in MFI MA mode is designed for longer-term trend context on daily charts. Volume spikes can cause sudden MFI movements; consider using smooth volume inputs if available. Divergences are most reliable when they occur at extreme readings. Always combine with proper risk management and additional confirmation for best results.
Disclaimer: This indicator is provided for educational and informational purposes only. Past performance is not indicative of future results. Always conduct thorough testing and align with your risk management strategy before live deployment. 指标

Money Flow Index - MFI🎯 Overview
This is an advanced Money Flow Index - MFI indicator that combines volume-weighted momentum analysis with dynamic moving average filtering. Unlike basic MFI implementations, this version features gradient overbought/oversold zones, multiple color themes, and a clear signal dashboard for precise money flow identification.
🧩 Core Components
1. ⚙️ Technical Foundation
📊 Primary Calculation: Uses TradingView's built-in ta.mfi() function which incorporates both price and volume data
📈 Dual Analysis Components:
MFI Line: Volume-weighted momentum oscillator
MA Filter: Customizable moving average acting as dynamic signal line
Threshold Zones: Gradient fills for overbought and oversold conditions
⚡ Volume Integration: Unique ability to combine price action with trading volume for more reliable signals
2. 🎛️ Configuration Parameters
📏 MFI Length: Default 14 periods (standard setting)
🔄 MA Filter Settings:
Length: Customizable (default 365 periods)
Type: 6 options available (EMA, SMA, RMA, WMA, VWMA, HMA)
🎨 Color Themes: 5 visual schemes consistent with your indicator suite:
Classic, Modern, Robust, Accented, Monochrome
📊 Signal Interpretation:
🟢 BULLISH: MFI > MA Filter (money flow above trend)
🔴 BEARISH: MFI < MA Filter (money flow below trend)
⚠️ OVERBOUGHT: MFI > 80 (potential reversal zone)
⚠️ OVERSOLD: MFI < 20 (potential reversal zone)
3. 🎨 Visual Elements
🚨 Gradient Zones:
Overbought zone : Red gradient intensifying toward 100
Oversold zone : Green gradient intensifying toward 0
📋 Dashboard Display: Top-right status indicator showing "⬆️ Bullish" or "⬇️ Bearish"
📊 Dynamic Coloring: MFI line changes color based on position relative to MA
⚡ Trading Applications
📈 Primary Uses:
🎯 Money Flow Direction:
MFI > MA = Bullish money flow regime
MFI < MA = Bearish money flow regime
💪 Trend Strength with Volume Confirmation:
MFI considers both price movement AND volume
Higher volume moves have more significance
Validates price trends with volume support
🚨 Extreme Zone Signals:
Overbought: MFI > 80 (potential sell opportunity)
Oversold: MFI < 20 (potential buy opportunity)
📊 Zone Analysis:
🔴 Overbought Zone :
Red gradient fills
Indicates excessive buying pressure
Watch for bearish reversals
🟢 Oversold Zone :
Green gradient fills
Indicates excessive selling pressure
Watch for bullish reversals
🟡 Equilibrium: Yellow MA line acts as volume-weighted trend filter
🎨 Customization Options
👁️ Display Features:
📊 Dual Components: Always shows both MFI line and MA filter
🎨 Gradient Visualization: Automatic fill for overbought/oversold conditions
📋 Status Dashboard: Clear bullish/bearish money flow indication
📈 Customizable MA: Choose from 6 different moving average types
🎨 Visual Themes: (Consistent suite)
🎨 Classic: Green/Red (traditional volume-weighted colors)
🚀 Modern: Cyan/Purple (contemporary)
💪 Robust: Amber/Deep Purple (high contrast)
🌈 Accented: Purple/Magenta (vibrant)
⚫⚪ Monochrome: Light Gray/Dark Gray (minimalist)
🔔 Alert System
🟢 LONG Alert: Triggers when MFI crosses above MA
🔴 SHORT Alert: Triggers when MFI crosses below MA
📧 Format: Includes ticker symbol for tracking
⚡ Key Advantages
✅ Strengths:
🎯 Volume-Weighted Accuracy: Combines price and volume for more reliable signals
💪 Overbought/Oversold Filter: Built-in 80/20 thresholds with gradient visualization
👁️ Clear Trend Identification: MA filter separates noise from meaningful money flow
🔄 Flexible Configuration: Multiple MA types for different trading styles
📊 Professional Dashboard: Immediate money flow status recognition
📊 Optimal Settings:
⚡ Short-term Trading: MFI Length 10-14, MA Length 20-50
📊 Medium-term Trading: MFI Length 14-20, MA Length 50-100
📈 Long-term Trading: MFI Length 20-30, MA Length 100-365
🏆 Unique Features:
🎯 Volume Integration: The only oscillator in your suite that includes volume data
📊 Gradient Thresholds: Visual intensity shows proximity to extremes
🎨 Consistent Design: Matches your indicator family aesthetics
📋 Money Flow Dashboard: Quick visual confirmation of volume trends
🔧 Dual Analysis: Combines oscillator with dynamic trend filter
🔄 Trading Strategies
1. Basic Money Flow Strategy:
Go LONG when MFI crosses above MA from oversold
Go SHORT when MFI crosses below MA from overbought
Exit when opposite extreme is reached
2. Divergence Detection:
Price makes higher high, MFI makes lower high → Bearish divergence (selling pressure weakening)
Price makes lower low, MFI makes higher low → Bullish divergence (buying pressure increasing)
3. Volume Confirmation:
Strong trend + rising MFI = High conviction move
Weak trend + declining MFI = Potential reversal
📈 Performance Tips
Volume Matters: MFI is most effective in markets with consistent volume
Extreme Zones: levels often act as support/resistance for the indicator
Divergence Signals: More reliable than simple overbought/oversold readings
Trend Alignment: MFI above MA in uptrend, below MA in downtrend
Confirmation: Combine with price action at key support/resistance levels
This enhanced MFI indicator provides professional-grade volume-weighted analysis with intuitive visualization, allowing traders to identify money flow trends, spot potential reversals at extremes, and filter signals through the customizable moving average for higher accuracy trading decisions! 📊💰 指标

Blockcircle Global Central Bank Balance Sheet and Money SupplyOVERVIEW
This indicator aggregates money supply (M2) and central bank balance sheet data from the world's largest economies into a single, unified view of global liquidity conditions. Rather than manually tracking dozens of separate data feeds or building your own aggregation logic, you get a ready-to-use tool that pulls from FRED, TradingView Economics, and real-time FX rates to convert everything into USD terms automatically.
Global liquidity has historically served as a leading indicator for risk assets. When central banks expand their balance sheets and the money supply grows, capital tends to flow into equities, crypto, and other risk-on assets. When liquidity contracts, markets often follow. This indicator gives you that macro context directly on your chart.
The global liquidity movement (expansionary or contractionary) often leads to asset price appreciation/depreciation in CRYPTOCAP:BTC , SP:SPX , etc
WHAT MAKES IT ORIGINAL AND DIFFERENT
Combines both M2 money supply AND central bank balance sheet data in one place, whereas most existing tools focus on only one metric
Aggregates 11 economies for M2 (USA, EU, China, Japan, UK, Canada, India, Russia, Brazil, Australia, Switzerland) and 10 central banks for balance sheet data
Automatically handles currency conversion using live FX rates so all values display in USD
Includes a dedicated US Net Liquidity calculation (Fed Balance Sheet minus Reverse Repo minus TGA) which filters out temporary distortions that other aggregate tools ignore
Provides granular country by country breakdown in the information table so you can identify which central banks are driving the aggregate trend
Offers four moving average types (SMA, EMA, WMA, RMA) for trend smoothing with configurable length
HOW IT WORKS
The indicator requests monthly M2 data from TradingView's Economics feeds for each included country. Central bank balance sheet data is pulled the same way. All non-USD values are converted using daily FX rates from major currency pairs. The script then sums these converted values to produce the Global M2 and Global CBBS lines.
For US liquidity specifically, the script pulls weekly data for the Reverse Repo Program (RRP) and Treasury General Account (TGA) from FRED. Net Liquidity is calculated as: Fed Balance Sheet minus RRP minus TGA. This formula removes funds parked in reverse repos and Treasury cash balances, showing what is actually circulating in the financial system.
KEY FEATURES
Global M2 Money Supply line tracking 11 major economies with individual toggles for each country
Global Central Bank Balance Sheet line tracking 10 central banks with individual toggles
US-specific components, including Reverse Repo, TGA, and Net Liquidity as separate plot lines
Moving average overlays with selectable type and length for identifying trend direction
Fill the option between M2 and CBBS lines to visualize the gap between money supply and central bank assets
Value labels at line endpoints showing current readings and period-over-period percentage change
Comprehensive information table with optional country breakdown view
Full color customization for all lines, configurable line width, and style options
Alert conditions for significant M2 and CBBS changes plus MA crossover signals
HOW TO USE
Add to any chart and observe the overall direction of global liquidity. Rising lines generally support risk on positioning, while declining lines suggest caution
Watch for divergences between the M2 and CBBS lines. If money supply grows faster than central bank assets, private credit may be expanding. If CBBS rises faster, central banks are actively injecting liquidity
Use the US Net Liquidity line to understand short term dollar liquidity conditions separate from longer term global trends
Enable moving averages to filter noise and identify when liquidity trends are changing direction
Toggle individual countries on or off in the settings to see how specific regions contribute to the total
Reference the information table for exact values and percentage changes without leaving your chart
SETTINGS BREAKDOWN
Table Settings: position, text size, and whether to show the country breakdown
Display Settings: toggle visibility for each line, fill area, value labels, percent labels, and the info table
Line Styling: customize colors for each metric, adjust line width, and select solid, dashed, or dotted style
Moving Average: enable or disable MA overlays for M2 and CBBS, select MA type, and set length
Global M2 Countries: individually enable or disable each of the 11 economies
US Liquidity Components: toggle RRP and TGA data
Global CBBS Countries: individually enable or disable each of the 10 central banks
Alerts: set percentage threshold for change based alerts
IMPORTANT CONSIDERATIONS
Data updates depend on the publication schedule of each source. M2 and CBBS data are typically monthly with some delay. US Fed Balance Sheet, US RRP and US TGA update weekly
FX conversion uses daily close rates which may introduce minor discrepancies during volatile currency periods
Some emerging market data may have longer reporting lags than developed market data
Hope you find it useful and impactful to your trading and investment decisions! If you have any questions at all, please just ask, happy to help 指标