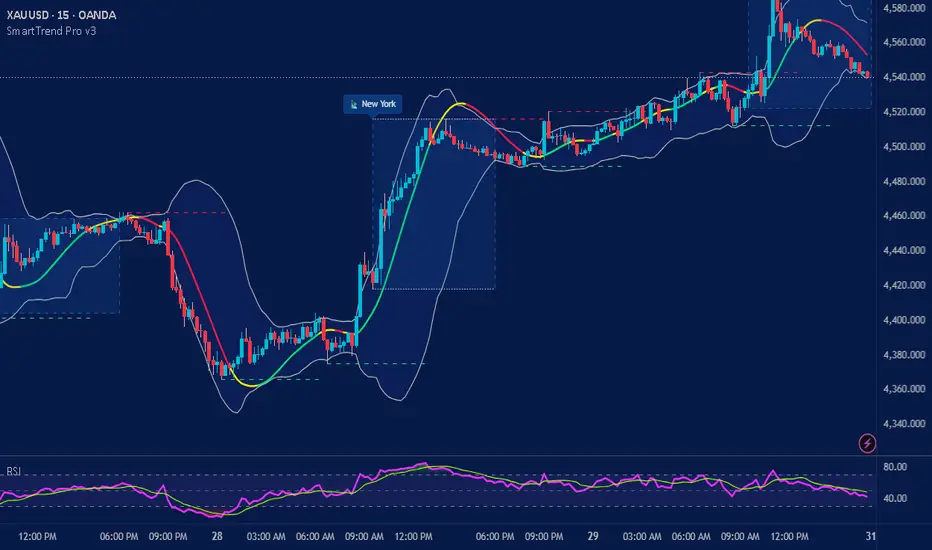
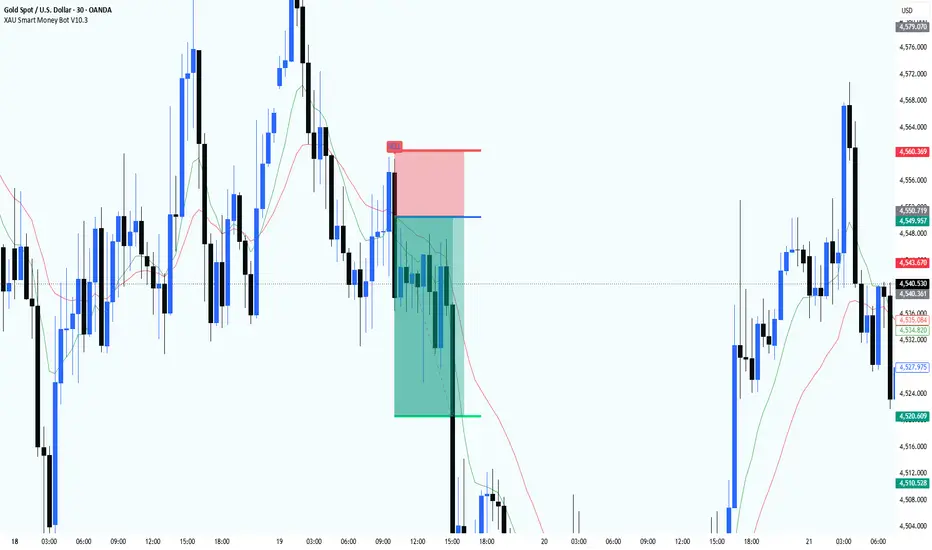
指标

指标

指标

V-AEMA VMR [LB]Concept
The V-AEMA VMR (Volume-Adaptive Exponential Moving Average with Volatility-Modulated Regime) is a hybrid trend-following indicator that combines an EMA baseline with a volatility-based drift component. It produces a dynamic core line whose colour reflects the trend regime, surrounded by two levels of adaptive bands that expand or contract based on volume intensity. The indicator generates directional entry signals when price breaks the first band in the direction of the trend, and projects take-profit zones when price fully exits both bands.
Mathematical Foundation
The core line (Hybrid Line) is a weighted blend of a standard EMA and a volatility-shifted version of that same EMA :
HybridLine = EMA * W + (EMA + Drift) * (1 - W)
where the drift is derived from the Z-Score of price relative to the EMA, scaled by ATR :
Drift = Z_Score * ATR * 0.35
Z_Score = (Price - EMA) / StdDev(Price, L_vola)
Band width starts from a base volatility measure combining standard deviation and ATR :
BaseWidth = StdDev * 0.65 + ATR * 0.35
This base is then adjusted by a volume ratio and user-defined multipliers :
UpperWidth = BaseWidth * (BaseUpMult + (VolRatio - 1) * VolImpactUp)
LowerWidth = BaseWidth * (BaseDnMult + (VolRatio - 1) * VolImpactDn)
where VolRatio = min(max(Volume / SMA(Volume, L_vol), 0.35), 2.50) .
Two band levels are generated : Band 1 at HybridLine +/- Width, and Band 2 (extreme) at HybridLine +/- Width * 1.55 (upper) / 1.40 (lower).
What Problem Does It Solve ?
Conventional envelope indicators (Bollinger Bands, Keltner Channels) apply fixed multipliers to a single volatility metric and ignore volume dynamics. The V-AEMA VMR adapts its band width to both volatility and volume surges, producing wider bands during high-participation moves and narrower bands during quiet periods. The hybrid core line reduces pure EMA lag by incorporating a volatility offset, while the dual-band structure filters signals by strength : a break of Band 1 triggers an entry, while a break of Band 2 confirms an explosive move and projects a take-profit zone.
How To Interpret
Core line colour – cyan/green indicates the hybrid line is rising (bull regime) ; magenta/red indicates it is falling (bear regime).
Cloud and bands – the area between Band 1 and Band 2 forms a halo that thickens when volume expands. Narrow bands suggest low conviction or consolidation.
Entry signals – a triangle appears below the bar when price crosses above Upper Band 1 while the hybrid line is rising (long). A triangle appears above the bar when price crosses below Lower Band 1 while the hybrid line is falling (short). These signals are confirmed by the trend direction.
Take-profit zones – when the entire bar (high and low for shorts, low and high for longs) clears the extreme band (Band 2) in the direction of the signal, a coloured box is projected forward. The box represents a potential target zone based on the breakout amplitude and ATR, scaled by the TP Factor.
Info panel – displays the current regime (BULL/BEAR), the volume ratio (values above 1.0 indicate above-average participation), and the current upper/lower deviation values in price units.
Parameters
EMA Length – period of the base exponential moving average (default 55).
Volatility Length – period for the standard deviation used in the Z-Score calculation (default 34).
Volume Length – period for the volume moving average used in the volume ratio (default 34).
EMA Weight – blend ratio between the pure EMA and the volatility-drifted version. Higher values produce a smoother line ; lower values make it more reactive to volatility (default 0.80).
Upper Base Deviation – core multiplier for the upper band width before volume adjustment (default 1.55).
Lower Base Deviation – core multiplier for the lower band width before volume adjustment (default 1.05).
Volume Impact Upper/Lower – sensitivity of the upper and lower bands to the volume ratio. Higher values make bands expand more aggressively when volume surges (default 0.95 / 0.55).
ATR Length – period of the Average True Range used in band width and TP zone calculations (default 14).
Show Cloud – toggles the filled areas between bands.
Show Info Panel – toggles the real-time dashboard.
Show Signals – toggles the entry triangles.
Show TP Zones – toggles the take-profit projection boxes.
TP Projection Bars – how many bars forward the TP zone extends.
TP Factor – scales the height of the TP zone relative to the breakout range.
Max Historical TP Zones – limits the number of TP boxes kept on the chart.
Reference
This indicator is a proprietary design synthesising concepts from adaptive moving averages (Kaufman, Ehlers), volatility envelopes (Bollinger, Keltner), and volume-weighted band models. It does not correspond to a single academic publication. 指标

策略
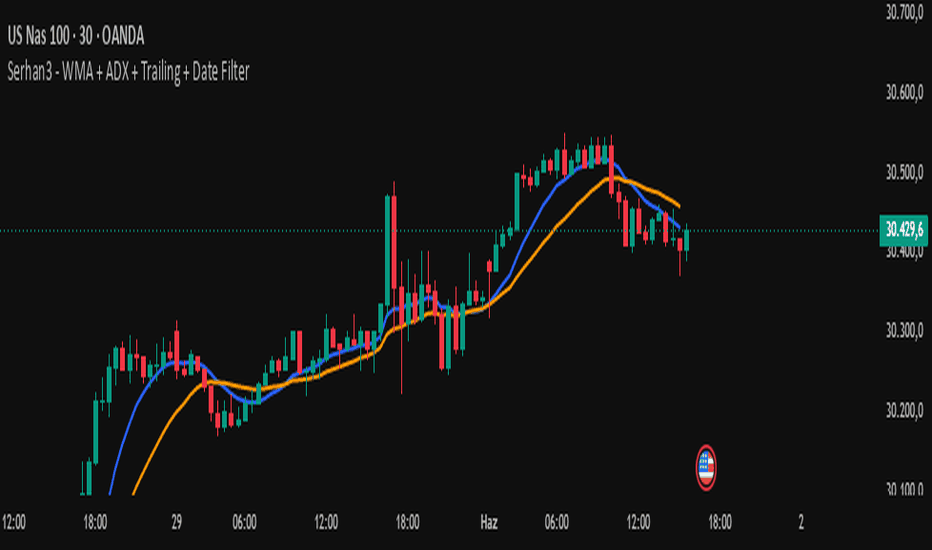
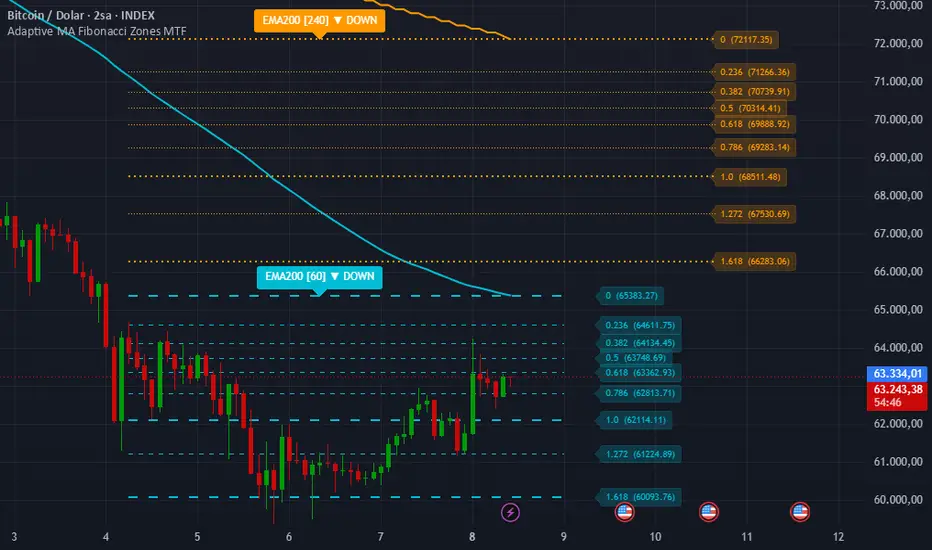
Adaptive MA Fibonacci Zones MTF# Adaptive MA Fibonacci Zones MTF
Adaptive MA Fibonacci Zones MTF is a multi-timeframe technical analysis tool that projects Fibonacci-based price levels around a selected moving average.
The indicator allows traders to choose from multiple moving average types, including EMA, SMA, WMA, SMMA, DEMA, TEMA, HMA, VWMA, ALMA, and KAMA. Two independent higher timeframes can be analyzed simultaneously, making it easier to compare trend structure and potential reaction zones across different market perspectives.
### Features
• Supports multiple moving average calculation methods
• Displays two configurable higher timeframes on a single chart
• Automatically generates Fibonacci-based projection levels around each moving average
• Dynamic bullish and bearish level calculation depending on price position relative to the selected moving average
• Optional Fibonacci level labels
• Visual trend direction labels for each timeframe
• Useful for identifying potential support, resistance, pullback, and expansion areas
### How It Works
The script calculates a selected moving average on two user-defined timeframes. A customizable percentage range is then applied around each moving average, and Fibonacci ratios are projected within that range. When price is above the moving average, levels are projected upward. When price is below the moving average, levels are projected downward.
### Notes
This indicator is designed as a visual analysis tool and should not be considered financial advice. Fibonacci levels and moving averages are analytical references that may be used alongside other forms of technical analysis and risk management techniques.
指标

MACD Pressure Zones | Alpha S+MACD Pressure Zones
MACD Pressure Zones is a normalized MACD histogram oscillator designed to show momentum pressure on a 0 to 100 scale.
Instead of displaying the raw MACD histogram around a zero line, this script normalizes the histogram over a selected lookback period and maps it into a bounded oscillator range. This allows users to compare MACD histogram pressure across different market conditions with fixed reference zones such as 90, 85, 50, 15, and 10.
The script does not provide entry or exit recommendations. Its purpose is to help users study momentum pressure, extended momentum areas, neutral pressure, and cooling or heating behavior inside a simplified MACD-based zone structure.
────────────────────
Core Concept
────────────────────
The standard MACD histogram shows the distance between the MACD line and the signal line.
When the histogram expands, momentum pressure is increasing.
When the histogram contracts, momentum pressure is weakening.
This script takes that MACD histogram value and normalizes it into a 0 to 100 range.
The normalized structure uses five main reference levels:
• 90: Extreme upper momentum pressure
• 85: Upper pressure zone
• 50: Neutral pressure level
• 15: Lower pressure zone
• 10: Extreme lower momentum pressure
The red line is a smoothed version of the normalized MACD histogram. It helps users read the broader momentum pressure curve rather than reacting to every individual histogram bar.
────────────────────
What This Script Shows
────────────────────
The script can display:
• normalized MACD histogram columns
• smoothed MACD pressure line
• 90 and 85 upper pressure levels
• 50 neutral pressure level
• 15 and 10 lower pressure levels
• upper and lower zone background highlights
• histogram expansion or contraction state
• current pressure zone
• momentum heating or cooling state
• positive or negative pressure bias
• number of bars spent inside upper or lower pressure zones
• optional status panel
These elements are designed to help users identify whether MACD histogram pressure is extended, recovering, cooling, expanding, or returning toward neutral.
────────────────────
How It Works
────────────────────
1. The script calculates the MACD line using the selected fast and slow EMA lengths.
2. The signal line is calculated from the MACD line.
3. The MACD histogram is calculated as MACD minus signal.
4. The histogram is normalized over the selected lookback period.
5. The normalized value is mapped into a 0 to 100 oscillator range.
6. A smoothed red pressure line is calculated from the normalized oscillator.
7. The script compares the pressure line with the 90, 85, 50, 15, and 10 reference levels.
8. Zone background highlights appear when the pressure line enters upper or lower pressure areas.
9. Histogram columns become visually stronger or weaker depending on expansion or contraction.
10. The status panel summarizes current pressure, zone, momentum state, bias, zone duration, and histogram condition.
This structure converts MACD histogram behavior into a cleaner zone-based momentum pressure map.
────────────────────
Inputs And Customization
────────────────────
Users can adjust:
• MACD fast length
• MACD slow length
• MACD signal length
• source price
• normalization lookback
• red line smoothing length
• 0 to 100 clamping
• extreme upper pressure level
• upper pressure level
• neutral pressure level
• lower pressure level
• extreme lower pressure level
• zone background visibility
• histogram visibility
• red line visibility
• status panel visibility
• panel position
• panel text size
• histogram colors
• red line color
• reference level color
• panel background color
The default levels are designed around a 90 / 85 / 50 / 15 / 10 pressure-zone framework.
────────────────────
Visual Elements
────────────────────
The script includes:
• normalized histogram columns
• smoothed red pressure line
• horizontal reference levels
• upper pressure background
• lower pressure background
• status panel
The histogram columns show the normalized MACD histogram value.
The red line smooths the normalized histogram and makes the pressure cycle easier to read.
The 50 level acts as the neutral pressure reference.
The 85 and 90 levels mark upper momentum pressure zones.
The 15 and 10 levels mark lower momentum pressure zones.
The panel summarizes the current state without adding directional trade labels to the chart.
────────────────────
Reference States
────────────────────
Extreme Upper Pressure:
The smoothed pressure line is at or above the upper extreme level.
Upper Pressure:
The smoothed pressure line is inside the upper pressure zone.
Positive Pressure:
The pressure line is above the neutral level but below the upper pressure zone.
Neutral Pressure:
The pressure line is near the neutral reference level.
Negative Pressure:
The pressure line is below the neutral level but above the lower pressure zone.
Lower Pressure:
The smoothed pressure line is inside the lower pressure zone.
Extreme Lower Pressure:
The smoothed pressure line is at or below the lower extreme level.
Heating:
The smoothed pressure line is rising.
Cooling:
The smoothed pressure line is falling.
Expanding:
The normalized histogram is increasing compared with the prior bar.
Contracting:
The normalized histogram is decreasing compared with the prior bar.
These states are informational and should not be interpreted as trading instructions.
────────────────────
How To Use
────────────────────
Use this script as a MACD histogram pressure and momentum-zone viewer.
General interpretation examples:
• When the red line is above 85, MACD histogram pressure is in an upper extended area.
• When the red line is above 90, the upper pressure condition is more extreme.
• When the red line moves down from the upper pressure zone, momentum pressure may be cooling.
• When the red line is near 50, MACD histogram pressure is closer to neutral.
• When the red line is below 15, MACD histogram pressure is in a lower extended area.
• When the red line is below 10, the lower pressure condition is more extreme.
• When the red line rises from the lower pressure zone, momentum pressure may be heating.
• Zone Bars can help users see how long the pressure line has remained in an upper or lower pressure zone.
• Histogram expansion can show strengthening pressure, while contraction can show fading pressure.
This script is best reviewed together with price action, trend structure, volatility, support and resistance, and higher-timeframe context.
────────────────────
Confirmation And Repainting Notes
────────────────────
The script calculates MACD, the histogram, normalization range, and the smoothed pressure line from available chart data.
On realtime candles, values can change before the candle closes because the MACD histogram and normalization values can update intrabar.
For more conservative analysis, users should review the oscillator after candle confirmation.
The script does not use future price data to predict market direction.
────────────────────
Limitations
────────────────────
This script does not predict future price movement.
It does not provide entry or exit recommendations.
A high pressure reading does not guarantee a reversal.
A low pressure reading does not guarantee a rebound.
MACD histogram behavior can remain extended during strong trends.
Normalization depends on the selected lookback period, so readings may change when the lookback setting changes.
Different symbols and timeframes may require different settings.
This script should not be used as a standalone trading system.
────────────────────
Disclaimer
────────────────────
This publication is for educational and informational chart analysis only.
It does not constitute financial advice, investment advice, or a recommendation to trade any financial instrument.
All trading and investment decisions are the responsibility of the user.
━━━━━━━━━━━━━━━━━━━━
MACD Pressure Zones
MACD Pressure Zones는 MACD 히스토그램을 0~100 범위로 정규화하여 모멘텀 압력 구간을 보여주는 오실레이터형 지표입니다.
일반 MACD 히스토그램을 0선 중심으로 표시하는 대신, 이 스크립트는 선택한 lookback 구간 안에서 히스토그램 값을 정규화하고 이를 고정된 오실레이터 범위로 변환합니다. 이를 통해 90, 85, 50, 15, 10과 같은 기준 구간을 사용해 다양한 시장 상황의 MACD 히스토그램 압력을 비교할 수 있습니다.
이 지표는 진입 또는 청산 추천을 제공하지 않습니다. 목적은 모멘텀 압력, 확장된 모멘텀 구간, 중립 압력, cooling 또는 heating 상태를 단순한 MACD 기반 구간 구조 안에서 분석하는 것입니다.
────────────────────
핵심 개념
────────────────────
일반 MACD 히스토그램은 MACD 라인과 시그널 라인 사이의 거리를 보여줍니다.
히스토그램이 확장되면 모멘텀 압력이 증가하는 상태로 볼 수 있습니다.
히스토그램이 수축되면 모멘텀 압력이 약해지는 상태로 볼 수 있습니다.
이 스크립트는 MACD 히스토그램 값을 0~100 범위로 정규화합니다.
정규화된 구조는 다섯 개의 주요 기준선을 사용합니다.
• 90: 극단적 상단 모멘텀 압력
• 85: 상단 압력 구간
• 50: 중립 압력 기준선
• 15: 하단 압력 구간
• 10: 극단적 하단 모멘텀 압력
빨간선은 정규화된 MACD 히스토그램을 평활화한 값입니다. 개별 히스토그램 막대보다 넓은 모멘텀 압력 곡선을 읽는 데 도움을 줍니다.
────────────────────
이 스크립트가 보여주는 것
────────────────────
이 스크립트는 다음 요소를 표시할 수 있습니다.
• 정규화된 MACD 히스토그램 막대
• 평활화된 MACD 압력선
• 90 및 85 상단 압력 기준선
• 50 중립 압력 기준선
• 15 및 10 하단 압력 기준선
• 상단 및 하단 구간 배경 강조
• 히스토그램 확장 또는 수축 상태
• 현재 압력 구간
• 모멘텀 heating 또는 cooling 상태
• positive 또는 negative 압력 방향
• 상단 또는 하단 압력 구간 체류 봉 수
• 선택 가능한 상태 패널
이 요소들은 MACD 히스토그램 압력이 확장, 회복, 둔화, 확장 지속, 또는 중립 회귀 중 어디에 가까운지 확인하는 데 도움을 줍니다.
────────────────────
작동 방식
────────────────────
1. 선택한 fast EMA와 slow EMA 길이를 사용해 MACD 라인을 계산합니다.
2. MACD 라인에서 시그널 라인을 계산합니다.
3. MACD에서 시그널을 뺀 값으로 MACD 히스토그램을 계산합니다.
4. 선택한 lookback 구간에서 히스토그램을 정규화합니다.
5. 정규화된 값을 0~100 오실레이터 범위로 변환합니다.
6. 정규화 오실레이터에서 평활화된 빨간 압력선을 계산합니다.
7. 압력선을 90, 85, 50, 15, 10 기준선과 비교합니다.
8. 압력선이 상단 또는 하단 압력 구간에 진입하면 배경이 강조됩니다.
9. 히스토그램 막대는 확장 또는 수축 여부에 따라 다르게 표시됩니다.
10. 상태 패널은 현재 압력, 구간, 모멘텀 상태, 방향성, 구간 체류 시간, 히스토그램 상태를 요약합니다.
이 구조는 MACD 히스토그램 행동을 더 깔끔한 구간 기반 모멘텀 압력 맵으로 변환합니다.
────────────────────
입력값 및 설정
────────────────────
사용자는 다음 항목을 조정할 수 있습니다.
• MACD fast length
• MACD slow length
• MACD signal length
• source price
• normalization lookback
• red line smoothing length
• 0 to 100 clamping
• extreme upper pressure level
• upper pressure level
• neutral pressure level
• lower pressure level
• extreme lower pressure level
• zone background visibility
• histogram visibility
• red line visibility
• status panel visibility
• panel position
• panel text size
• histogram colors
• red line color
• reference level color
• panel background color
기본 기준선은 90 / 85 / 50 / 15 / 10 압력 구간 구조를 중심으로 설계되어 있습니다.
────────────────────
시각 요소
────────────────────
이 스크립트는 다음 시각 요소를 포함합니다.
• 정규화 히스토그램 막대
• 평활화된 빨간 압력선
• 수평 기준선
• 상단 압력 배경
• 하단 압력 배경
• 상태 패널
히스토그램 막대는 정규화된 MACD 히스토그램 값을 보여줍니다.
빨간선은 정규화된 히스토그램을 평활화하여 압력 사이클을 더 쉽게 읽게 해줍니다.
50선은 중립 압력 기준선 역할을 합니다.
85와 90은 상단 모멘텀 압력 구간을 표시합니다.
15와 10은 하단 모멘텀 압력 구간을 표시합니다.
패널은 차트에 방향성 매매 라벨을 추가하지 않고도 현재 상태를 요약합니다.
────────────────────
참고 상태
────────────────────
Extreme Upper Pressure:
평활화된 압력선이 상단 극단 기준선 이상에 있는 상태입니다.
Upper Pressure:
평활화된 압력선이 상단 압력 구간에 있는 상태입니다.
Positive Pressure:
압력선이 중립 기준선 위에 있지만 상단 압력 구간 아래에 있는 상태입니다.
Neutral Pressure:
압력선이 중립 기준선 부근에 있는 상태입니다.
Negative Pressure:
압력선이 중립 기준선 아래에 있지만 하단 압력 구간 위에 있는 상태입니다.
Lower Pressure:
평활화된 압력선이 하단 압력 구간에 있는 상태입니다.
Extreme Lower Pressure:
평활화된 압력선이 하단 극단 기준선 이하에 있는 상태입니다.
Heating:
평활화된 압력선이 상승 중인 상태입니다.
Cooling:
평활화된 압력선이 하락 중인 상태입니다.
Expanding:
정규화된 히스토그램이 직전 봉보다 증가하는 상태입니다.
Contracting:
정규화된 히스토그램이 직전 봉보다 감소하는 상태입니다.
이 상태들은 정보 제공용이며, 매매 지시로 해석해서는 안 됩니다.
────────────────────
사용 방법
────────────────────
이 스크립트는 MACD 히스토그램 압력 및 모멘텀 구간 확인 도구로 사용하는 것이 적절합니다.
일반적인 해석 예시는 다음과 같습니다.
• 빨간선이 85 위에 있으면 MACD 히스토그램 압력이 상단 확장 구간에 있는 상태로 볼 수 있습니다.
• 빨간선이 90 위에 있으면 더 극단적인 상단 압력 상태로 볼 수 있습니다.
• 빨간선이 상단 압력 구간에서 하락하면 모멘텀 압력이 cooling 되는 과정일 수 있습니다.
• 빨간선이 50 부근에 있으면 MACD 히스토그램 압력이 중립에 가까운 상태입니다.
• 빨간선이 15 아래에 있으면 MACD 히스토그램 압력이 하단 확장 구간에 있는 상태로 볼 수 있습니다.
• 빨간선이 10 아래에 있으면 더 극단적인 하단 압력 상태로 볼 수 있습니다.
• 빨간선이 하단 압력 구간에서 상승하면 모멘텀 압력이 heating 되는 과정일 수 있습니다.
• Zone Bars는 압력선이 상단 또는 하단 압력 구간에 얼마나 오래 머물렀는지 확인하는 데 사용할 수 있습니다.
• Histogram expansion은 압력 강화, contraction은 압력 둔화를 보여줄 수 있습니다.
이 스크립트는 가격 행동, 추세 구조, 변동성, 지지와 저항, 상위 시간대 컨텍스트와 함께 검토하는 것이 좋습니다.
────────────────────
확인봉 및 리페인트 안내
────────────────────
이 스크립트는 사용 가능한 차트 데이터를 기준으로 MACD, 히스토그램, 정규화 범위, 평활화된 압력선을 계산합니다.
실시간 캔들에서는 MACD 히스토그램과 정규화 값이 봉 마감 전까지 변경될 수 있으므로 값이 변할 수 있습니다.
보다 보수적인 분석을 원한다면 봉 마감 이후 오실레이터를 검토하는 것이 적절합니다.
이 스크립트는 미래 가격 데이터를 사용해 시장 방향을 예측하지 않습니다.
────────────────────
한계
────────────────────
이 스크립트는 미래 가격 움직임을 예측하지 않습니다.
진입 또는 청산 추천을 제공하지 않습니다.
높은 압력 수치가 반전을 보장하지 않습니다.
낮은 압력 수치가 반등을 보장하지 않습니다.
강한 추세에서는 MACD 히스토그램 압력이 오랜 시간 확장 구간에 머무를 수 있습니다.
정규화 값은 선택한 lookback period에 따라 달라질 수 있습니다.
종목과 시간대에 따라 적절한 설정값이 달라질 수 있습니다.
이 스크립트를 단독 매매 시스템으로 사용해서는 안 됩니다.
────────────────────
중요 고지
────────────────────
본 게시물은 교육 및 정보 제공 목적의 차트 분석 자료입니다.
투자 자문, 특정 금융상품 거래 권유, 또는 수익 보장을 의미하지 않습니다.
모든 투자 판단과 그 결과에 대한 책임은 이용자 본인에게 있습니다.
指标

RSI-T (RSI + Time)
RSI-T
RSI with Time Parameter
Technical White Paper & User Guide
Dimitrios Kataliakos
May 2026
Based on the theory: "Market as Expanding Dough"
(Agora os Diogkoumeno Zymari)
Table of Contents
Table of Contents 1
1. Executive Summary 1
2. Theoretical Foundation 1
2.1 The Market as Expanding Dough 1
2.2 Time as a Curvature Factor 1
2.3 Regime Classification 1
3. Mathematical Definition 1
3.1 Core Formula 1
3.2 Parameters 1
3.3 Derived Metrics 1
4. Timeframe Analysis 1
4.1 Timeframe Weight 1
4.2 Recommended Settings by Timeframe 1
4.3 Multi-Timeframe Confluence 1
5. User Guide 1
5.1 Installation (TradingView) 1
5.2 Reading the Indicator 1
5.3 Trading Rules 1
Rule 1: Regime Identification First 1
Rule 2: Do Not Short Persistent Bull 1
Rule 3: Do Not Buy Persistent Bear 1
Rule 4: Momentum Zone is Decision Zone 1
Rule 5: Watch the Divergence 1
5.4 Practical Examples 1
6. Backtest Strategy 1
6.1 Strategy Logic 1
6.2 Risk Management 1
6.3 Pine Script Strategy 1
6.4 Metrics to Evaluate 1
7. Limitations & Future Work 1
7.1 Known Limitations 1
7.2 Future Development 1
8. Appendix 1
8.1 Files Included 1
8.2 Version History 1
1. Executive Summary
The RSI-T (RSI with Time) is a technical indicator that extends the classic Wilder RSI by adding a third parameter: the duration of time price action remains in an extreme zone. While the standard RSI measures the magnitude of recent price changes, it fails to capture the persistence of momentum regimes. The RSI-T solves this by quantifying how long the RSI stays above or below threshold levels, providing traders with a tool that distinguishes between transient spikes and sustained directional moves.
The indicator is derived from the economic theory of markets as expanding systems, where price does not tend toward equilibrium but rather expands unevenly, creating zones of compression and expansion. The RSI-T operationalizes this concept by treating the time spent in extreme RSI territory as a measure of regime strength.
2. Theoretical Foundation
2.1 The Market as Expanding Dough
Traditional economic theory assumes markets tend toward equilibrium. The theory underlying RSI-T proposes an alternative model: the market behaves like expanding dough, where nominal prices continuously inflate, but the expansion is uneven across time and sectors. This creates regions of rapid expansion (bubbles, momentum regimes) and compression (consolidations, mean-reversion zones).
The three analytical layers of this model are:
• Geometry (Curvature): How price curves in space, measured through momentum and convexity. This corresponds to the RSI dimension of the indicator.
• Temperature (Volatility): The thermal energy of the market, measured through implied and realized volatility. This informs the threshold sensitivity.
• Cohesion (Liquidity): The structural integrity of price action, related to order flow and market microstructure. This provides context for regime classification.
2.2 Time as a Curvature Factor
The critical insight of RSI-T is that time spent at extremes is itself information. When the RSI remains above 70 for one bar, it may be a transient spike. When it remains above 70 for eight consecutive bars, the market has entered a different regime entirely. Standard RSI treats both situations identically. RSI-T does not.
In the dough metaphor, this corresponds to a region that is not just expanded, but has been expanding for a sustained period. The longer the expansion persists, the more the local structure of the market has reorganized around the new price level, and the less likely a simple mean-reversion is to occur.
This is consistent with empirical findings in momentum literature: assets that have been trending tend to continue trending, and the duration of the trend is a stronger predictor of continuation than the magnitude alone.
2.3 Regime Classification
The RSI-T framework classifies market states into distinct regimes based on the combination of RSI level and time at extreme:
Regime RSI Condition Time Condition
NEUTRAL Between oversold and overbought Counter = 0
MOMENTUM_BULL RSI > Overbought threshold 2 to N-1 bars
MOMENTUM_BEAR RSI < Oversold threshold 2 to N-1 bars
PERSISTENT_BULL RSI > Overbought threshold N or more bars
PERSISTENT_BEAR RSI < Oversold threshold N or more bars
Where N is the persistence threshold (default: 5 bars). In the persistent regimes, traditional mean-reversion signals (e.g., sell when RSI > 70) are weakened or inverted.
3. Mathematical Definition
3.1 Core Formula
The RSI-T value is calculated as:
RSI_T = clamp( RSI + (bars_at_extreme × time_weight × direction), 0, 100 )
Where:
• RSI = Standard Wilder RSI(close, period)
• bars_at_extreme = consecutive bars where RSI > threshold_OB or RSI < threshold_OS
• time_weight (α) = scaling factor per bar of persistence (default: 1.2)
• direction = +1 if RSI > threshold_OB, -1 if RSI < threshold_OS, 0 otherwise
• clamp() = constrains result to
3.2 Parameters
Parameter Default Range Description
period 14 5 – 50 RSI lookback period (Wilder smoothing)
threshold 70 / 30 55–90 / 10–45 Overbought / Oversold boundary
time_weight (α) 1.2 0.0 – 5.0 Signal boost per bar at extreme
max_boost 20 5 – 40 Maximum cumulative boost (cap)
persist_bars (N) 5 2 – 20 Bars required for persistent regime
3.3 Derived Metrics
• Divergence = RSI_T − RSI: Measures the total impact of the time parameter. When divergence is zero, RSI-T equals classic RSI. When divergence is large, the time dimension is providing significant additional information.
• Time Counter (bars_extreme): The raw number of consecutive bars spent above/below the threshold. This is the primary regime classifier.
• Regime Label: Categorical classification (NEUTRAL, MOMENTUM_BULL, MOMENTUM_BEAR, PERSISTENT_BULL, PERSISTENT_BEAR) derived from the combination of RSI level and time counter.
4. Timeframe Analysis
The RSI-T works across all timeframes, but its interpretation changes because the time counter has different weight depending on bar duration.
4.1 Timeframe Weight
Timeframe 1 Bar = 5 Bars (Persistent) = Interpretation
1 minute 1 minute 5 minutes Micro-momentum, scalping noise common
5 minutes 5 minutes 25 minutes Intraday momentum phases
15 minutes 15 minutes 1.25 hours Session-level regime shifts
1 hour 1 hour 5 hours Intraday trend confirmation
4 hours 4 hours 20 hours Multi-session directional bias
Daily 1 day 1 week Swing-level regime classification
Weekly 1 week 5 weeks (~1 month) Position-level trend strength
Monthly 1 month 5 months Macro regime identification
4.2 Recommended Settings by Timeframe
Timeframe Period Time Weight Persist Bars
1–5 min 14 0.5 – 0.8 8 – 12
15–60 min 14 0.8 – 1.2 5 – 8
4H / Daily 14 1.0 – 1.5 4 – 6
Weekly 14 1.5 – 2.0 3 – 5
Monthly 14 2.0 – 3.0 3 – 4
The general principle: shorter timeframes need more bars to confirm persistence (more noise to filter), while longer timeframes establish regimes faster because each bar carries more weight.
4.3 Multi-Timeframe Confluence
The highest-conviction signals occur when multiple timeframes agree. For example, if the daily RSI-T shows PERSISTENT_BULL and the weekly RSI-T enters MOMENTUM_BULL, this represents a multi-timeframe momentum alignment that significantly increases the probability of trend continuation.
Conversely, if the daily is in PERSISTENT_BULL but the weekly RSI-T is declining from a recent extreme, this divergence between timeframes suggests the persistent regime may be nearing exhaustion.
5. User Guide
5.1 Installation (TradingView)
1. Open TradingView and navigate to the chart of your chosen instrument.
2. Click Pine Editor at the bottom of the screen.
3. Click New and select New indicator.
4. Delete all existing code and paste the RSI-T Pine Script (v6) code.
5. Click Add to chart. The RSI-T panel appears below the price chart.
6. Adjust parameters via the Settings gear icon on the indicator.
5.2 Reading the Indicator
Blue line: Classic RSI. This is the baseline reference.
Orange/Red line: RSI-T. When this diverges from the blue line, the time parameter is active and providing additional information.
Histogram (bottom): Scaled time counter showing the number of bars spent at the extreme zone.
Green background: Persistent bull regime. The RSI has been above the overbought threshold for N or more bars.
Red/orange background: Persistent bear regime (red) or momentum bear/bull (orange/blue).
Blue background: Momentum bull. RSI above overbought for 2 to N-1 bars. Early-stage momentum zone.
5.3 Trading Rules
Rule 1: Regime Identification First
Before making any trading decision, identify the current regime from the background color. In NEUTRAL regime, traditional RSI-based mean-reversion strategies apply normally. In MOMENTUM or PERSISTENT regimes, mean-reversion signals are weakened or inverted.
Rule 2: Do Not Short Persistent Bull
When the RSI-T shows persistent bull (green background), do not initiate short positions based on overbought readings. The persistence signal indicates that the market has reorganized around the uptrend and further upside is more likely than immediate reversal. Wait for the regime to reset (counter returns to zero) before considering mean-reversion trades.
Rule 3: Do Not Buy Persistent Bear
The inverse of Rule 2. When persistent bear is active (red background), do not buy dips based on oversold readings. The selling pressure has established itself as a regime, not a transient condition.
Rule 4: Momentum Zone is Decision Zone
The blue/orange background (momentum zone, 2 to N-1 bars) is where decisions are made. This is the transitional phase where the market is testing whether it will establish a persistent regime or revert. Tighter stops and smaller positions are appropriate here.
Rule 5: Watch the Divergence
When RSI-T diverges significantly from classic RSI (large divergence value), the time dimension is dominating. A sudden collapse of this divergence (counter drops to zero) often precedes sharp reversals, as the accumulated time pressure releases.
5.4 Practical Examples
Scenario RSI-T Reading Action
RSI at 75, counter = 1 Momentum bull (blue bg) Standard caution, normal position sizing
RSI at 75, counter = 7 Persistent bull (green bg) Do NOT short. Trailing stop on existing longs
RSI at 42, counter = 0 Neutral Normal analysis applies. No regime signal
RSI at 25, counter = 6 Persistent bear (red bg) Do NOT buy dips. Wait for regime exit
RSI at 72, counter drops from 5 to 0 Regime exit Alert: potential reversal. Tighten stops
6. Backtest Strategy
6.1 Strategy Logic
The RSI-T Strategy for backtesting converts the indicator into actionable entries and exits. The core logic uses regime transitions as signals:
Long Entry:
• RSI-T crosses above the overbought threshold AND the time counter reaches the momentum threshold (2 bars), confirming directional commitment.
• Alternative: Enter when the regime transitions from NEUTRAL to MOMENTUM_BULL (catching the early phase of a potential persistent move).
Long Exit:
• The time counter resets to zero after being in persistent bull (regime exit signal).
• Alternative: RSI-T crosses below the midline (50) from above.
Short Entry:
• RSI-T crosses below the oversold threshold AND the time counter reaches the momentum threshold.
Short Exit:
• Time counter resets to zero after persistent bear, or RSI-T crosses above midline.
6.2 Risk Management
• Position size: 10% of equity per trade (adjustable in strategy settings).
• Stop loss: Based on ATR multiplier (default 2x ATR-14) to account for regime volatility.
• Trailing stop: Activates once position reaches 1.5x risk in profit.
• No pyramiding by default (can be enabled for persistent regime continuation).
6.3 Pine Script Strategy
A complete Pine Script v6 strategy file (rsi_t_strategy_v6.pine) is provided alongside this document. The strategy includes configurable parameters for entry/exit rules, position sizing, stop-loss, and trailing stop. It can be applied to any instrument and timeframe in TradingView for historical backtesting.
6.4 Metrics to Evaluate
When backtesting the RSI-T strategy, focus on the following metrics to validate the theoretical framework:
• Win Rate in Persistent vs. Momentum vs. Neutral regimes (the theory predicts higher win rates in persistent regimes for trend-following entries).
• Average trade duration across regimes (persistent regime trades should be longer and more profitable).
• False signal rate: How often does momentum (blue background) fail to convert to persistent (green background)?
• Regime exit accuracy: What percentage of regime exits (counter reset) are followed by actual reversals within N bars?
• Comparison vs. classic RSI strategy (same entry rules without the time parameter) to isolate the value added by the time dimension.
7. Limitations & Future Work
7.1 Known Limitations
• The RSI-T is a lagging indicator by nature. The time counter requires bars to accumulate before signaling persistence, meaning the earliest phase of a move is not captured.
• In choppy or range-bound markets, the counter may produce false starts, briefly entering momentum zone before resetting. The persist_bars threshold helps filter these but cannot eliminate them entirely.
• The linear time_weight model (each bar adds the same boost) may not be optimal. Markets may exhibit non-linear acceleration, where the 10th bar at extreme is more significant than the 3rd.
• The indicator does not incorporate volume, volatility, or cross-asset information. It is purely price-derived.
7.2 Future Development
• Non-linear time weighting: Exponential or logarithmic boost curves that better reflect the accelerating nature of regime establishment.
• Volatility-adjusted thresholds: Dynamic overbought/oversold levels that adjust based on current implied volatility (high-vol environments may require wider thresholds).
• Fast/Slow RSI divergence: Comparing RSI-T across different periods (e.g., RSI-T(7) vs RSI-T(21)) to measure regime acceleration, as described in the original theory.
• Cross-asset regime correlation: Using the RSI-T regime of correlated assets (e.g., SPX for individual stocks) as a confirmation layer.
• Machine learning optimization: Using historical data to optimize time_weight and persist_bars parameters per asset class and market regime.
8. Appendix
8.1 Files Included
File Description
rsi_t_v6.pine RSI-T indicator for TradingView (Pine Script v6)
rsi_t_strategy_v6.pine RSI-T backtest strategy for TradingView (Pine Script v6)
rsi_t_indicator.py RSI-T Python implementation for custom backtesting
8.2 Version History
Version Date Changes
1.0 May 2026 Initial release: RSI-T indicator, strategy, white paper
Copyright © 2026 Dimitrios Kataliakos. All rights reserved.
This document and the associated indicator code are proprietary work based on the original theory of markets as expanding systems.
指标

CDC Action Zone+TrueMarket Mean (BTC Focus) By Beckte## Overview
This indicator is a macro-focused trend following and cyclical value tracking tool, specifically designed for Bitcoin (BTC) long-term investors. It combines the momentum logic of the well-known **CDC Action Zone** with a mathematical simulation of the On-Chain **Realized Price** model.
The main purpose of this script is to identify high-probability, macro-generational accumulation zones while filtering out early or false bottom signals during aggressive downtrends.
---
## Key Components
### 1. CDC Action Zone (Trend & Momentum)
Based on the classic EMA 12 and EMA 26 crossover logic, this component colors the candlesticks to reflect the market's current momentum:
- 🟢 **Bright Green:** Strong Bullish Momentum (Hold / Trend is up)
- 🔵 **Blue:** Early Bullish Sign / Potential Reversal (Watch closely or start accumulation)
- 🔴 **Bright Red:** Strong Bearish Momentum (Stay in cash / Wait)
- 🟠 **Orange:** Early Bearish Sign / Technical Rebound in Bear Market
### 2. Realized Price Proxy (The Cyclical Floor)
In on-chain analysis, the **Realized Price** represents the average cost basis of all aggregate Bitcoin supply moving on-network, without omitting lost or dormant coins.
Since native on-chain data requires external API subscriptions on TradingView, this script utilizes a specialized long-term statistical proxy (**730-day SMA with custom logarithmic offsets**) to simulate this ultimate cyclical floor. Historically, major bear market bottoms (2015, 2018, 2022) have strictly formed near or slightly below this baseline.
---
## How it Works & Entry Strategy (The Anti-Doi Mechanism)
To avoid catching falling knives during a capitulation event, this script enforces a strict double-confirmation rule:
1. **Value Zone Check:** The current market price must correct down to within **10% of the Realized Price Proxy** (the light blue line). This ensures you are buying Bitcoin at an extreme discount relative to historical network value.
2. **Momentum Trigger:** Once inside the Value Zone, the script waits for the **CDC Action Zone to flip from Red/Orange to Blue or Green**.
When both conditions are met, a **"REALIZED BUY"** label will plot beneath the candlestick, signaling a safe, low-risk entry spot with a highly compressed downside.
---
## Disclaimer & Credits
- **Credits:** The trend-following logic is inspired by the legendary "CDC Action Zone" concept popularized by Piriya Sambandaraksa. The valuation floor is based on the Realized Price on-chain metric conceptualized by the crypto-asset research community.
- **Disclaimer:** This indicator is designed for high-timeframe spot accumulation (recommended: 1D or 4H charts). It is not a financial advisory tool or a guarantee of future profits. Past performance does not indicate future results. Always practice proper risk management. 指标

指标

指标

Moving averages. JB styleMoving averages. JB style
A clean, configurable multi-MA overlay. Up to four moving averages, each colored by its own slope, with debounced crossover markers, weight-scaled line widths, an EMA/SMA switch, a regular-hours session lock, and five color palettes — all tuned so the indicator reads as a separate layer over your candles instead of blending into them.
WHAT IT DOES
- Up to 4 moving averages. Defaults are 9 / 21 / 50 / 200, and every slot has its own editable length and show/hide toggle, so you can run one MA or all four. Source is fixed to close to keep the panel simple.
- EMA or SMA from one dropdown. The MA Type dropdown flips all lines between simple and exponential, reusing the same lengths and styling.
- Slope-based coloring. Each line is colored by its own slope: a blue tone when rising, an orange/amber tone when falling, and neutral gray when essentially flat. Colors sit deliberately off the green/red axis so the lines never blend into the candles.
- Weight-scaled widths. Faster MAs are thin, slower MAs are thick, so the long-term anchors stand out at a glance. The slowest MA is drawn as a dotted circle line to mark it as the long-term reference.
- Crossover markers. A hollow ring with a centered dot marks crossovers between adjacent MAs (1x2, 2x3, 3x4) — including the classic 50/200 — a bright bull tone for a bullish cross and an amber tone for a bearish one, placed right at the crossing price.
- Five palettes. Dark, Light, Neon, Ocean, and Solarized. Candles are never recolored on any theme.
WHY IT'S DIFFERENT
Most moving-average indicators just draw lines and color them by whether price is above or below — which whipsaws constantly. This one is built around signal reliability:
1. Slope coloring instead of price-vs-MA coloring. Color reflects whether the average itself is rising or falling — a steadier read of trend than the noisy "is price above the line" flip.
2. A slope deadband kills color flicker. Near-flat averages normally strobe between colors on every tick. Here the slope must clear an ATR-scaled threshold before the color flips; otherwise the line goes neutral. A flat ribbon looks flat — which is itself useful information.
3. Crossovers are MA vs MA, not price vs MA. A faster average crossing a slower one needs agreement between two degrees of smoothing, so it fires far less on noise than a single line being touched by price.
4. A debounce filter removes chop without lagging the signal. The marker fires on the actual crossover, then suppresses further crosses until the two averages genuinely separate (by an ATR-scaled amount) and reconverge. A cluster of back-and-forth chop crosses produces one marker on the real cross — not a smear of noise, and not delayed to a later cross.
5. Confirmed-bar markers don't repaint. A crossover marker appears only after the bar closes, so it never flashes mid-bar and then vanishes.
6. Regular-hours session lock. Every MA (and the ATR behind the filters) is computed from a regular-session feed, so a 200-MA reads the same whether your chart shows extended hours or not. The lines simply hold flat through pre/post-market instead of drifting. On 24/7 instruments this is a harmless no-op.
7. Always the chart's own timeframe. The session lock swaps only the session, never the timeframe — the MAs are always calculated on the timeframe you're viewing.
8. Lines that don't fight the candles. Bull/bear line colors are deliberately blue/orange rather than green/red, so the indicator reads as a clean layer over the candles instead of camouflaging into them.
INPUTS
- Palette: color theme for lines and markers (Dark / Light / Neon / Ocean / Solarized).
- MA Type: SMA or EMA, applied to all lines.
- Regular Hours Only: compute all MAs and ATR from a regular-session feed, regardless of the chart's session.
- Show Crossovers: toggle all crossover markers.
- Slope Deadband (x ATR): minimum slope before the color flips; 0 disables (default 0.02).
- Crossover Min Sep (x ATR): debounce gap — after a marked cross, the next one is suppressed until the MAs separate by this amount and reconverge; 0 disables (default 0.10).
- MA #1-4 Show / Length: per-slot visibility and period (defaults 9 / 21 / 50 / 200).
指标

指标

Edo SuperTrend CoreEdo SuperTrend Core — Clean Single-Line SuperTrend with RSI Trend Confirmation, Directional Intensity Fill and Trend Duration Counter
SuperTrend, created by Olivier Seban, is one of the most widespread trend-following indicators: it uses the Average True Range (ATR), introduced by J. Welles Wilder, to build a dynamic trailing stop that switches sides when price crosses it. It is clear and effective, but it has a known limitation: in sideways or noisy markets it produces false flips —trend changes that reverse within a few bars— and, drawn the classic way with its two bands, it clutters the chart.
Edo SuperTrend Core was built to solve those two things. It keeps the original SuperTrend algorithm, but adds a momentum confirmation filter that requires the RSI to agree before accepting a trend change, and simplifies the representation to a single line with an intensity fill and a duration counter. The goal is a clean trend reading with fewer false turns, without giving up the classic logic.
Edo SuperTrend Core does not generate automatic buy or sell signals: it visualizes the state and the maturity of the trend so the trader can integrate it into their own judgment.
WHAT THE INDICATOR DOES
The indicator combines four elements on a single layer. The SuperTrend line is a single dynamic level that acts at once as a trend reference and as the flip level, the closing price that, if crossed, would change the trend. The RSI confirmation filter requires momentum to agree in order to validate a trend change. The directional intensity fill, between price and the line, highlights the phase of the move. And the duration counter shows how many bars the current trend has been active.
CONCEPTUAL CALCULATION BASIS
The base is the classic SuperTrend: the ATR measures volatility and, from a multiple of that ATR, a dynamic level is computed that sits below price in an uptrend and above price in a downtrend. In the classic implementation two bands are plotted; here only the active level is shown, which keeps the chart cleaner.
On top of that base, Edo SuperTrend Core adds its own layer: when the SuperTrend signals a trend change, that change is only accepted if the 14-period RSI confirms it, above 50 to validate a bullish turn and below 50 to validate a bearish one. If momentum does not agree, the indicator keeps the previous trend. This filter is the central difference versus a standard SuperTrend: it discards part of the flips that noise generates in sideways markets. The basic reading is direct: with the SuperTrend below price the trend is bullish, and with the SuperTrend above price, bearish.
SENSITIVITY PROFILES
A single selector adjusts the behavior of the SuperTrend by modifying the internal ATR parameters. The Fast profile uses ATR 7 and factor 2.0: higher sensitivity, reacts sooner and produces more changes, useful on lower timeframes. The Balanced profile uses ATR 10 and factor 2.3: it is the default setting, balancing reactivity and stability. The Slow profile uses ATR 14 and factor 3.0: smoother and more stable detection, with fewer turns, useful on higher timeframes.
INTENSITY FILL
Between price and the SuperTrend line a fill is drawn whose color follows the direction of the trend and whose opacity is configurable. Its purpose is to make the phase and the magnitude of the separation between price and level visible at a glance: the greater the distance, the more extended the move is relative to its trailing stop. The RSI, besides filtering the trend changes, provides the momentum context that accompanies that phase, whether expansion, consolidation or exhaustion.
TREND DURATION COUNTER
Each time the trend changes, the indicator writes at the midpoint of the previous leg the number of bars that trend lasted. It is a purely informative figure that helps judge the maturity of the move: a trend that has already accumulated many more bars than the previous ones may be more extended, whereas a freshly started one is barely beginning to develop.
ALERTS
Edo SuperTrend Core includes four alert conditions configurable from the standard TradingView alerts dialog, split into two levels according to the momentum filter. The confirmed bullish trend change fires when the flip to bullish has passed the RSI filter, with momentum agreeing; it is the indicator's definitive trend signal. The confirmed bearish trend change is its downside equivalent. The raw flip up warns that price has crossed the SuperTrend line upward, still pending RSI confirmation, and serves as an early warning of a possible turn not yet validated; the raw flip down is its bearish equivalent. The confirmed and raw pair lets the trader choose their level of anticipation: the raw flip warns sooner but may reverse, while the confirmed one arrives a step later but has already filtered out part of the false turns.
HOW TO READ IT
The position of the line relative to price defines the trend and its side, and the color confirms the state at a glance. When a trend change occurs it is worth remembering that it has already passed the RSI filter, that is, that momentum was agreeing: turns confirmed by momentum tend to be more reliable than a pure SuperTrend flip. The fill and the separation between price and line indicate whether the move is expanding or losing strength. The duration counter places the current trend against the previous ones, and a trend well above the usual duration invites watching the flip level more closely. That flip level, the level of the line, is the closing price that would change the trend and serves as a dynamic stop reference.
ORIGINALITY AND JUSTIFICATION
Olivier Seban's SuperTrend and Wilder's RSI and ATR are public-domain classics, and Edo SuperTrend Core names and credits them without reservation. What it adds over a standard SuperTrend is specific: an RSI confirmation filter that discards part of the false flips of the classic SuperTrend in sideways markets, a single-line representation instead of the two bands, an intensity fill that makes the phase of the move legible, and a duration counter that adds a maturity reading. The combination of momentum filter, phase reading and duration is what distinguishes this version, not the base algorithm.
CONFIGURATION
Profile: Fast, Balanced or Slow, which adjusts the ATR and the factor. Gradient Opacity: the visual intensity of the fill, from 10 to 100%. All calculations adapt automatically to the chart's timeframe.
OPEN SOURCE
Edo SuperTrend Core is published as an open source and free indicator. The full Pine Script is publicly available on TradingView for study, adaptation and integration into any workflow.
This indicator is a technical analysis tool intended exclusively for educational and informational purposes. It does not generate automatic buy or sell signals and should not be considered financial advice. Trading in financial markets carries a significant risk of capital loss. Past results do not guarantee future results. Always use proper risk management.
指标

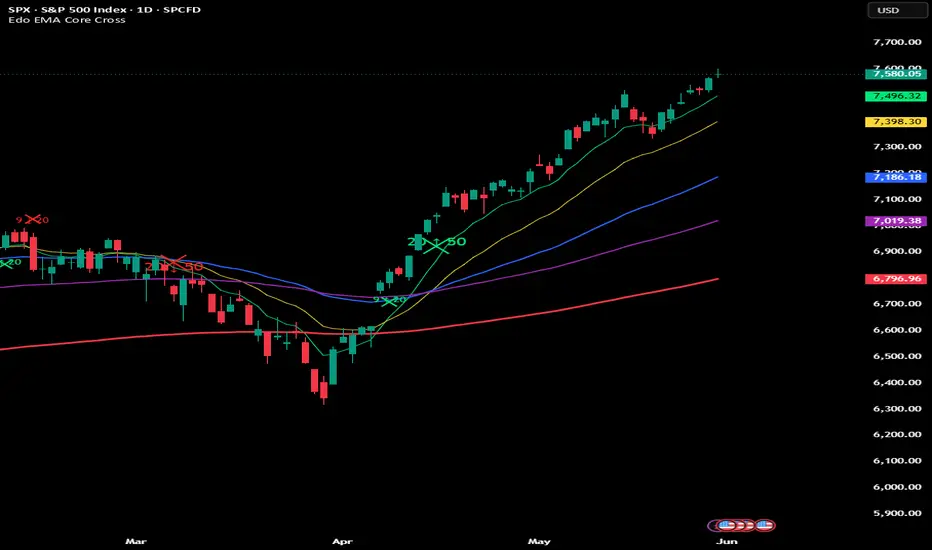
Edo EMA Core CrossEdo EMA Core Cross — Five-EMA Structure with a Three-Tier Cross Hierarchy and Weight-Scaled Markers (Momentum, Structure and Golden/Death Cross)
The exponential moving average (EMA) is one of the most basic elements of technical analysis: a dynamic equilibrium level that weights recent price more heavily. When a fast EMA crosses a slow one, that cross marks a change in the rhythm of the market, and it is one of the oldest and most reliable readings there is. The problem is not the EMA itself, but the handling: plotting five EMAs on the chart, watching by hand which pair has just crossed and remembering how much structural weight each cross carries is noisy, slow and error-prone, especially when what matters is not that there is a cross, but what kind of cross it is.
Edo EMA Core Cross was built to solve that. It does not reinvent the EMA: it organizes five key EMAs into a three-tier cross hierarchy and marks each cross with a visual weight proportional to its structural importance, so the trader tells apart at a glance short-term noise, operating rotation and a larger structural change.
This indicator does not predict price nor generate automatic signals: it visualizes transitions that are already happening so the trader can align with them.
WHAT THE INDICATOR DOES
The indicator plots five EMAs and monitors three cross pairs, assigning each pair a distinct hierarchical level. The five EMAs —9, 20, 50, 100 and 200— represent five speeds of the market, from immediate momentum, read by the 9, to the dominant structural bias, read by the 200. Conceptually, each EMA acts as a dynamic equilibrium level: when a faster EMA crosses above a slower one it signals growing bullish pressure, and when it crosses below, growing bearish pressure. What Edo EMA Core Cross adds is classifying those crosses into three hierarchies according to which averages are involved, because not all crosses carry the same weight.
THE FIVE EMAs
The five averages form a hierarchy of speeds. The EMA 9 reads immediate momentum; the EMA 20, the short term; the EMA 50, intermediate structure; the EMA 100, background structure; and the EMA 200, the dominant structural bias. Plotted together, they let you read the market as a hierarchical system where short-term moves develop inside larger structural layers. The thickness of each line grows with its weight —the 200 is the thickest— to reinforce the hierarchy visually.
THE HIERARCHICAL CROSS SYSTEM
It is the core of the indicator. Each cross pair is marked with a visual weight proportional to its structural relevance. The cross of the EMA 9 with the EMA 20 corresponds to momentum: fast changes and internal transitions within the prevailing structure, flagged with a small marker. The cross of the EMA 20 with the EMA 50 corresponds to structure: deeper operating rotations and possible mid-structure transitions, with a medium marker. The cross of the EMA 50 with the EMA 200 is the Golden Cross or Death Cross, the heaviest event, the classic structural cross that marks a long-term bias change, with a large marker set apart by its macro importance. This gradation is what turns a pile of EMAs into a structured reading: the size of the marker tells you, without measuring anything, whether what just happened is short-term noise, an operating rotation or a larger structural turn.
MARKERS AND LABELS
Each cross is flagged with an X-marker —below the candle if bullish, above if bearish— and with a readable label that identifies the pair and the direction, for example "9 ↑ 20" for a bullish cross of the 9 over the 20 or "50 ↓ 200" for a Death Cross. Each cross hierarchy can be toggled independently, so the trader can keep only the levels of interest, for example hiding the 9/20 noise and watching only the Golden and Death Cross.
ALERTS
Edo EMA Core Cross includes six alert conditions configurable from the standard TradingView alerts dialog, one bullish and one bearish for each of the three cross hierarchies. In the momentum hierarchy, the bullish alert fires when the 9 crosses above the 20 and the bearish one when it crosses below. In the structure hierarchy, when the 20 crosses above or below the 50. And in the major hierarchy, the Golden Cross when the 50 crosses above the 200 and the Death Cross when it crosses below. The alerts are independent of the visual toggles: they fire even if the corresponding hierarchy is hidden on the chart, so the trader can keep the chart clean and still receive the warning for the level of interest.
HOW TO READ IT
It is worth reading the hierarchy first: before reacting to a cross, look at its size, because a small 9/20 marker is momentum and a large 50/200 marker is structure, and the kind of cross matters more than the cross itself. Then align the speeds by checking the order of the EMAs: when they are stacked from fast to slow in bullish order, the 9 over the 20 over the 50 over the 200, the structure is clean, and when they interleave, the market is in transition. The Golden or Death Cross is contextualized: a 50/200 cross confirms a long-term bias change, but it is not an entry trigger, and it gains value when it coincides with structure and with relevant levels on the chart. Overall, the crosses are used as confirmation and not as anticipation: the indicator visualizes transitions that are already happening, and it serves to align with the structural change, not to front-run it blindly.
ORIGINALITY AND MASHUP JUSTIFICATION
EMAs are a public-domain component and this indicator does not pretend otherwise: it neither renames them nor presents them as something proprietary. The value is not in the averages, but in how they are coordinated. Plotting five EMAs by hand leaves the trader the task of identifying which pair crosses, remembering how much structural weight each pair carries and telling a momentum cross apart from a structural change, a manual, slow and error-prone job in real time. Edo EMA Core Cross solves that with one concrete design decision: ranking the crosses into three tiers and scaling the visual weight of each marker to its structural importance, so the three hierarchies —momentum with the 9/20, structure with the 20/50 and Golden or Death Cross with the 50/200— are read simultaneously and told apart at a glance. That visual coordination of the three hierarchies on a single clean overlay, and not the EMAs separately, is what the indicator contributes.
CONFIGURATION
Show EMA 9 / 20 Cross toggles the momentum hierarchy; Show EMA 20 / 50 Cross, the structure hierarchy; and Show EMA 50 / 200 Cross, the Golden and Death Cross. The colors and thicknesses of the EMAs are customized from the TradingView Style tab.
OPEN SOURCE
Edo EMA Core Cross is published as an open source and free indicator. The full Pine Script is publicly available on TradingView for study, adaptation and integration into any workflow.
This indicator is a technical analysis tool intended exclusively for educational and informational purposes. It does not generate automatic buy or sell signals and should not be considered financial advice. Trading in financial markets carries a significant risk of capital loss. Past results do not guarantee future results. Always use proper risk management.
指标

Multi Trend FilterOverview
Multi Trend Filter shows the market's underlying trend with a single, clean line. It uses the Daily timeframe as the base, then layers 4H and 30m confirmation on top, coloring the trend in three intuitive states: green / yellow / red. No matter which chart timeframe you view it on (15m, 1h, 4h, etc.), it stays consistent on the Daily basis, and a two-pass smoothing keeps the line smooth on any chart.
WHAT THE COLORS MEAN
Green (UPTREND): Uptrend confirmed.
Yellow (TRANSITION): Trend is shifting — awaiting confirmation.
Red (DOWNTREND): Downtrend confirmed.
HOW IT WORKS — 3-STAGE MULTI-TIMEFRAME CONFIRMATION
Set the broad direction with higher timeframes first, then confirm the entry with the lower timeframe last.
Daily (Base / Reference line) — the line drawn on the chart; the anchor of the larger trend.
4H (Primary confirmation) — when both the close and the 4H flow align above/below the Daily line, the base direction is set.
30m (Final confirmation) — in that base direction, once the candle body closes across the 30m line, the color is finalized:
Close closes ABOVE the 30m line → Green
Close closes BELOW the 30m line → Red
Yellow (Transition) is the period before both stages confirm — the 4H hasn't committed yet, or it has but the close hasn't cleared the 30m line. Once green/red is confirmed, the color ignores minor noise while the base holds (latch), so it won't flicker.
HOW TO READ IT
Green: uptrend intact. Look for pullback entries.
Red: downtrend intact. Look for bounce exits / stay aside.
Yellow: direction unclear; safer to wait until it confirms green/red.
Yellow to Green = bullish shift. Yellow to Red = bearish shift.
KEY SETTINGS
Trend Line — First / Second Smoothing Length: line smoothness and responsiveness.
Display Smoothing — Smooth Line, Smooth Strength: keeps the line smooth on any timeframe (higher = smoother, slightly more lag).
Confirmation Lines — Show 30m Line (Signal) / Show 4H Line (Base): reveal the lines used for confirmation.
Style — up/down/transition colors, line width, fill and transparency, trend label.
TIPS
Use it as a trend direction and shift filter, not a standalone trade signal.
Reliability increases when the trend color agrees with your own setup (support/resistance, volume, etc.).
If the line looks choppy, raise Smooth Strength.
DISCLAIMER
This indicator is a reference tool to help judge trend direction. It does not guarantee trading profits. All trading decisions and responsibility rest solely with the user. 指标

Multi-Tool: Overlays, MAs, Grid & Sessions🛠 Multi-Tool (H1/D1 Overlays, Flexible MAs & Session Grid)
📖 Introduction
The Scalp-Vision Multi-Tool is a professional analysis instrument designed specifically for scalpers and day traders. It combines the structure of higher timeframes (H1/D1) with session time markers and psychological price levels directly within the current chart. The goal is to make market context instantly readable — without having to switch timeframes.
✨ Key Features
📦 Multi-Timeframe Template Overlays (H1 & D1)
H1 Projection: The indicator takes the high and low of the last completed hourly candle and projects this range as a subtle "shadow" (box) over the current hour.
D1 Projection: Yesterday's range is overlaid as a large background frame across the current trading day.
Median Lines: Automatically calculated midlines for both time ranges serve as reference points for mean reversion trades.
Advantage: You can instantly see whether price is trading within the value area of the previous period or whether a breakout is occurring.
📈 Flexible Moving Averages (MA+)
Four MA Slots: Users can activate up to four moving averages simultaneously.
Individual Types: Each MA can be set separately as SMA (Simple), EMA (Exponential), or WMA (Weighted).
Fully Customizable: Length, color, and line width are freely adjustable for each MA, allowing strategies like the 20/200 crossover to be mapped perfectly.
🕒 Manual Session Markers (Vertical Lines)
Session Opens (Green): Vertical solid lines mark the start of the Asia, London, and New York sessions.
Session Closes (Red): Indicate the end of each respective trading session.
Flag Icons: Small icons (🇯🇵, 🇬🇧, 🇺🇸) at the bottom of the chart help with quick time orientation.
Manual Control: To avoid errors caused by timezone shifts, the hours and minutes of each session can be entered directly in the settings.
🏁 Round Numbers Grid (Psychological Levels)
100-Step Lines: Solid horizontal lines at round price levels (e.g. 1.1000, 1.1100).
50-Step Lines: Dashed lines for finer subdivision.
Global Design: The grid extends across the entire chart and helps place take-profit and stop-loss levels at institutionally relevant marks.
⚙️ User Guide & Settings
🛠 Setting Up Sessions
Since TradingView servers run globally, the safest method is manual input:
Look at your local time shown at the bottom of the time axis in the chart.
Enter the desired start and end time (hour and minute) in the fields under "Sessions (Manual Times)".
The lines will adjust to your chart immediately.
🎨 Visual Customization
Overlays: If the H1 boxes overlap the candles too heavily, reduce the opacity in the color settings of the boxes.
Line Styles: All session lines and medians can be switched from Solid to Dashed or Dotted.
💡 Trading Tips
Inside vs. Outside: Is price using the D1 median as support? A bounce is often a sign of strength.
Session Volatility: Watch the green London line (9:00 AM) — this is often where the first real trends of the day emerge.
Grid Magnetism: Round numbers frequently attract price. Use the grid to identify congested order areas. 指标

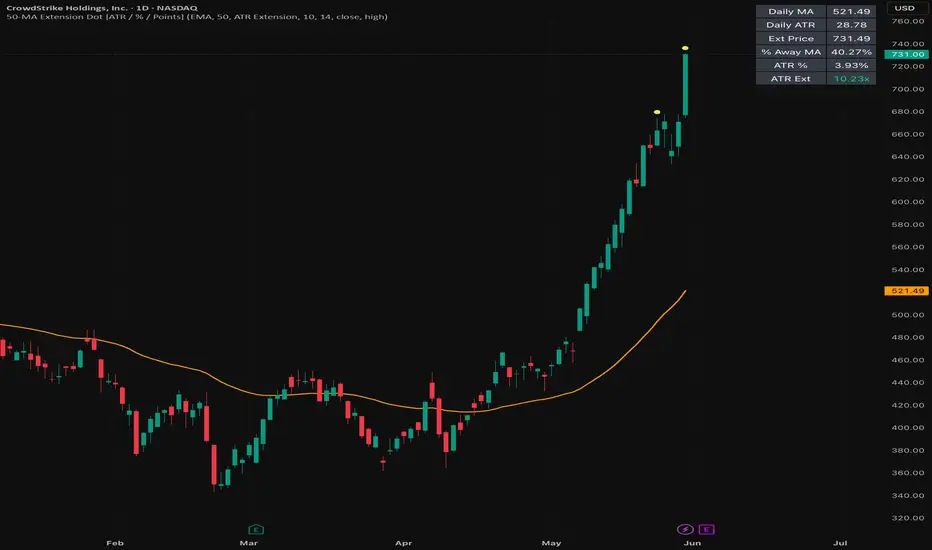
50-MA Extension Dot [ATR / % / Points]50-MA Extension Dot marks when price has moved a defined distance above a daily moving-average anchor. The goal of the script is to help traders study when price becomes extended relative to its daily trend structure, rather than judging a move by price alone.
The script supports three extension methods: ATR Extension, Percent, and Points. ATR Extension compares the distance from price to the daily moving average against the instrument’s daily ATR, making the reading volatility-adjusted. Percent mode measures how far price is above the moving average in percentage terms. Points mode measures the raw point distance above the moving-average anchor.
The moving-average type, moving-average length, threshold method, threshold value, ATR length, and extension source are customizable so traders can study past moves and build their own rules. For example, users can test how a symbol historically behaved when it became one ATR, two ATRs, a fixed percentage, or a fixed point distance above its daily moving-average reference.
When the selected threshold is reached, the script plots a small dot above the candle. The dot is not a standalone buy or sell signal. It is a visual marker showing that price has reached a defined extension zone relative to the chosen daily moving-average reference.
The script can also display the daily moving average, an optional threshold line, and a small table showing the current daily moving average, daily ATR, extension price, percentage distance from the moving average, ATR percentage, and ATR extension value.
This tool is useful for studying stretched moves, breakout extensions, momentum exhaustion, and conditions where price may be moving too far too quickly above its daily trend anchor. Because different symbols have different volatility profiles, the customizable inputs allow traders to compare past extensions and develop rules that fit their own process.
This indicator does not predict future price movement. It is a contextual extension tool designed to measure distance from a daily trend reference and help traders research historical extension behavior. 指标

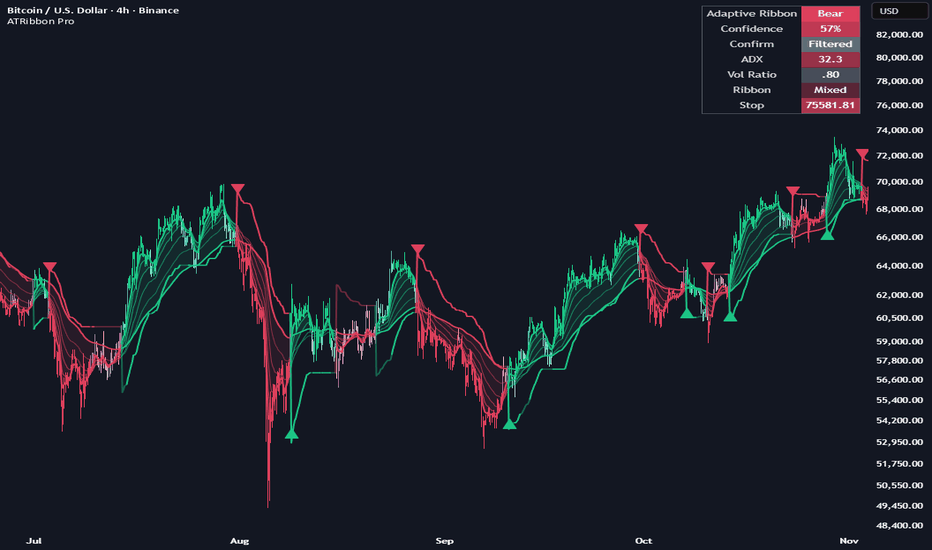
Adaptive Trend Ribbon [Alpha Extract]A sophisticated adaptive trend-following framework that combines volatility-responsive moving averages, ribbon stack analysis, ATR-based trend rails, ADX confirmation, pullback continuation signals, and a real-time confidence dashboard into one complete market regime tool. The indicator is designed to identify bullish and bearish trend environments, filter weak conditions, highlight confirmed trend flips, and provide structured stop guidance through an adaptive ATR rail. By adjusting ribbon sensitivity based on current volatility, the system aims to stay responsive during expansion phases while remaining smoother during quieter market conditions.
🔶 Adaptive Volatility-Based Ribbon Engine
Implements a multi-layer adaptive EMA ribbon that automatically modifies its effective moving-average lengths based on current volatility conditions. When volatility expands, the ribbon becomes more responsive by shortening its dynamic length. When volatility contracts, the ribbon lengthens to reduce noise and avoid unnecessary whipsaw.
volRatioRaw = atrAverage > 0 ? atr / atrAverage : 1.0
volRatio = clamp(volRatioRaw, 0.35, 2.75)
emaFast = adaptiveEma(src, baseFast, volRatio, adaptStrength)
This creates a trend ribbon that adapts to the market environment instead of relying on fixed moving-average behaviour across all conditions.
🔶 Six-Layer Trend Structure
Uses six adaptive moving averages ranging from fast to anchor length to define market structure across multiple trend speeds. The ribbon includes fast, mid, slow, and anchor components, allowing traders to see whether short-term momentum is aligned with broader trend direction.
A clean bullish trend forms when the ribbon is stacked from fastest above slowest, while a clean bearish trend forms when the ribbon is stacked from fastest below slowest. Mixed ribbon conditions indicate compression, transition, or weaker directional conviction.
🔶 Bullish & Bearish Stack Detection
Identifies strong directional alignment through full ribbon stack confirmation. Bullish stack conditions require every faster ribbon layer to sit above the slower layer beneath it, while bearish stack conditions require the opposite alignment.
This gives traders a simple way to distinguish clean trend environments from sideways or indecisive price action.
🔶 ATR Trend Rail System
Features a built-in ATR-based trend stop that acts as the main regime rail. The rail flips direction when price breaks through the active stop level, creating a clear bullish or bearish trend state.
longCandidateStop = railBasis - atr * atrMult
shortCandidateStop = railBasis + atr * atrMult
railDirection := close < trendStop ? -1 : 1
The stop can be based on the ribbon midline, close, or HL2, giving traders flexibility in how the trend rail is anchored.
🔶 Regime Flip Signal Logic
Generates long and short signals when the trend rail flips direction and the confirmation conditions are satisfied. A bullish signal occurs when the regime flips into bullish structure, while a bearish signal occurs when the regime flips into bearish structure.
Signals are filtered through ADX and directional movement confirmation when enabled, helping reduce low-quality flips during weak or choppy market conditions.
🔶 ADX & Directional Movement Confirmation
Integrates ADX confirmation to measure whether the market has enough directional strength to justify a trend signal. The system also checks directional movement by comparing +DI and -DI, allowing bullish regimes to favour positive directional pressure and bearish regimes to favour negative directional pressure.
This confirmation layer helps separate true trend expansion from random price movement.
🔶 Pullback Continuation Alerts
Includes optional pullback continuation logic designed to identify trend resumption after price interacts with the adaptive ribbon. When price pulls into the ribbon area and then closes back in the trend direction, the system can trigger continuation alerts.
This is useful for traders who prefer entering after a trend has already been established rather than only trading the initial regime flip.
🔶 Confidence Scoring Framework
Calculates a real-time trend confidence score by combining multiple components of trend quality, including ribbon stack alignment, price position relative to the ATR rail, ADX strength, directional movement, and spread between fast and anchor ribbon layers.
The score provides a quick snapshot of how strong and confirmed the current trend environment is.
🔶 Dynamic Trend Coloring System
Uses adaptive color logic to visually represent bullish, bearish, and neutral/mixed conditions. Candles, ribbon lines, fills, the ATR stop rail, and the status panel all update according to the current regime.
When ADX confirmation is enabled but the filter has not passed, the system fades the trend color to show that the regime exists but confirmation is weaker.
🔶 Real-Time Status Panel
Features a compact dashboard that displays the most important trend information directly on the chart. The panel includes:
• Current regime
• Confidence percentage
• Confirmation status
• ADX value
• Volatility ratio
• Ribbon stack condition
• Active stop level
This allows traders to quickly assess whether the market is bullish, bearish, filtered, mixed, or entering a stronger trend phase.
🔶 Flexible Risk Rail Basis
Allows the ATR stop rail to be calculated from different price references depending on the trader’s preferred style. Ribbon Mid creates a smoother institutional-style trend rail, Close makes the rail more reactive, and HL2 provides a balanced price reference.
This flexibility makes the indicator suitable for both faster trend-following styles and slower swing-trend systems.
🔶 Clean Overlay Visual Design
Displays the full adaptive ribbon directly on price with optional candle coloring, background regime shading, trend stop plotting, and signal markers. The ribbon uses layered transparency to maintain chart readability while still showing the strength and direction of the trend structure.
The result is a clean visual layout that can be used as a primary trend framework or as a confirmation layer alongside other systems.
🔶 Comprehensive Alert System
Includes alerts for the most important trend events:
• Adaptive Ribbon Long
• Adaptive Ribbon Short
• Bullish Pullback Continuation
• Bearish Pullback Continuation
• Long Trend Exit
• Short Trend Exit
These alerts allow traders to monitor trend flips, pullback continuations, and invalidation events without needing to constantly watch the chart.
🔶 Why Choose Adaptive Trend Ribbon ?
This indicator provides a complete adaptive trend-following environment by combining responsive moving-average structure, volatility-adjusted behaviour, ATR-based trend rails, ADX confirmation, continuation logic, and live confidence scoring. Instead of relying on a single moving average or fixed trend signal, it evaluates multiple layers of trend quality before confirming direction.
The adaptive ribbon helps traders understand whether the market is strongly aligned, weakening, transitioning, or mixed. The ATR rail provides a clear trend invalidation reference, while the confidence panel gives immediate context on whether the trend has enough structure and strength behind it. Perfect for trend-following traders, swing traders, momentum traders, and systematic traders who want a cleaner way to identify confirmed bullish and bearish regimes with built-in risk guidance. 指标
SoSa Smart Trend ProSoSa Smart Trend Pro
Advanced All-in-One Trading Indicator
SoSa Smart Trend Pro is a powerful institutional-grade trading indicator designed to help traders identify high-probability opportunities through advanced trend analysis, volume confirmation, momentum filters, Fair Value Gap detection, market structure analysis, and session-based trading tools.
Built for Forex, Stocks, Futures, Indices, and Cryptocurrency markets, SoSa Smart Trend Pro combines multiple professional trading concepts into a single indicator, allowing traders to make faster, smarter, and more confident decisions.
🚀 Core Features
📈 Advanced Trend Detection
Choose from multiple moving average types:
EMA
SMA
WMA
VWMA
RMA
HMA
DEMA
TEMA
Bollinger Basis
The moving average dynamically changes color to instantly identify market conditions:
🟢 Bullish Trend
🔴 Bearish Trend
🟡 Neutral Market
🕯️ Smart Engulfing Pattern Detection
Automatically detects:
Bullish Engulfing Patterns
Bearish Engulfing Patterns
Advanced body-size filtering helps eliminate weak setups and highlights stronger reversal opportunities.
📊 Volume Confirmation System
Filters market signals using real-time volume analysis.
Features include:
Volume SMA comparison
Adjustable volume multiplier
High-volume breakout confirmation
Helping traders avoid low-quality entries during weak market participation.
⚡ Institutional Fair Value Gap Detection
Automatically identifies market imbalances used by professional traders.
Includes:
Bullish Fair Value Gaps
Bearish Fair Value Gaps
ATR-based minimum gap sizing
Adjustable zone extensions
Dynamic FVG management
Ideal for identifying retracements, continuation setups, and liquidity zones.
🗽 New York Session Tracker
Monitor the most active trading session with:
Automatic New York Session Box
Session High & Low Tracking
Session Labels
Extended High/Low Levels
Perfect for traders who focus on market open volatility and liquidity sweeps.
🔵 Dynamic Support & Resistance Levels
Automatically plots key market structure zones based on pivot analysis.
Benefits:
Identifies potential reversal areas
Highlights important reaction zones
Improves entry and exit timing
📉 RSI Momentum Filter
Built-in Relative Strength Index analysis:
Custom RSI Length
Overbought Detection
Oversold Detection
Trade Confirmation Filter
Adds an additional layer of momentum validation.
〰️ MACD Confirmation Engine
Uses MACD crossover and histogram strength to confirm momentum.
Detects:
Bullish Momentum
Bearish Momentum
Trend Continuation Opportunities
Reducing false entries and increasing signal quality.
〰️ Bollinger Bands Integration
Monitor market volatility with built-in Bollinger Bands.
Features:
Adjustable Length
Adjustable Deviation Multiplier
Volatility Expansion Detection
Useful for breakout and mean-reversion strategies.
🎯 Smart Buy & Sell Signals
Signals are generated only when multiple confirmations align.
Signal conditions may include:
✅ Trend Direction
✅ Moving Average Confirmation
✅ Engulfing Pattern Detection
✅ Volume Confirmation
✅ RSI Validation
✅ MACD Confirmation
This multi-layer approach helps filter market noise and improve trade quality.
📊 Confidence Score Technology
Every trade signal includes a confidence rating from 0% to 100%.
The score is calculated using:
Trend Strength
Volume Activity
Fair Value Gap Confirmation
Engulfing Patterns
MACD Momentum
Price Structure Alignment
Allowing traders to quickly assess the quality of each setup.
🖥️ Professional Market Dashboard
The integrated information panel displays:
Market Trend
Volume Status
RSI Condition
MACD Status
Fair Value Gap Activity
New York Session Status
Confidence Score
Current Trading Signal
All critical market information is available in one location.
🔔 Real-Time Trading Alerts
Receive alerts for:
Buy Signals
Sell Signals
RSI Overbought Conditions
RSI Oversold Conditions
Bullish FVG Detection
Bearish FVG Detection
New York Session Open
Stay connected to the market without constantly watching the chart.
💎 Why Traders Choose SoSa Smart Trend Pro
✔ Combines multiple indicators into one
✔ Reduces chart clutter
✔ Improves signal quality
✔ Identifies institutional market imbalances
✔ Tracks trend, momentum, volume, and volatility
✔ Provides confidence-based trade scoring
✔ Suitable for scalpers, day traders, swing traders, and position traders
✔ Works across Forex, Crypto, Stocks, Futures, and Indices
Trade Smarter. Trade With Confidence.
SoSa Smart Trend Pro is built to provide a complete market analysis solution, combining trend identification, momentum confirmation, institutional concepts, and intelligent signal generation into one professional-grade trading tool. 📈🔥
Tagline:
"See the Trend. Trust the Signal. Trade with Confidence." 🚀 指标

GFG S/R lines ES + SPY correlation by Agaam## GFG S/R Lines + EMA by Agaam
**GFG S/R Lines + EMA** is a clean chart-overlay indicator designed to show important swing-based support and resistance levels together with a trend EMA.
The purpose of this indicator is to give traders a simple visual structure on the chart: where price has recently formed swing highs, where price has recently formed swing lows, and whether price is trading with or against the EMA trend.
## What The Indicator Shows
This script displays two main tools:
1. **Swing-based support and resistance lines**
2. **Trend EMA**
These two components work together to help traders understand market structure and trend direction without overcrowding the chart.
## Support and Resistance Logic
The indicator finds support and resistance using confirmed swing pivots.
A **resistance line** is created when price forms a confirmed swing high.
A **support line** is created when price forms a confirmed swing low.
The swing length can be adjusted in the settings. A smaller swing length will detect more levels, while a larger swing length will create fewer but stronger-looking levels.
The script also avoids placing duplicate levels too close together. If a new pivot forms near an existing level, the script filters it out so the chart stays cleaner.
## Support and Resistance Display
Support and resistance levels are drawn as horizontal lines directly on the chart.
Users can control:
* How many support and resistance levels are shown
* Line length
* Line width
* Whether lines extend right
* Whether lines extend left
* Support color
* Resistance color
* Timeframe tags
* Label size
* Label offset
This makes the indicator flexible for different chart styles and timeframes.
## Timeframe Tags
The indicator can display a small timeframe tag beside each support or resistance line.
This helps traders quickly see which chart timeframe created the level. For example, a level created on the 5-minute chart can be marked as 5m.
Timeframe tags can be turned on or off in the settings.
## EMA Logic
The indicator includes a trend EMA that helps show the current directional bias of price.
When the EMA is rising, it can suggest bullish trend pressure.
When the EMA is falling, it can suggest bearish trend pressure.
When the EMA is flat, it can suggest a more neutral or sideways condition.
The EMA length is adjustable, allowing traders to use a faster or slower trend guide depending on their trading style.
## EMA Colors
The EMA changes color based on its direction:
* Green when the EMA is rising
* Red when the EMA is falling
* Gray when the EMA is flat or neutral
This gives a fast visual read of trend direction without needing extra labels or panels.
## How Traders Can Use It
Traders can use this indicator to:
* Identify recent support areas
* Identify recent resistance areas
* Watch how price reacts near swing levels
* Use the EMA as a simple trend guide
* Compare price location to nearby support/resistance
* Keep the chart clean while still seeing structure and trend
For example, if price is above a rising EMA and pulling back toward a support line, traders may watch that area for a possible reaction. If price is below a falling EMA and approaching resistance, traders may watch for weakness or rejection.
## Important Notes
Support and resistance levels are based on confirmed pivots, so they appear after the swing is confirmed. They should be used as visual reference levels, not as guaranteed reversal points.
The EMA is a trend guide, not a standalone signal. Price can move above or below the EMA during choppy or volatile conditions.
This indicator is best used with market context, price action, and proper risk management.
## Disclaimer
This script is for educational and informational purposes only. It is not financial advice and does not guarantee trading results. Trading involves risk, and every trader is responsible for their own decisions.
指标

Guppy MMA Mean Reversion SignalsThe Guppy MMA Mean Reversion System is a trend-following mean reversion tool designed to identify high-probability pullbacks within established trends. By combining the classic Guppy Multiple Moving Average (GMMA) with volatility, volume, and momentum filters, this script aims to reduce the "noise" often found in standard moving average cross strategies.
The Concept: Why this Works
Standard GMMA indicators are excellent for visualizing trend strength but often lack precise entry triggers or filters to avoid entering during periods of low volume or extreme exhaustion. This script addresses these limitations by integrating four distinct analytical components:
- GMMA Ribbons (Trend & Reversion Zones) : We use two groups of EMAs (Short-term and Long-term). The Long-term group defines the "institutional" trend. Our entry logic looks for price to revert from the short-term trend back into the long-term trend zone—a classic sign of a healthy pullback.
- CVD Confluence (Volume Confirmation) : Using Cumulative Volume Delta (CVD) based on candle-body delta approximations, the script ensures that volume flow supports the entry direction. This prevents entering pullbacks that lack the necessary buying/selling pressure to resume the trend.
- ATR Volatility Filter (Statistical Spacing) : To avoid "choppy" entries, this filter requires the price to be at a statistically significant distance from the EMA based on market volatility (ATR). This ensures you are entering at a true "discount" rather than in a sideways market.
- RSI Exhaustion Filter (Momentum Safety) : We utilize RSI to ensure that a reversion hasn't reached an overextended state. For example, it prevents buying a pullback if the RSI indicates the asset is already in an overbought exhaustion phase.
How to Use
- Long Entries (Green Circles) : Triggers when the Long-term ribbon is bullish, and price pulls back to touch the Long-term EMA group, provided the CVD, ATR, and RSI conditions are met.
- Short Entries (Red Circles) : Triggers when the Long-term ribbon is bearish, and price rallies to touch the Long-term EMA group, filtered by volume and momentum.
- Exits (Labels) : Exit signals appear when price successfully reverts back to the "fast" Short-term group, marking the completion of the mean reversion move.
Key Features & Customization
- Independent Toggles : You can independently turn on/off buy signals, sell signals, and their respective exits to suit your specific trading style (e.g., only trading the long side).
- Signal Cooldown : Includes a customizable "bar count" cooldown to prevent multiple overlapping signals during high-volatility periods.
- Comprehensive Settings : Fully adjustable EMA lengths, ATR multipliers, and RSI thresholds to adapt the system to different timeframes and asset classes (Crypto, Forex, Stocks).
Settings Guide
- Use ATR Filter : Increase the multiplier for more conservative, wider entries.
- Use CVD Filter : Enable to ensure volume delta is trending with your entry.
- Use RSI Filter : Helps avoid "catching falling knives" by filtering out trades during extreme momentum spikes. 指标

XAU Smart Money Bot V10.3 [SMC + EMA Confluence]XAU Smart Money Bot V10.3
XAU Smart Money Bot V10.3 is a Smart Money Concepts (SMC) based trading indicator designed specifically for Gold (XAUUSD).
The indicator combines multiple market structure and momentum concepts into a single confluence-based system to identify high-probability BUY and SELL opportunities.
Core Components
The script combines:
• 9 EMA / 21 EMA trend analysis
• Higher Timeframe Bias filtering
• Fair Value Gaps (FVG)
• Order Blocks (OB)
• Liquidity Sweeps
• Market Structure Shifts (BOS / CHoCH)
• Premium and Discount Zones
• Displacement Candles
• Volume Confirmation using OBV
• ATR Volatility Filter
The purpose of combining these concepts is to filter out weak setups and only generate signals when trend, liquidity, momentum and market structure align in the same direction.
Signals are generated only when several conditions align simultaneously, reducing low-quality entries and helping traders focus on stronger setups.
Unlike traditional SMC indicators that only display structure, this script combines Smart Money Concepts, EMA trend filtering, momentum confirmation and volatility filtering into a single scoring model. Signals are generated only when multiple conditions align, helping traders avoid low-probability setups.
This indicator is not a simple combination of existing tools. It uses a custom confluence model that evaluates trend direction, market structure, liquidity events, momentum and volatility conditions before generating a signal.
Signal Logic
The indicator evaluates multiple bullish and bearish factors and creates a score-based confirmation model.
A signal is generated when:
Trend direction agrees with higher timeframe bias
Market structure supports the trade direction
Momentum and displacement are present
Liquidity conditions are favorable
Volatility requirements are met
Entry System
Instead of using market execution, the indicator calculates a Smart Money style entry zone based on recent price action.
For every signal the script automatically plots:
• Entry Level
• Stop Loss Level
• Take Profit Level
The entry is designed to provide better risk-to-reward opportunities compared to chasing price after a signal appears.
Visual Features
The indicator displays:
BUY / SELL labels
Entry levels
Stop Loss levels
Take Profit levels
EMA trend structure
This allows traders to quickly evaluate potential setups directly on the chart.
Recommended Markets
Designed primarily for:
XAUUSD (Gold)
Recommended Timeframes
15 Minute
30 Minute
1 Hour
Risk Disclaimer
This indicator is intended for educational and analytical purposes only.
No indicator can predict market movements with certainty. Always use proper risk management and perform your own analysis before entering any trade. 指标