指标
HTF + LTF Market Structure ICTHTF + LTF Market Structure ICT
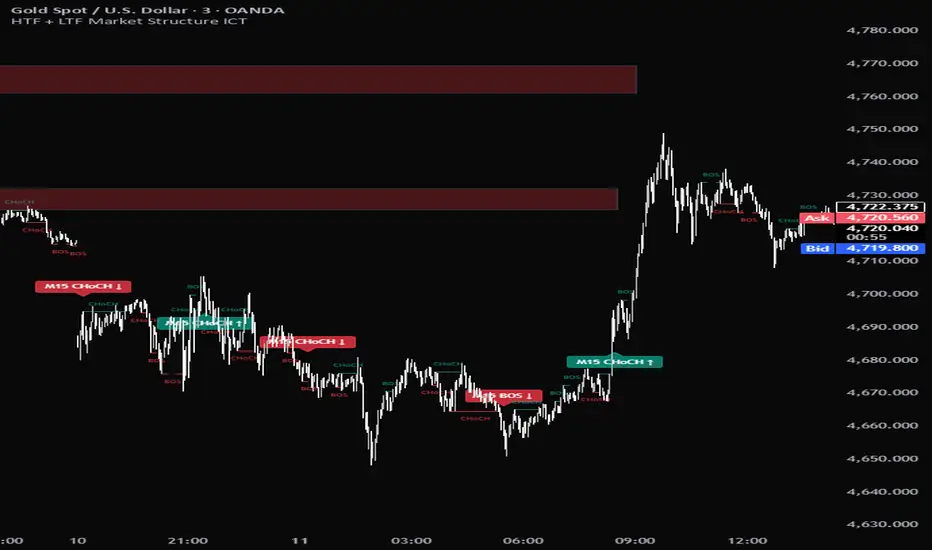
A dual-stream ICT-style market structure tool that detects MSS (Change of Character) and BOS (Break of Structure) events on both a higher timeframe and the current chart timeframe simultaneously — so you can read HTF context and LTF structure on a single chart.
What it does
The indicator runs the same fractal-based structure detector twice in parallel:
HTF stream (default M15) — runs via request.security with lookahead_off, so events are confirmed at the HTF candle close. Each event renders as a small labeled ribbon tag (e.g. M15 CHoCH ↑) on the LTF bar where the HTF candle closed. Bull tags sit below the bar, bear tags above. No projected lines.
LTF stream — runs on the chart TF directly. Each event renders as a break-level line spanning the broken fractal pivot to the firing bar, plus a minimal CHoCH / BOS text label at the line's midpoint — colored text only, no background fill. Bull text floats above the line, bear below.
Each stream tracks its own trend state, so the HTF and LTF can disagree — that disagreement is the actionable read (e.g. HTF still bullish while LTF just printed a CHoCH down = first sign of a pullback against trend).
How structure is classified
Each stream maintains its own directional bias:
MSS / CHoCH — the first break against the prior structural trend (reversal signal).
BOS — a break in the same direction as the current trend (continuation).
The very first event of each stream is classified as MSS by default since there's no prior reference. Line style differs: solid for MSS, dashed for BOS by default.
Detection logic
A fractal swing pivot is confirmed when a high/low is the extreme over a configurable length (default 5).
A break fires when the bar's close crosses through the most recent unbroken fractal (above for bull, below for bear), with barstate.isconfirmed so events don't repaint.
Auto-suppression
When the chart timeframe equals the chosen HTF (e.g. you're viewing the M15 chart with HTF = M15), the HTF ribbon is hidden — both streams would otherwise detect the exact same events on the same bars.
Inputs
HTF stream — HTF (15min / 30min / 1H / 4H / 1D), fractal length, MSS / BOS toggles
LTF stream — fractal length, MSS / BOS toggles
Display — line on/off, forward-extend latest line, LTF text on/off, history depth
Style — line styles (MSS solid / BOS dashed), line width, HTF ribbon size + transparency, LTF text size, bull / bear colors
Alerts
Ten preconfigured alertconditions:
HTF Bull CHoCH / Bear CHoCH / Bull BOS / Bear BOS
LTF Bull CHoCH / Bear CHoCH / Bull BOS / Bear BOS
LTF bull aligned with HTF-bull bias (confluence)
LTF bear aligned with HTF-bear bias (confluence)
Suggested use
Works on any symbol or timeframe. Default M15 HTF on an M1 / M3 / M5 chart gives a clean intraday read; for swing structure, try chart TF = 1H with HTF = 4H or 1D. The fractal length controls signal density — drop to 3 for more frequent events on lower-volatility instruments, raise to 7+ to filter for stronger swings.
This is a structure visualization tool, not a trading system — it doesn't take trades, manage risk, or compute lot sizes. Use it to read HTF context and LTF trigger timing.
Disclaimer
This script is for educational and analytical purposes only. It does not provide financial advice and does not guarantee profitability. Past performance of any structural pattern does not imply future results. Always combine with your own analysis and risk management.
Quick adjustments you might want before publishing: short title for TV (e.g. HTF+LTF MSS ICT), and grab a chart screenshot showing both HTF ribbons and LTF text active. 指标

Iterative Epanechnikov ChannelThe Iterative Epanechnikov Channel is a kernel-based smoothing and state estimation framework that applies an Epanechnikov kernel regression to price data, combined with a rolling standard deviation envelope to construct adaptive dynamic channel boundaries.
Unlike kernels with infinite support that allow distant historical observations to influence the estimate, the Epanechnikov kernel uses a compact weighting structure that strictly limits influence to a finite window. This ensures that only relevant, recent price information contributes to the regression, resulting in a more localized and structurally responsive estimate of price behavior.
The resulting channel is structurally responsive while remaining statistically efficient, making it particularly effective for tracking short-to-intermediate trend development, identifying localized overextension, and adapting quickly to evolving conditions.
Its primary utility is as a state estimation and structural tracking tool for price behavior, rather than a persistence-weighted regime model.
TRADING USES
The Epanechnikov Channel is best interpreted as a localized structural filter; within a multi-model framework, it captures the immediate structural state of price, helping distinguish early transitions, active trends, and short-term disequilibrium relative to slower, memory-weighted estimators.
Trend Detection
The channel basis line (Epanechnikov smoothed price) provides a responsive representation of underlying market direction. Sustained movement above or below the basis reflects directional continuation, while rapid shifts in the basis can indicate emerging changes in trend.
Structural Responsiveness
Due to the compact support of the Epanechnikov kernel, only recent price data contributes to the estimate. This produces sharper turning points and faster adaptation to new information, allowing the channel to respond efficiently to changes in market structure.
Mean Reversion Context
Because the estimator is more localized, price interacts with the channel boundaries more frequently. These interactions represent short-term deviations from the estimated state:
- Upper band: localized overextension
- Lower band: localized underextension
This makes the channel well-suited for mean reversion frameworks and volatility-based entry timing.
State Estimation
The channel functions as a continuous estimator of market state:
- The basis represents the inferred local price state
- The envelope represents dynamic volatility dispersion around that state
Compared to heavy-tailed kernels, the Epanechnikov-based state estimate is more sensitive to current conditions and less influenced by distant history, providing a clearer view of present market structure.
Volatility & Risk Context
The rolling standard deviation envelope expands and contracts based on realized volatility, providing a contextual risk framework. Wider channels indicate increased uncertainty and dispersion, while tighter channels indicate compression and lower variance conditions.
THEORY
The Epanechnikov kernel is a quadratic, compact-support kernel used in Nadaraya–Watson nonparametric regression, introduced by V. A. Epanechnikov (1969, Non-Parametric Estimation of a Multivariate Probability Density, Theory of Probability & Its Applications) as the mean squared error–optimal bounded kernel; in this implementation it is applied causally (non-repainting) and centered at the current bar using only historical data, with the original startAtBar offset removed to maintain proper kernel alignment with the estimation point.
It is defined as:
K(u) = 3/4 (1 − u²), for |u| ≤ 1
Where:
---> u represents normalized distance from the current observation
---> ℓ (lookback) defines the window over which the kernel operates
Unlike Gaussian kernels, which apply exponentially decaying weights over an infinite range, the Epanechnikov kernel assigns zero weight to all observations outside its finite support. This produces a strictly localized estimator that is both computationally efficient and statistically optimal in a mean squared error sense among bounded kernels.
Because the kernel is centered on the current observation and evaluated using only past data, the implementation remains causal and non-repainting while preserving the essential structure of kernel regression.
The rolling standard deviation complements this by measuring dispersion around the estimated state, forming a volatility-adaptive envelope. Rather than acting as a strict statistical confidence interval, it provides a dynamic representation of market expansion and contraction. The Epanechnikov kernel is a localized smoothing estimator rather than a structural similarity model, thus dispersion is defined using price-based volatility rather than kernel-weighted variance, providing a stable and interpretable envelope consistent with its role as a reactive state estimator.
The iterative implementation processes data sequentially (bar-by-bar), ensuring computational efficiency and making the indicator suitable for real-time use without repainting.
CALIBRATION
Calibration determines the balance between responsiveness, noise, and structural clarity.
Length (Lookback)
- Lower (8–16): More responsive, increased sensitivity to short-term structure
- Medium (20–40): Balanced for swing trading and intermediate regimes
- Higher (50–64+): Smoother output, reduced noise, slower response to turning points
Smoothing Mode (Single vs Double Pass)
Controls the tradeoff between responsiveness and stability:
Single Pass:
- Pure Epanechnikov regression
- Maximum responsiveness
- Faster detection of structural changes
- Increased sensitivity to noise
Double Pass:
- Applies the kernel regression twice
- Reduces variance and smooths fluctuations
- Produces cleaner structural output
- Introduces additional lag
This parameter allows users to tune the indicator based on whether early signal detection or stability is preferred.
MARKET USAGE
Stock, Forex, Crypto, Commodities, and Indices. 指标

Smooths 50 Point LevelsSmooth's 50-Point Levels
Overview
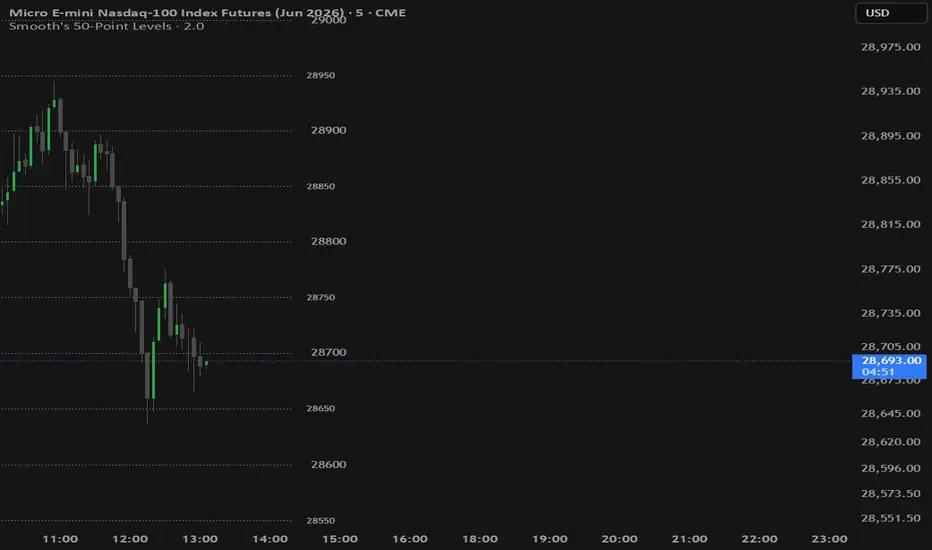
This indicator automatically plots horizontal price levels at every 50-point interval across the chart, centered around the current price. It is designed specifically for futures traders (NQ, ES, MNQ, MES) who use round-number price levels as key reference points for support, resistance, entries, and targets.
How It Works
The indicator calculates the nearest 50-point boundary to the current price using math.round(price / 50) * 50 as its base, then draws a configurable number of levels above and below that base. Levels are split into two distinct categories:
Round Hundreds (X00) — levels ending in 00 (e.g. 19800, 19900, 20000). These represent major psychological price levels where institutional activity and order flow tend to concentrate.
Half-Hundreds (X50) — levels ending in 50 (e.g. 19850, 19950). These act as midpoint references between the major levels, useful for identifying equilibrium zones and scalp targets.
Session Reset
Lines reset visually at a user-defined time each day (default 16:00 ET), meaning the left edge of every line anchors to that bar. This keeps the chart clean and session-specific — only showing levels relevant to the current trading session. A toggle allows lines to be extended further left for historical context.
How To Use
Use Round Hundred levels as primary support/resistance and trade targets
Use Half-Hundred levels as midpoint references and short-term scalp zones
Levels reset at 16:00 ET daily to reflect the new session's relevant price range
Adjust the number of levels displayed to match your trading range
Enable left extension when reviewing previous session price action
Customization
Each level group has independent controls for color, line style (solid/dashed/dotted), line width, label visibility, and label size. Right extension allows lines to project into future bars for forward reference. 指标

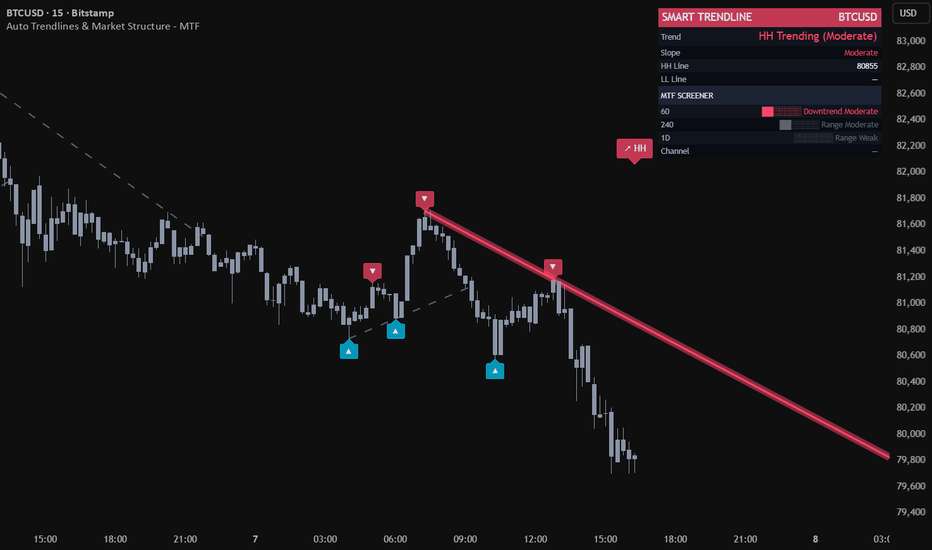
Auto Trendlines & Market Structure - MTFAuto Trendlines & Market Structure - MTF
Auto Trendlines & Market Structure - MTF is a visual analytical indicator that automatically draws support and resistance trendlines through swing pivots and classifies the resulting structure into one of seven states: Uptrend, Downtrend, Expanding, Contracting, Range, HH Trending, or LL Trending. A compact panel in the top-right shows how that classification compares across the current chart timeframe and three higher timeframes.
The goal is to remove the subjectivity of manual trendline drawing while keeping the chart readable: only the two currently relevant lines (one from recent pivot highs, one from recent pivot lows) are drawn as active, while older invalidated lines fade into a dashed historical layer for context.
This is a visual analytical tool intended for chart reading and structure mapping. It does not execute trades and does not provide financial advice.
Key Features
Auto-detected trendlines through the two most recent valid pivot highs (resistance) and pivot lows (support)
Adaptive pivot lookback that scales with ATR-relative volatility, with optional fixed-length mode
Seven-class structure classification rather than a binary up/down trend
Multi-timeframe panel scanning the current TF plus three higher TFs
Validation logic that rejects lines penetrated by older pivots beyond an ATR-based tolerance
Historical line trail (dashed) preserved when an active trendline gets broken or replaced
Two-layer neon line rendering and gradient channel fill scaled by ATR
Core Concept
Most automatic trendline scripts simply connect the two most recent pivots and call it a trendline. This produces noisy output in choppy markets and resists no contradiction from older swings. This indicator adds three layers on top of that base.
1. Pivot Validation. Before a candidate trendline becomes active, it is checked against up to four older pivots in the same direction. If any of them sits more than 0.3 ATR above a resistance line (or below a support line), the candidate is rejected. This filters out lines that look correct on the latest two pivots but conflict with established structure.
2. ATR-Normalized Slope. Slope is stored not in raw price-per-bar units but in ATR-per-bar units. This makes slope comparable across instruments and timeframes: a normalized slope of 0.1 means roughly one-tenth of an ATR per bar regardless of whether the chart is EURUSD on 15m or BTCUSD on 4H. Strength buckets (Weak / Moderate / Strong / Very Strong) are then defined on this normalized scale.
3. Seven-Class Structure Classification. Instead of collapsing everything into "up or down", the indicator combines the slope sign of both lines:
Both up — Uptrend
Both down — Downtrend
Resistance up, support down — Expanding (broadening)
Resistance down, support up — Contracting (converging)
Both flat within threshold — Range
Only support active — LL Trending (one-sided structure)
Only resistance active — HH Trending (one-sided structure)
This classification surfaces structural states that a single trend label cannot describe — particularly Expanding and Contracting, which often precede volatility expansions or breakouts.
Trendline Lifecycle
Each line goes through a defined lifecycle:
Built from the two newest valid pivots in its direction
Projected to the right and rendered with a colored core plus a wider transparent glow
Replaced when a newer pivot pair forms a more recent line — the previous line is then frozen as a dashed historical reference
Invalidated when price closes more than 0.5 ATR beyond the line — at that moment the line stops projecting, freezes at the breakpoint, and a break alert can fire
The historical trail is capped at 80 frozen lines (FIFO) so the chart does not accumulate clutter on long histories.
Multi-Timeframe Panel
A compact panel in the top-right corner displays the current trend classification across the current timeframe and three higher timeframes. The three HTFs are selected automatically from the standard ladder (1m, 5m, 15m, 1H, 4H, 1D, 1W, 1M, 3M, 12M) based on the active chart timeframe — for example, on a 1H chart the panel shows 4H, 1D, 1W.
Each row shows:
Timeframe label
Block-bar strength gauge
Class name (Uptrend / Downtrend / Expanding / Contracting / Range / HH Trending / LL Trending / Building)
Strength tier (Weak / Moderate / Strong / Very Strong)
The panel also shows the current chart's HH and LL line levels and the absolute and percentage channel width when both lines are active. HTF data is pulled with non-repainting parameters so the panel stays consistent on confirmed bars.
Typical Analysis Workflow
A common analytical workflow may include:
Reading the structure class on the chart timeframe to understand the immediate state
Comparing it to the three higher timeframes in the panel to detect alignment or conflict
Watching the channel width as the structure transitions between Expanding, Contracting, and Range
Using line breaks and the dashed historical trail to time potential structure shifts
Combining the structure read with other forms of analysis and risk management
Configuration
Pivot Lookback Mode — Adaptive (default) scales the pivot length with ATR-relative volatility (between 5 and 10 bars on each side). Fixed lets you set a single lookback between 3 and 15 bars.
Show Trend Lines — Toggles the active two-layer neon trendlines.
Show Channel Fill — Fills the area between active lines with a gradient. Only rendered when both lines are active and the structure is Uptrend, Downtrend, or Range (skipped during Expanding and Contracting to avoid visual confusion).
Show MTF Panel — Toggles the multi-timeframe panel.
Show Pivot Markers — Triangle markers at the most recent pivots, capped at 6 to avoid clutter.
Show Trend Status — Large class badge above price.
Show Line Labels — "HH" and "LL" anchor markers at the right end of each active line.
Line Width (Core) — Width of the inner core line. The outer glow is always rendered at core + 7.
Markets and Timeframes
The indicator can be applied across multiple markets and timeframes:
Forex
Stocks and Indices
Commodities
Cryptocurrencies
Because slope is ATR-normalized and pivot lookback is volatility-adaptive, the visual behavior remains consistent across instruments and timeframes without manual re-tuning.
Alerts
Three alert conditions are available:
Trend Class Changed — fires when the structure classification transitions between any of the seven states
Resistance Break — fires when price closes more than 0.5 ATR above the active resistance line
Support Break — fires when price closes more than 0.5 ATR below the active support line
All alerts evaluate on confirmed bars to avoid intra-bar oscillation.
Notes on Repainting
Active trendlines are anchored to confirmed pivot highs and pivot lows, which are themselves only validated after a pivot lookback window has fully passed. Once an active line is drawn its anchor points do not move. The MTF panel uses confirmed higher-timeframe values with a one-bar offset, so its readings stay consistent across historical and realtime bars. Alerts trigger only on confirmed bars.
Important Notes
This indicator is an analytical visualization tool. It does not execute trades and does not provide financial advice. All outputs are informational and should be interpreted within the context of independent market analysis and proper risk management.
Past behavior of any technical indicator does not guarantee future results.
If you find this indicator useful, feel free to add it to your favorites and share your feedback in the comments. Community feedback helps improve future updates. 指标
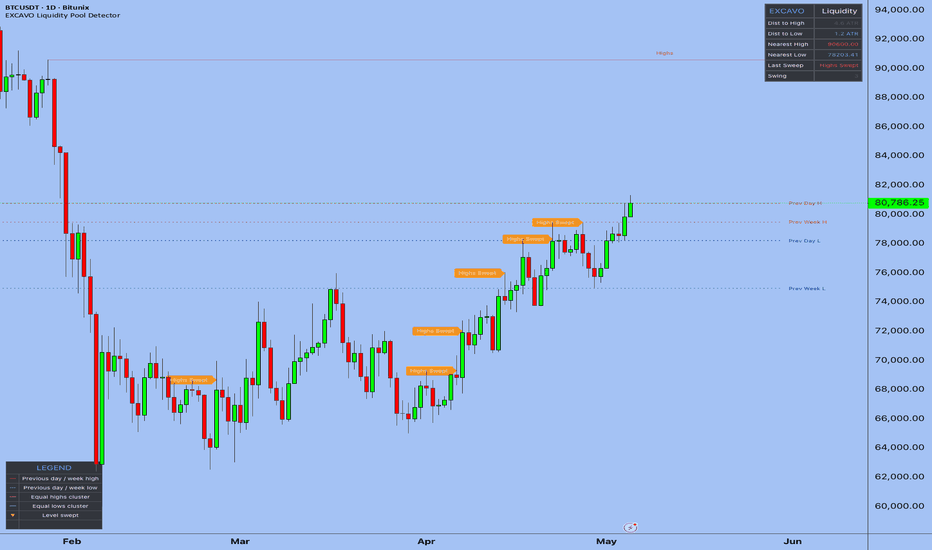
Liquidity Pool Detector [EXCAVO]Equal High/Low Cluster Detection with Sweep Identification and Period Reference Levels
The Liquidity Pool Detector identifies where resting orders accumulate near swing
levels by detecting equal highs and equal lows using swing pivot analysis with ATR-based
tolerance. When price wicks through a cluster level and closes back inside, the indicator
marks a sweep - the moment orders at that level were filled and price reversed direction.
This is not a basic pivot-high/low indicator. The cluster-merging logic groups nearby
pivots into unified levels with touch counts, and the sweep filter distinguishes between
a genuine zone test and a breakout continuation.
━━━━━━━━━━━━━━━━━━━━━━━━━━━━━━━━━━━━━━━
▸ HOW TO USE
Step 1 → Add the indicator to the price chart. Red solid lines appear above
price (equal highs clusters) and blue solid lines appear below price
(equal lows clusters). Previous day and week H/L reference levels
appear as slightly thicker dotted lines.
Step 2 → Watch for sweep markers. "Highs Swept" appears on a bar where price
wicked above an equal-highs cluster and closed back below it. "Lows
Swept" appears below a bar where price wicked below equal lows and
closed above. These bars indicate price tested and reversed from a cluster level.
Step 3 → Read the touch count on each cluster label. "Highs ×3" means three
swing highs formed at approximately the same level - a stronger cluster
with a stronger level formed by more historical touches.
Step 4 → Check the dashboard. Dist to High and Dist to Low show how many ATR
units separate current price from the nearest cluster above and below.
Values below 1.0 ATR highlight in orange - price is close to a level.
Nearest High and Nearest Low show the exact price of those levels.
Step 5 → Set up sweep alerts to receive notifications on bar close when a
cluster level is tested and rejected. Use JSON Alerts for bot integration.
━━━━━━━━━━━━━━━━━━━━━━━━━━━━━━━━━━━━━━━
▸ HOW IT CALCULATES
◆ Swing Pivot Detection
The indicator uses ta.pivothigh() and ta.pivotlow() with a configurable Swing Length
(default 3). A pivot high is confirmed when the bar's high is the highest point among
the surrounding N bars on each side - requiring N bars to the left and N bars to the
right, so detection occurs N bars after the actual pivot forms. This lag ensures the
pivot is fully confirmed and the value never changes after the bar closes. Lower Swing
Length values (2-3) suit intraday timeframes; higher values (5) suit daily charts.
◆ Cluster Merging (ATR Tolerance)
When a new confirmed pivot is detected, the indicator compares it against all existing
clusters of the same type. If the distance between the new pivot and an existing cluster
level is within the Equal Tolerance threshold (default 0.5 x ATR), the pivots are merged:
the cluster level is updated to the weighted average of all touches, and the touch count
increments. If no nearby cluster exists and the cluster limit has not been reached, a new
cluster is created at that price level. This approach prevents visual noise from minor
price variations between otherwise equal levels.
◆ Sweep Detection
On each confirmed bar close, every active cluster is checked against two conditions.
For equal-highs clusters: if the bar's high exceeded the cluster level AND the close is
below the cluster level, a sweep is registered - price moved through the zone of resting
orders and reversed. For equal-lows clusters: if the bar's low was below the cluster level
AND the close is above it, a sweep is registered. A close through the level without
reversal (close >= highs cluster, or close <= lows cluster) is treated as a breakout:
the cluster is invalidated and removed without a sweep marker.
◆ Period Reference Levels
Previous Day High/Low and Previous Week High/Low are fetched using request.security()
with a confirmed-bar offset (high / low with barmerge.lookahead_on). These levels
are included in the Nearest High and Nearest Low dashboard calculations alongside the
detected equal-high/low clusters.
◆ Non-Repainting Design
All cluster additions, sweep detections, and invalidations are gated on
barstate.isconfirmed. No cluster is created and no sweep marker is placed until the bar
closes. Pivot detection uses a right-bar offset that confirms the pivot on a fully closed
bar. No value changes after a bar is confirmed.
━━━━━━━━━━━━━━━━━━━━━━━━━━━━━━━━━━━━━━━
▸ WHAT MAKES IT DIFFERENT
◆ ATR-Based Cluster Tolerance
Most equal-high/low detectors use a fixed pip or percentage threshold that fails across
different instruments and timeframes. Using ATR as the tolerance baseline means the same
settings work on BTCUSD hourly (high ATR) and EURUSD daily (low ATR) without manual
recalibration. The tolerance adapts to current market conditions automatically.
◆ Cluster Merging with Touch Count
Instead of drawing a separate line for every swing pivot, nearby pivots are merged into a
single cluster with an incrementing touch count. A cluster labeled "Highs ×3" represents
three independent swing highs at the same level - a significantly stronger zone than a
single untested level. The line and label update in place as new touches are added.
◆ Sweep vs Breakout Distinction
The indicator explicitly separates sweep bars (wick through, close back inside) from
breakout bars (close through the level). A sweep generates a "Highs Swept" or "Lows
Swept" marker and an alert. A breakout silently removes the cluster. This distinction
matters: sweeps are potential reversal setups; breakouts confirm continuation.
◆ Period Levels as Part of the Analysis
Previous Day and Week H/L are integrated into the same framework as the equal-high/low
clusters. They appear in the Nearest High/Low dashboard calculation and use the same color
scheme as cluster lines, making them immediately readable alongside the dynamically
detected clusters.
━━━━━━━━━━━━━━━━━━━━━━━━━━━━━━━━━━━━━━━
▸ DASHBOARD
Compact panel showing current conditions:
Dist to High - distance from current price to nearest cluster above, in ATR units; turns orange below 1.0 ATR
Dist to Low - distance from current price to nearest cluster below, in ATR units; turns orange below 1.0 ATR
Nearest High - exact price of the closest active cluster or period level above
Nearest Low - exact price of the closest active cluster or period level below
Last Sweep - most recent sweep type: Highs Swept, Lows Swept, or - (none)
Swing - active swing length parameter
Legend table (bottom left) explains cluster lines, period levels, and sweep markers.
Both panels toggle in Dashboard settings.
━━━━━━━━━━━━━━━━━━━━━━━━━━━━━━━━━━━━━━━
▸ SETTINGS
Detection
Swing Length - 3 bars (pivot confirmation window left and right; use 2-3 for intraday, 5 for daily)
Equal Tolerance (x ATR) - 0.5 (cluster merge radius as ATR multiple)
Max Clusters - 10 (maximum active clusters tracked per direction)
Max Display Distance (x ATR) - 5.0 (clusters beyond this ATR distance from price are hidden; detection continues)
Period Levels
Show Prev Day H/L - ON (previous day high and low reference lines)
Show Prev Week H/L - ON (previous week high and low reference lines)
Visualization
Bull Color - default blue (equal-lows clusters and lows-swept markers)
Bear Color - default red (equal-highs clusters and highs-swept markers)
Sweep Color - default orange (sweep marker labels)
Show Sweep Markers - ON (labeled markers on sweep bars)
Background Highlight - OFF (subtle tint when price is within one ATR of nearest cluster)
Alerts
JSON Alerts - OFF (enable for bot integration)
Dashboard
Dashboard Position - Top Right
Show Dashboard - ON
Show Legend - ON
━━━━━━━━━━━━━━━━━━━━━━━━━━━━━━━━━━━━━━━
▸ ALERTS
Highs Swept - price wicked above equal-highs cluster and closed below on bar close
Lows Swept - price wicked below equal-lows cluster and closed above on bar close
Any Sweep - any cluster level tested and rejected on bar close
━━━━━━━━━━━━━━━━━━━━━━━━━━━━━━━━━━━━━━━
Best regards,
EXCAVO
Disclaimer
Trading involves significant risk. This indicator is a technical analysis tool
and does not constitute financial advice, investment recommendations, or a
guarantee of future results. Past indicator behavior does not guarantee future
performance. Always use proper risk management and your own judgment.
指标
Camarilla Pivot Points with Actual Price Data for Heikin AshiNick Stott developed the Camarilla system in 1989 while trading bonds. The name comes from the Latin word for a small, private room — the implication being that these are hidden levels the market naturally gravitates toward. The core insight is that markets are mean-reverting by nature on an intraday basis — price tends to oscillate around a central value during the day (such as VWAP or some other level) rather than trend continuously. The Camarilla levels are designed to identify the precise price points where that mean reversion is most likely to occur, and where it's most likely to fail and become a genuine breakout instead.
The formula takes yesterday's high, low, and close and generates four resistance levels above (H1–H4) and four support levels below (L1–L4). The multipliers (0.0916, 0.183, 0.275, 0.55) are derived from Fibonacci ratios, which is what distinguishes Camarilla from classic pivot points that use simpler arithmetic.
H3 and L3 — the counter-trend levels. These are the workhorses of the system for day traders. The theory is that on a typical day, price will trade up to H3 or down to L3 and then reverse. You trade against the move at these levels — short at H3, long at L3 — with your stop placed just beyond H4 or L4 respectively. These setups have a high win rate in ranging, non-trending conditions because the market is simply oscillating within its expected daily range.
H4 and L4 — the breakout levels. When price breaks convincingly through H4 or L4, the mean-reversion thesis is invalidated. The market is telling you something unusual is happening — there's genuine directional momentum. At that point you flip your approach entirely and trade with the move, going long above H4 or short below L4, targeting H5 (which is H4 + the H4–H3 range) or L5 respectively. These are the high-reward trades but they occur less frequently.
H1, H2, L1, L2 — the minor levels. These are weaker and less reliable individually. Experienced Camarilla traders often use them as partial profit targets or as zones to tighten stops rather than as primary entry signals.
I prefer using Heikin Ashi candles on my chart -- however they are mathematically derived averages of price, calculated using a specific formula. Heikin Ashi candles do not show real price data. But on a regular candlestick chart it gets the actual market high, low, and close. On a Heikin Ashi chart you get the smoothed, averaged versions of those values -- which are always closer to the midpoint of the day's range and never reflect the true extremes. So I had to add in a tweak to use actual OHLC price data. 指标

Liquidity Delta Profiler [LuxAlgo]The Liquidity Delta Profiler indicator identifies major buy-side and sell-side liquidity levels and visualizes internal buyer/seller activity through volume delta-filled quadrants, providing a complete toolkit for analyzing liquidity sweeps and potential reversals.
🔶 USAGE
The indicator detects significant swing highs and lows to plot liquidity zones, representing areas where stop-loss orders or breakout orders are likely clustered.
🔹 Volume Delta Quadrants
Unlike standard liquidity indicators, this tool splits each zone into four horizontal quadrants. As price trades within these quadrants, the script calculates the volume delta (the difference between buying and selling pressure) for each specific section.
Buy Delta Fill : Indicates aggressive buyers were more active in that specific price slice.
Sell Delta Fill : Indicates aggressive sellers dominated that section.
Intensity : The color's opacity represents the relative magnitude of the volume delta compared to other sections of the zone.
🔹 Reversal Detection
The script includes an advanced detection system that identifies unusual volume patterns during liquidity sweeps. These signals are plotted as bubbles with hoverable tooltips:
ABS (Absorption) : Occurs when aggressive market orders at the extreme edge of a zone are absorbed by large limit orders in the opposite direction.
EXH (Exhaustion) : Occurs when a sweep happens on very low relative volume, suggesting no follow-through.
DIV (Divergence) : Identified when high volume pushes into the edge of a zone (FOMO) but price fails to close outside the level.
REJ (Snapback Rejection) : Triggered when a sweep candle shows high delta in the opposite direction of the sweep and closes back inside the zone.
🔹 Time-Based Performance Dashboard
To evaluate signal reliability, the indicator includes a real-time dashboard that tracks the historical performance of each reversal signal type using a time-based validation logic.
A "Win" is recorded if, within the Eval Window , the price reverses from the sweep and remains in profit (on the correct side of the signal entry) for a specific number of consecutive bars ( Hold Time ). This method filters for signals that generate sustained pressure rather than just temporary wicks.
🔹 Zone Decay (Health)
Active zones feature a "Health" percentage label. This tracks the cumulative volume traded within the zone relative to its capacity. As more volume is transacted at these levels, the liquidity is considered "consumed," and the percentage drops toward 0%.
🔶 DETAILS
The indicator utilizes a pivot-based detection system. When a swing high is confirmed, a Buy-Side Liquidity (BSL) zone is created; a swing low creates a Sell-Side Liquidity (SSL) zone.
The script includes "Filter Overlaps" logic to ensure chart clarity. If a new, more significant pivot forms within the range of an existing active zone, the tool can automatically update to the most relevant level, preventing the clutter of multiple overlapping boxes.
🔶 SETTINGS
🔹 Main
Pivot Length : Lookback/lookforward period for detecting swing highs and lows.
Max Zones per Type : Maximum number of active and historical zones to keep on the chart.
Show Swept Zones : Keeps zones visible with dashed outlines after they have been breached.
Filter Overlapping Zones : Prevents the creation of new zones that overlap with existing active zones.
🔹 Decay & Reversals
Show Zone Decay : Toggles the health percentage labels.
Zone Volume Capacity : Multiplier for average volume to determine how much volume a zone can absorb.
Enable Reversal Detection : Toggles the signal bubbles for reversal patterns.
🔹 Dashboard
Show Dashboard : Toggles the performance tracking table.
Eval Window (Bars) : The maximum number of bars the script waits for a reversal to manifest.
Hold Time (Bars) : The number of consecutive bars price must stay in profit to be considered a successful reversal.
Position/Size : Customizes the UI placement and scale of the dashboard.
🔹 Style
Colors : Customize colors for BSL/SSL outlines and the positive/negative volume delta fills. 指标

[CT] Adaptive ATR Volatility Targets Adaptive ATR Volatility Targets is a volatility-based target tool designed to help traders identify projected expansion levels above and below a chosen anchor price. The indicator uses either ADR, Average Daily Range based on high minus low, or ATR, Average True Range, to calculate dynamic price targets from the selected volatility timeframe. This allows traders to see where price may reasonably expand during the current session, day, week, or chosen higher-timeframe period.
The center anchor can be based on the current open, the previous close, or HLC3, giving traders flexibility in how they want to frame the active volatility range. From that anchor, the indicator plots target levels in quarter-volatility increments, including 0.25, 0.50, 0.75, 1.00, and beyond. These levels can help traders identify early expansion zones, major target zones, possible profit-taking areas, and locations where price may begin to slow, reject, or become extended.
A key feature of this indicator is the Golden Target level at 0.618. This level is included because markets often react around proportional expansion areas before reaching full volatility targets. The 0.618 level can be useful for partial profits, trend continuation confirmation, or watching for rejection when price has not yet reached the full 1.0 volatility target.
The indicator also includes visual zone fills between the major levels. These zones help traders quickly read whether price is still near the anchor, beginning to expand, approaching a major volatility target, or trading in an extended area. The upper zones represent bullish expansion targets, while the lower zones represent bearish expansion targets. The center line acts as the reference point for the active volatility range.
The added history feature allows traders to keep previous volatility target sets on the chart. This is useful for studying how price reacted to prior ATR or ADR levels, identifying repeated respect or rejection zones, and reviewing whether previous targets acted as support, resistance, liquidity areas, or exhaustion points. Historical target sets can be faded so the current target levels remain the primary focus while still giving context from prior periods.
This tool is best used as a target and context indicator, not as a standalone buy or sell signal. A trader may use it to plan profit targets after a confirmed trend entry, measure how far price has already expanded from the session anchor, identify when price is becoming stretched, or determine whether there is still room for continuation. In a strong bullish move, upper volatility targets can act as upside objectives. In a strong bearish move, lower volatility targets can act as downside objectives. In a range-bound market, rejection around the 0.50, 0.618, or 1.0 levels may warn that price is losing momentum.
For best results, this indicator should be combined with trend direction, volume, market structure, VWAP, opening range levels, or momentum confirmation. When price is expanding toward a volatility target with strong trend confirmation, the level can be used as a logical profit objective. When price reaches a target with weakening momentum, divergence, rejection candles, or heavy opposing volume, the level may become a warning area for profit-taking or reversal risk.
Adaptive ATR Volatility Targets is designed to give traders a clean volatility roadmap. It helps answer three important questions: where is price starting from, how far has price expanded, and where are the next reasonable upside or downside targets based on current volatility. 指标

指标
Adaptive Support and Resistance Zones [BigBeluga]🔵 OVERVIEW
Adaptive Support and Resistance Zones is a high-performance technical analysis tool designed to identify, manage, and visualize key supply and demand areas. Unlike static pivot indicators that clutter the chart with every minor high and low, this script employs volatility-adjusted logic (ATR) to ensure only the most significant structural levels are maintained.
The indicator treats support and resistance not as thin lines, but as dynamic zones , accounting for market "noise" and providing a clearer picture of where institutional interest actually lies.
🔵 CONCEPT
Volatility-Aware Detection — Uses ATR-based filtering to qualify pivot points. A level is only created if the price rejection is strong enough relative to current market volatility.
Smart Level Merging — Automatically consolidates levels that are too close to one another, preventing "line spaghetti" and identifying high-confluence zones.
Dynamic Zone Rendering — Visualizes S/R as shaded boxes. The width of these zones adapts to market volatility, providing a realistic representation of supply and demand.
Real-Time Breakout Tracking — Monitors price action in real-time to detect when a level is definitively breached, switching its status from "Active" to "Broken."
Automatic Pruning — Cleans the chart by removing levels that have exceeded a maximum age, ensuring your focus remains on current market structure.
🔵 HOW IT WORKS (IN-DEPTH)
1️⃣ Advanced Swing Detection
The indicator scans for Pivot Highs and Lows based on a user-defined Pivot Length.
The Strength Filter: It applies a "Min ATR Strength" check. For a pivot to be valid, the distance between the pivot point and its immediate neighbors must exceed a mathematical threshold of volatility. This filters out "fake" pivots during low-volume consolidation.
2️⃣ Adaptive Level Management
Merge Logic: Before a new level is drawn, the script checks if an existing level already exists within the "Merge Threshold." If it does, the indicator skips the new level, effectively treating the existing zone as the dominant area of interest.
Active vs. Broken: Levels remain "Active" as solid lines/zones as long as price respects them. Once price closes beyond the level (controlled by Break Sensitivity), the level is moved to the "Broken" category.
Visual Transition: Broken levels can be kept on the chart as muted, dotted lines—a crucial feature for traders who look for "S/R Flip" opportunities (where old resistance becomes new support).
3️⃣ The S/R Dashboard
A dedicated on-screen table provides a birds-eye view of the current structural state.
Nearest Resistance/Support: Displays the exact price of the closest active levels.
Last Break: Identifies the direction of the most recent volatility-confirmed breakout.
Active Counter: Keeps track of how many structural levels are currently being monitored by the system.
🔵 KEY FEATURES
ATR-Based Zone Width: Zones expand and contract based on market volatility, ensuring your stop-loss or entry buffers are mathematically sound.
Price Labels: Optional labels at the end of active lines provide the exact price for quick order entry.
Customizable Break Sensitivity: Define how much "daylight" price needs to show above or below a level before a breakout is confirmed.
Historical Record: Retain a specific number of recently broken levels to identify long-term historical confluence.
Clean Visuals: High-contrast colors for Support (Cyan) and Resistance (Orange), with fully customizable transparency.
🔵 HOW TO USE
Trading the Rejection: Look for price to enter a shaded Support or Resistance Zone. Wait for a reversal candle within the zone for a high-probability entry back toward the mean.
Trading the Breakout: When the "< Break" label appears, it confirms that price has closed beyond the zone with enough momentum to overcome the "Break Sensitivity" threshold.
The S/R Flip: Monitor "Broken" (dotted) levels. If price returns to a dotted Resistance line and treats it as Support, it confirms a structural shift in the market.
Volatility Buffers: Use the vertical height of the Zone Boxes to determine your "No-Trade Zone" or to help place stop-losses outside of the immediate area of market noise.
🔵 CONCLUSION
Adaptive Support and Resistance Zones transforms raw price action into an organized, data-driven roadmap. By automating the detection and management of key levels—while accounting for the ever-changing nature of market volatility—it allows traders to focus on execution rather than manual charting. 指标

Key Swing LevelsKey Swing Levels (KSL) plots higher-timeframe reference levels — Weekly High/Low, Monthly High/Low, Previous Day High/Low, Weekly & Monthly Open, and configurable round numbers — on any chart, any timeframe.
A proximity dashboard in the top-right corner shows real-time distance in pips to each level, with cells highlighting red when price comes within range.
Features:
Auto-detects pip size for JPY pairs, other forex, metals, indices, and crypto — no manual configuration
Current week & month levels (solid) and previous week & month levels (dashed) for AMD / SMC analysis
Round number plotting with optional 50-pip half levels
Configurable label offset so levels don't cover forming candles
Built-in alerts when price approaches any major level
How to use:
Use it as a daily/weekly bias map. Levels mark areas where price is likely to react — sweeps, rejections, or breaks. Particularly useful for session-based traders watching for liquidity grabs at PDH/PDL or weekly extremes during London/NY opens.
Open-source. Feedback and forks welcome. 指标

[ A L P H A X ] Structure Flow ProAlphaX Structure Flow Pro — Market Structure Engine, HPZ Order Blocks, Fair Value Gaps, Liquidity Sweeps, Equal Highs/Lows & SMC Confluence Signals
AlphaX Structure Flow Pro is a professional-grade Smart Money Concepts indicator built on a pivot-driven market structure engine that detects swing highs and lows in real time, identifies Market Structure Breaks with momentum Z-score validation and Body-Confirmed Breaks, discovers and scores Order Blocks using a proprietary High Probability Zone algorithm, maps Fair Value Gaps and Liquidity Sweeps as they form, identifies Equal Highs and Lows as liquidity pools, and synthesizes every active condition into a tiered SMC Confluence Score — all displayed on a live dashboard with 15+ alert conditions. Designed for traders who operate within the institutional Smart Money framework on any liquid instrument and timeframe.
━━━━━━━━━━━━━━━━━━━━━━━━━━━━━━━━━━━━━━━━
📸 Visual Overview
Full chart view showing Market Structure swing lines, MSB/BMS labels, HPZ Order Blocks with POC lines, FVG zones, Liquidity Sweep markers, Equal High/Low connections, SMC tiered entry labels, and the live Dashboard panel on XAUUSD
━━━━━━━━━━━━━━━━━━━━━━━━━━━━━━━━━━━━━━━━
🔬 The Market Structure Engine — How It Works
At the core of AlphaX Structure Flow Pro is a real-time pivot-based swing detection system that continuously tracks confirmed swing highs and swing lows using a configurable lookback window. Every confirmed pivot is labeled, connected, and used as the structural reference for all break logic downstream.
Each confirmed pivot produces:
A dotted swing line connecting the current and previous swing high or swing low — a live map of whether price is building higher highs and higher lows, or lower highs and lower lows
Small compact H and L labels at every swing point to mark the structural sequence clearly
From these pivots, the engine monitors two distinct types of structural break — each progressively more powerful than the last:
━━━━━━━━━━━━━━━━━━━━━━━━━━━━━━━━━━━━━━━━
1 ─ Market Structure Break (MSB)
A confirmed close beyond the last tracked swing high or low, validated by a Momentum Z-Score filter . The Z-Score measures how many standard deviations the current bar's price change sits above or below its 50-bar mean. Only breaks where momentum is statistically significant above your configured threshold are accepted — low-conviction wicks, slow grinds, and false closes through structure are automatically ignored.
When a valid MSB fires:
A horizontal line is drawn from the breached pivot to the current bar, anchored at the exact structural level
An MSB ▲ or MSB ▼ label appears at the midpoint of that line
The breached swing level is reset so the engine never double-fires on the same break
━━━━━━━━━━━━━━━━━━━━━━━━━━━━━━━━━━━━━━━━
2 ─ Break of Market Structure (BMS)
A stricter and more powerful structural confirmation. In addition to closing beyond the pivot, BMS requires the breaking candle to have a body-to-range ratio above 50% — the break must be driven by a full-bodied candle, not a wick spike. BMS fires as a compact BMS label when it occurs without a simultaneous MSB, giving you a clear visual distinction between a momentum-confirmed break and a body-confirmed break.
How to read them together:
MSB — momentum is statistically significant but the candle body is below 50% — a valid break, treat it with context
BMS — the candle closed through structure with conviction — higher-probability structural shift
When both fire simultaneously, only the MSB label is shown as it already captures the event
Together, MSB and BMS form the structural backbone from which all Order Block discovery, FVG anchoring, and SMC Confluence scoring is triggered.
━━━━━━━━━━━━━━━━━━━━━━━━━━━━━━━━━━━━━━━━
📦 Order Block Engine with HPZ Scoring
Every Market Structure Break triggers an automatic search backward through the preceding candles to identify the originating Order Block — the last candle moving against the direction of the break before price impulsed away. For a bullish MSB the engine finds the last bearish candle within the lookback window. For a bearish MSB it finds the last bullish candle.
Each discovered Order Block is assigned a Quality Score from 0 to 100 built from four independent factors:
Momentum Strength
The absolute magnitude of the Momentum Z-Score at the time of the MSB. Stronger impulsive moves away from the OB produce higher scores — a zone that launched a 3-sigma move ranks far above one that launched a 0.5-sigma drift.
Volume Percentile
The current bar's volume ranked against its last 100 bars using percentile rank. High-volume structural breaks indicate institutional participation — OBs discovered on high-volume breaks score significantly higher.
Candle Body Ratio
The proportion of the breaking candle that is body versus wick. A full-bodied impulsive candle away from the OB signals conviction. A wick-heavy or indecision candle signals a weaker origin.
OB Size Relative to ATR
The Order Block's height measured against the current 14-period ATR. Compact, well-defined OBs close to 1 ATR score proportionally — excessively large or tiny zones are naturally discounted.
These four factors are combined into the final Quality Score displayed on every OB label. Zones that score above your configured HPZ Threshold (default 75%) are promoted to High Probability Zones ⬡ and rendered with a brighter border and a distinct ⬡HPZ badge — the highest-conviction institutional zones on your chart.
HPZ Order Blocks rendered with enhanced borders and ⬡HPZ badge — standard OBs shown with dimmer styling for instant visual hierarchy
━━━━━━━━━━━━━━━━━━━━━━━━━━━━━━━━━━━━━━━━
Order Block Management
Active Order Blocks are not static — AlphaX Structure Flow Pro manages every zone dynamically bar by bar:
Live extension — every active, unmitigated OB extends its right edge forward to the current bar automatically, keeping your zones current at all times
Point of Control (POC) line — a dashed line at the exact midpoint of every OB, showing the most important price level within the zone
Mitigation detection — when price trades into the OB (low below OB bottom for bullish, high above OB top for bearish), the zone is marked as mitigated and dimmed to neutral gray
Historical mode — mitigated OBs remain visible on the chart dimmed for reference, letting you study how price reacted after mitigation
Present mode — mitigated OBs are deleted automatically, keeping the chart clean with only live unmitigated zones visible
Extend Broken OBs — optionally continue extending mitigated zones for up to 50 bars after mitigation for post-mitigation analysis
Overlap filtering — optionally hide new OBs that overlap existing active zones, preventing zone clustering in congested areas
OB Reliability tracker — the dashboard shows a live percentage of how many total OBs have been mitigated versus left untouched, giving you a real-time measure of how well price is respecting the zones on your current instrument and timeframe
━━━━━━━━━━━━━━━━━━━━━━━━━━━━━━━━━━━━━━━━
📊 Fair Value Gaps (FVG)
AlphaX Structure Flow Pro detects Fair Value Gaps — three-candle imbalances where price moved so fast that the market left an unfilled gap between candle one's high/low and candle three's low/high.
Bullish FVG — candle three's low is above candle one's high — an upward gap in price action that the market may return to fill
Bearish FVG — candle three's high is below candle one's low — a downward gap
A minimum FVG size filter (ATR × your configured factor) prevents micro-gaps from cluttering the chart — only imbalances of meaningful size relative to current volatility are plotted.
Each FVG is drawn as a shaded box that extends forward bar by bar. When price trades back into the gap, the box is marked as filled and dimmed to neutral, stopping its extension. The dashboard tracks how many FVGs remain unfilled at all times, and the SMC Confluence engine uses unfilled FVGs above and below price as draw-on-liquidity targets when scoring entry signals.
━━━━━━━━━━━━━━━━━━━━━━━━━━━━━━━━━━━━━━━━
⚡ Liquidity Sweeps
A Liquidity Sweep is one of the most important Smart Money patterns — institutions engineer price to run stop-loss liquidity beyond obvious highs or lows, then reverse sharply. AlphaX Structure Flow Pro identifies these events in real time.
Bullish Sweep — the candle's low breaks below the lowest low of the recent lookback window but the candle closes back above that level as a bullish close. Stops below recent lows were hunted, liquidity was absorbed, and price reversed upward.
Bearish Sweep — the candle's high breaks above the highest high of the recent lookback window but the candle closes back below that level as a bearish close. Stops above recent highs were hunted.
Each sweep is marked with a compact ⚡ label at the wick extreme. Sweeps feed directly into the SMC Confluence scoring system — a bullish sweep adds 20 points to the Bull SMC Score because it signals smart money accumulation, and a bearish sweep adds 20 points to the Bear SMC Score for the same reason in reverse.
━━━━━━━━━━━━━━━━━━━━━━━━━━━━━━━━━━━━━━━━
〰 Equal Highs and Equal Lows (EQH / EQL)
Equal Highs and Equal Lows are areas where price has printed two swing highs or two swing lows at nearly the same level — these levels represent clusters of resting stop-loss orders and are prime targets for institutional liquidity sweeps.
AlphaX Structure Flow Pro detects EQH and EQL automatically by comparing consecutive confirmed pivots. When two swing highs are within your configured ATR-scaled tolerance of each other, an EQH label and dotted connection line are drawn. When two swing lows match, an EQL label appears.
The ATR-scaled tolerance ensures the detection adapts to current market volatility — what counts as "equal" on a calm Asian session is different from a high-volatility London open, and the indicator adjusts automatically.
Equal Highs and Equal Lows marked with purple dotted lines — clear visual identification of stop-hunt targets above and below current price
━━━━━━━━━━━━━━━━━━━━━━━━━━━━━━━━━━━━━━━━
🧠 SMC Confluence Scoring System
Every signal in AlphaX Structure Flow Pro feeds into a real-time SMC Confluence Engine that evaluates all active conditions simultaneously and produces a score from 0 to 100 for both the bullish and bearish side. Only scores that meet your configured minimum threshold generate a visible entry label — weak, ambiguous, or isolated setups never reach the chart.
Bull SMC Score Factors:
Market Structure Break (30 points) — an MSB bull fires adds 30 points as the core structural trigger. A BMS bull without simultaneous MSB adds 20 points.
Liquidity Sweep (20 points) — a bullish sweep on the current bar adds 20 points — smart money has absorbed sell-side liquidity
Near Bullish HPZ Order Blocks (up to 18 points) — two or more unmitigated bullish HPZ OBs within 2 ATR of price adds 18 points. One HPZ OB nearby adds 10 points.
Bearish FVG Draw on Liquidity (up to 10 points) — two or more unfilled bearish FVGs above price (magnets drawing price upward) adds 10 points. One adds 5 points.
Momentum Z-Score confirmation (up to 12 points) — strong upward momentum (Z > 2.0) adds 12 points. Moderate (Z > 1.0) adds 7. Mild (Z > 0.5) adds 3.
Volume ratio (up to 8 points) — volume spike (×2.0) adds 8, high volume (×1.3) adds 5, above average (×1.0) adds 2
Candle body (up to 6 points) — a bullish close with body ratio above 60% adds 6 points. Any bullish close adds 3.
Penalties — strong downward momentum (Z < −1.0) deducts 10 points. Two or more nearby bearish HPZ OBs deduct 8 points.
Bear SMC Score Factors are the exact mirror of the above, applied in reverse for all bearish conditions.
━━━━━━━━━━━━━━━━━━━━━━━━━━━━━━━━━━━━━━━━
Signal Tiers and Entry Labels
Every signal that clears the minimum SMC score threshold is classified into one of three tiers based on its final score:
S-Tier — score ≥ 70. Maximum confluence. All major factors aligned. The highest-confidence setups the engine produces.
A-Tier — score 55–69. Strong confluence with most major factors present.
B-Tier — score at or above your minimum threshold but below 55. Valid setup with meaningful confluence but fewer confirming factors.
Entry labels appear directly on the chart with the tier and score displayed:
▲ S-SMC (82) — bullish S-tier signal with a score of 82
▼ A-SMC (61) — bearish A-tier signal with a score of 61
Label color intensity reflects the tier — S-tier labels use the brightest bull or bear color, A-tier uses the primary color, B-tier uses the dimmed shade. This gives you instant visual priority — your eyes go to the brightest labels first.
A configurable Signal Cooldown prevents back-to-back signals within a set number of bars, eliminating label spam during fast-moving structural events.
S-tier and A-tier entry labels appearing below bars during bullish SMC confluence — label brightness reflects confidence tier at a glance
━━━━━━━━━━━━━━━━━━━━━━━━━━━━━━━━━━━━━━━━
🗓 Session Ranges
AlphaX Structure Flow Pro includes a full Session Range overlay for the four major trading sessions — London, New York, Tokyo, and Sydney — each independently toggleable with customizable colors and time windows.
Session boxes draw in real time as the session opens, expanding their high and low dynamically as price prints new extremes within the session. The session label updates its position to stay centered above the range. Each session closes when its time window ends, leaving the completed range as a permanent reference box for that period.
Use session ranges to:
Identify the high and low of a session as key liquidity targets for sweeps
Determine whether an MSB or OB formation occurred during a high-liquidity or low-liquidity window
Spot the London or New York open as a structural break origin
━━━━━━━━━━━━━━━━━━━━━━━━━━━━━━━━━━━━━━━━
📊 Live Dashboard
The AlphaX Structure Flow Pro dashboard gives you a complete real-time readout of every active market condition in a compact panel — no need to visually scan the chart for each element individually.
Market Structure section:
MSB STATUS — shows whether a Bull MSB, Bear MSB, or no MSB is active on the current bar
BMS (BODY) — shows whether a body-confirmed structural break is active
MOMENTUM Z — current Z-score reading with direction label (STRONG / MODERATE / MILD / FLAT) and raw value
Order Blocks section:
ACTIVE OBs — total count of unmitigated Order Blocks currently on the chart
HPZ OBs — count of active High Probability Zone OBs, highlighted when any are present
OB RELIABILITY — live percentage of total OBs that have been mitigated since the indicator started tracking — your real-time measure of how well structure is being respected
Liquidity & Imbalance section:
LIQ SWEEP — shows whether a Bull or Bear liquidity sweep is active on the current bar
OPEN FVGs — count of unfilled Fair Value Gaps currently active
DRAW ON LIQ — shows whether price has unfilled FVGs drawing it upward, downward, or on both sides
SMC Confluence section:
BULL SMC SCORE — current bullish confluence score with tier label (S-TIER / A-TIER / B-TIER / LOW)
BEAR SMC SCORE — current bearish confluence score with tier label
HPZ PROXIMITY — shows whether price is near a Bull HPZ zone, Bear HPZ zone, both sides, or neither
Market Conditions section:
VOLUME — current volume classified as SPIKE / HIGH / NORMAL / DRY with the live ×ratio
ATR (14) — current 14-period ATR value in price terms
CANDLE BODY — current candle body ratio classified as STRONG / MODERATE / WEAK with percentage
Active Signal section:
SIGNAL — shows the active entry signal direction and tier, or NONE — the single most important row if you need a quick status check
Dashboard position (Top Left / Top Right / Bottom Left / Bottom Right) and text size (Tiny / Small / Normal / Large) are fully configurable.
━━━━━━━━━━━━━━━━━━━━━━━━━━━━━━━━━━━━━━━━
⚠ Identifying Low-Quality Conditions — When NOT to Trade
Knowing when to stay out is just as important as knowing when to enter. AlphaX Structure Flow Pro gives you clear signals that the market is not in a tradeable condition:
How to identify unfavorable conditions:
No MSB or BMS on the dashboard — if the MSB STATUS row shows NONE, there is no confirmed structural trigger. No structural break means no Order Block discovery, and no SMC signals should be acted on.
Bull and Bear SMC Scores both show LOW — when neither side can build enough confluence to reach even B-tier, the market is either ranging, choppy, or lacking institutional participation. Wait for a clear dominant side to emerge.
OB RELIABILITY is very high (above 80–90%) — when nearly every OB is being quickly mitigated, price is not respecting structure and the market is in a sweep-and-reverse or noise regime. Reduce position size or stand aside.
No SMC entry labels appearing — the confluence engine is running on every bar. If no labels are printing even after MSB events, the filters are doing their job blocking low-quality setups. Do not lower the threshold to force signals — wait for real confluence.
DRAW ON LIQ shows BOTH SIDES — unfilled FVGs above and below simultaneously means price is in the middle of a contested range with equal magnets in both directions. No clean directional edge exists.
MOMENTUM Z reads FLAT on the dashboard — flat momentum at a structural level often means a failed break rather than a true MSB. Treat these events with extra caution.
What to do during unfavorable conditions:
Wait for a clean MSB or BMS to set the directional bias before considering any entry
Look for one dominant side in the SMC Confluence section — both Bull and Bear scores being low simultaneously is a ranging signal
Watch for a liquidity sweep followed immediately by an MSB in the same direction — that sequence is one of the highest-probability SMC setups and will produce a strong confluence score when it fires
Consider switching to a higher timeframe to find cleaner structure — if the current timeframe is printing rapid alternating MSBs, the higher timeframe trend will show you the dominant direction
━━━━━━━━━━━━━━━━━━━━━━━━━━━━━━━━━━━━━━━━
🚀 How to Trade with AlphaX Structure Flow Pro — Step by Step
Step 1 — Read the Dashboard
Check MSB STATUS and BMS — is there a live structural break?
Check Bull and Bear SMC Scores — is one side clearly dominant with a B-tier or higher score?
Check DRAW ON LIQ — are unfilled FVGs pulling price in one clear direction?
If no clear dominant side and no MSB → do not trade. Wait for structure.
Step 2 — Identify the Structural Trigger
An MSB ▲ or BMS bull sets your bullish directional bias
An MSB ▼ or BMS bear sets your bearish directional bias
Do not enter blindly on the MSB label alone — use it to set context, then wait for a tiered SMC signal to confirm
Step 3 — Enter on a Tiered SMC Signal
Wait for a ▲ SMC or ▼ SMC label to appear with a tier of B or higher
Prioritize S-tier and A-tier signals — these have the most factors aligned
Check that an unmitigated HPZ Order Block is nearby in the direction of the trade — HPZ proximity is displayed on the dashboard in real time
Place your stop loss beyond the most recent swing low (for longs) or swing high (for shorts), or just beyond the relevant OB's outer edge
Step 4 — Use FVGs and OBs as Targets and Re-Entry Zones
Unfilled FVGs in the direction of the trade are natural draw-on-liquidity targets — they show you where price is likely being pulled toward
Mitigated OBs (shown dimmed in Historical mode) mark areas where price has already visited and absorbed — useful as reference for prior institutional activity
If price pulls back into an unmitigated bullish OB without triggering a new bearish MSB, that is a potential re-entry zone aligned with the original structural break
Step 5 — Monitor for Structural Invalidation
If an opposing MSB fires after your entry, the structure has shifted — close or reduce your position
If the SMC Score for your trade direction drops to LOW on the dashboard without a new signal, momentum is fading
A liquidity sweep against your position that does not produce a reversal SMC signal is a warning — tighten your stop
Step 6 — Watch for Equal Highs/Lows as Exit Targets
EQH levels above price during a bull trade are natural exit zones — institutions often sweep equal highs as final liquidity grabs before reversal
EQL levels below price during a bear trade serve the same purpose
Consider taking partial profit as price approaches an EQH or EQL level, then hold the remainder for a potential sweep and continuation
━━━━━━━━━━━━━━━━━━━━━━━━━━━━━━━━━━━━━━━━
⚡ Key Features
🔬 Pivot-based market structure engine with configurable swing lookback — tracks confirmed swing highs and lows in real time
📈 MSB detection with Momentum Z-Score validation — filters out low-conviction structural breaks statistically
💪 BMS detection with candle body ratio confirmation — only full-bodied closes through structure qualify
📦 Order Block discovery anchored to every MSB — automatically finds the originating institutional candle
⬡ Proprietary HPZ Quality Score (0–100) — four-factor scoring system promotes the highest-conviction zones to High Probability Zone status
📍 Point of Control line on every Order Block — shows the midpoint of the zone for precision entries
🔄 Dynamic OB management — live extension, mitigation detection, Historical and Present display modes, overlap filtering, and broken OB extension
📊 Fair Value Gap detection with ATR-scaled minimum size filter — bullish and bearish imbalances mapped and tracked until filled
⚡ Liquidity Sweep detection — wick-beyond plus close-inside logic identifies institutional stop hunts in real time
〰 Equal Highs and Equal Lows detection with ATR-scaled tolerance — automatic identification of resting liquidity pools
🧠 Multi-factor SMC Confluence Scoring Engine — synthesizes structure, sweeps, HPZ OBs, FVG draw, momentum, volume, and candle body into a single 0–100 score per side
🏆 Three-tier signal classification — S-Tier (≥70), A-Tier (55–69), B-Tier (threshold to 54) with color-coded label intensity
⏱ Signal cooldown timer — configurable minimum bars between signals to eliminate label spam
✅ Optional volume confirmation filter — require minimum volume ratio before any signal fires
🗓 Four-session range overlay — London, New York, Tokyo, and Sydney each independently toggleable with custom colors and time windows
📋 Live 7-section dashboard — MSB/BMS status, momentum Z, OB counts, HPZ proximity, FVG draw direction, SMC scores, volume, ATR, and active signal — all in one panel
🎨 Fully customizable color theme — 13 configurable colors covering bull, bear, neutral, FVG, sweep, EQL, and dashboard elements
🔔 15+ alert conditions — MSB bull/bear, BMS bull/bear, S/A/B-tier bull signals, S/A/B-tier bear signals, any SMC signal, bull/bear sweeps, bull/bear FVGs, and MSB + HPZ confluence alerts
⚙ Fully configurable — every lookback, threshold, score, toggle, color, and session window adjustable from the settings panel
━━━━━━━━━━━━━━━━━━━━━━━━━━━━━━━━━━━━━━━━
⚙ Settings Reference
Market Structure
Pivot Lookback — bars on each side required to confirm a swing high or low (default: 7, range: 3–21)
MSB Momentum Z-Score — minimum standard deviation threshold for a valid Market Structure Break (default: 0.5)
Show MSB Lines & Labels — toggle visibility of MSB/BMS lines and labels
Show Structure Swings — toggle visibility of swing lines and H/L pivot labels
Detect Break of Market Structure (BMS) — enable or disable body-confirmed structural break detection
Order Blocks
Max Active OBs — maximum number of unmitigated Order Blocks kept on the chart at once (default: 10)
OB Lookback (candles) — how many candles back the engine searches for the originating OB after an MSB (default: 10)
Extend Broken OBs — continue extending mitigated OBs for up to 50 bars after mitigation
Hide Overlapping OBs — skip new OBs that overlap existing active zones
Display Mode — Historical (keep mitigated OBs dimmed) or Present (delete mitigated OBs automatically)
HPZ Threshold Score (%) — minimum quality score required for HPZ promotion (default: 75%)
Show OB Point of Control — toggle the midpoint POC dashed line on Order Blocks
Liquidity & Imbalance
Show Fair Value Gaps — toggle FVG detection and display
Min FVG Size (ATR × factor) — minimum gap size as a multiple of ATR to qualify as a valid FVG (default: 0.05)
Show Liquidity Sweeps — toggle sweep detection and ⚡ markers
Sweep Lookback (bars) — lookback window for determining the recent high/low that is swept (default: 20)
Show Equal Highs / Lows — toggle EQH and EQL detection and display
EQL Tolerance (ATR × factor) — how close two pivots must be to qualify as equal, scaled to ATR (default: 0.1)
Smart Money Confluence (SMC)
Enable SMC Confluence Engine — master toggle for the scoring system and all entry labels
Min SMC Score to Signal — minimum confluence score required to display an entry label (default: 30)
Signal Cooldown (bars) — minimum bars between consecutive signals in the same direction (default: 3)
Require Volume Confirmation — only fire signals when volume ratio meets the minimum threshold
Min Volume Ratio — minimum volume-to-SMA ratio required when volume filter is enabled (default: 0.7)
Sessions
Show Session Ranges — master toggle for the session overlay
London / New York / Tokyo / Sydney — independently toggle each session with configurable time window and color
Dashboard
Show Dashboard — toggle the dashboard panel on or off
Position — Top Left / Top Right / Bottom Left / Bottom Right
Size — Tiny / Small / Normal / Large
Appearance
Label Size — controls the size of all MSB, BMS, sweep, EQH/EQL, and entry labels (Tiny / Small / Normal)
Colors
Bull Primary / Bright / Dim — three shades of the bullish color family for OBs, labels, and signals
Bear Primary / Bright / Dim — three shades of the bearish color family
Neutral / Neutral Light — colors for mitigated zones and inactive states
Text Light — color for dashboard row labels
Dashboard Background — background color of the dashboard panel
FVG Bull / Bear Color — colors for bullish and bearish Fair Value Gap zones
Liquidity Sweep Color — color for sweep ⚡ labels
Equal Hi/Lo Color — color for EQH and EQL lines and labels
━━━━━━━━━━━━━━━━━━━━━━━━━━━━━━━━━━━━━━━━
🔔 Alert Conditions
Bull Market Structure Break — fires on every bullish MSB
Bear Market Structure Break — fires on every bearish MSB
Bull Break of Market Structure (Body Close) — fires on every bullish BMS
Bear Break of Market Structure (Body Close) — fires on every bearish BMS
S-Tier Bull SMC Signal — bullish signal with score ≥ 70
A-Tier Bull SMC Signal — bullish signal with score 55–69
B-Tier Bull SMC Signal — bullish signal below 55 but above minimum threshold
S-Tier Bear SMC Signal — bearish signal with score ≥ 70
A-Tier Bear SMC Signal — bearish signal with score 55–69
B-Tier Bear SMC Signal — bearish signal below 55 but above minimum threshold
Any SMC Signal — fires on any bullish or bearish signal regardless of tier
Bull Liquidity Sweep — wick below recent lows with bullish close
Bear Liquidity Sweep — wick above recent highs with bearish close
Bullish Fair Value Gap — new bullish FVG formed
Bearish Fair Value Gap — new bearish FVG formed
Bull MSB + HPZ Confluence — bullish MSB with at least one nearby unmitigated HPZ OB
Bear MSB + HPZ Confluence — bearish MSB with at least one nearby unmitigated HPZ OB
All alert messages include {{ticker}} and {{interval}} placeholders for clean webhook and bot integration.
━━━━━━━━━━━━━━━━━━━━━━━━━━━━━━━━━━━━━━━━
🎯 Recommended Settings by Use Case
The default configuration is tuned for intraday trading on liquid instruments including XAUUSD, forex majors, and indices on M1 to M15 timeframes.
For tighter, higher-conviction signals:
Increase Min SMC Score to 45–55 — only S-tier and strong A-tier setups fire
Enable Require Volume Confirmation and set Min Volume Ratio to 1.0–1.3
Increase Pivot Lookback to 9–12 for larger, more significant swing points
Set HPZ Threshold to 80% to tighten HPZ qualification
For more signals and aggressive scalping:
Reduce Min SMC Score to 20–25
Reduce Signal Cooldown to 1–2 bars
Reduce Pivot Lookback to 3–5 for faster swing detection
Keep Volume Confirmation off
For higher timeframes (H1, H4, Daily):
Increase Pivot Lookback to 10–15
Increase OB Lookback to 15–20
Increase Min SMC Score to 40–50
Increase Sweep Lookback to 30–50
For ranging or news-driven markets:
Enable Hide Overlapping OBs to reduce zone clutter
Switch Display Mode to Present to keep only live zones visible
Monitor DRAW ON LIQ on the dashboard — if both sides show FVGs, avoid directional trades
━━━━━━━━━━━━━━━━━━━━━━━━━━━━━━━━━━━━━━━━
👥 Who This Is For
🥇 Smart Money Concepts traders — built specifically around the MSB → OB → FVG → Sweep framework that institutional-style traders use
📉 Forex and Gold traders — fully applicable to XAUUSD, forex majors and minors, and all liquid currency pairs
📊 Index traders — works on US30, NAS100, SPX500, DAX, and all major equity indices
🧠 Systematic and rule-based traders — the confluence scoring system provides a quantitative, objective framework rather than purely subjective visual reads
📈 Traders who want one complete SMC system — structure, OBs, FVGs, sweeps, EQH/EQL, sessions, scoring, and dashboard in a single indicator rather than layering five separate tools
⚠ Traders who struggle with overtrading — the minimum score filter, cooldown, and volume gate physically prevent low-quality signals from reaching the chart
🔔 Alert-driven traders and bot operators — 17 alert conditions with clean webhook-ready message formatting cover every meaningful event the indicator can detect
━━━━━━━━━━━━━━━━━━━━━━━━━━━━━━━━━━━━━━━━
📝 Notes
Session range features use the time zone of each configured session string — set your London and New York session times to match your chart's time zone if ranges appear offset
The Momentum Z-Score is calculated over a 50-bar rolling window — on very short histories or immediately after a chart loads, early bars may have lower Z-Score values until the window fills
OB Reliability percentage starts from zero when the indicator first loads and builds over time as OBs are discovered and mitigated — it is most meaningful after a full session of price action
The SMC Confluence Engine evaluates conditions on bar close — all signals are non-repainting and confirmed on the closed bar
With max_boxes_count, max_lines_count, and max_labels_count each set to 500 and max_bars_back at 500, on very low timeframes with extended chart history the oldest visual elements may be automatically removed by TradingView's rendering limits — this is a platform constraint, not an indicator limitation
The HPZ proximity check uses a 2 ATR radius around the current close price — zones further away than 2 ATR are not counted in the SMC score even if they are unmitigated and visible on the chart
━━━━━━━━━━━━━━━━━━━━━━━━━━━━━━━━━━━━━━━━
⚠ Disclaimer
This indicator is a technical analysis and visualization tool intended for educational and informational purposes only. It does not constitute financial advice or a recommendation to buy or sell any financial instrument. All signals are generated from historical and real-time price data using mathematical calculations — their accuracy or profitability is not guaranteed. Past performance of any signal type does not guarantee future results. Always conduct your own analysis, use proper risk management, and consult a licensed financial advisor before making any trading decisions. The author accepts no responsibility for any losses incurred from the use of this indicator.
━━━━━━━━━━━━━━━━━━━━━━━━━━━━━━━━━━━━━━━━
Built for traders who demand structure, confluence, and precision from their Smart Money analysis. 指标

Triangle Breakout Quality [AGPro Series]Triangle Breakout Quality
🔺 OVERVIEW
Triangle Breakout Quality is built for one of the most searched and visually recognizable chart structures in technical analysis: the triangle breakout.
The script automatically detects triangle candidates from confirmed pivot highs and pivot lows, projects the upper and lower converging boundaries, measures how much the structure has compressed, locates the projected apex, and grades the quality of the eventual breakout. After the release, it monitors the first return toward the broken triangle boundary so the user can see whether price accepted the breakout or quickly lost structural quality.
The goal is not to mark every small consolidation or every trendline touch. The goal is to isolate the full triangle sequence:
Formation -> compression -> apex pressure -> boundary release -> first retest state.
That full lifecycle is what gives the tool its own identity. A triangle is not just a range, not just a single diagonal line, and not just a breakout candle. It is a narrowing structure where both sides of price are being compressed into a decision point. This script is designed around that idea from the ground up.
🔹 WHAT MAKES IT DIFFERENT
Most triangle tools stop at drawing two lines. Most breakout tools stop at the first candle outside a boundary. Triangle Breakout Quality does more by turning the structure into a scored, state-aware workflow.
Core differentiators:
• Dual-boundary validation
The script requires both an upper pivot boundary and a lower pivot boundary. The two lines must converge. This prevents the logic from acting like a generic trendline-break detector.
• Compression measurement
The engine compares the opening width of the triangle with the current width. A pattern must show meaningful narrowing before it can qualify.
• Apex pressure logic
The script projects where the upper and lower boundaries intersect and evaluates whether the current structure is close enough to that decision zone to matter.
• Breakout quality score
Every displayed breakout receives a 0-100 score based on compression, apex pressure, breakout distance, candle body participation, close quality, and optional volume expansion.
• Retest state
After a breakout, the script watches the first return toward the broken triangle boundary. A held retest and a failed retest are visually different states, not the same event.
• Premium visual restraint
The chart shows active triangle lines, controlled breakout labels, optional retest labels, subtle candle tint, and a compact AGPro panel. Label density is capped so the layout stays clean for live use and publication screenshots.
🧭 WHY THIS DOES NOT OVERLAP WITH OTHER AGPRO TOOLS
This script is intentionally separated from the existing AGPro breakout and structure family.
It is not Break-Retest Quality, because it does not begin with a horizontal pivot break and then grade the first retest of that static level. Triangle Breakout Quality first requires a valid converging triangle structure.
It is not Failed Break Quality, because it is not centered on false breaks and reclaim behavior. It tracks the primary breakout from a valid triangle and then monitors the first boundary retest.
It is not Consolidation Breakout Quality, because the reference structure is not a horizontal range. A triangle must have two projected pivot boundaries that move toward each other.
It is not Donchian Breakout Quality, because it is not based on period highs and lows or channel escape logic.
It is not ATR Envelope Breakout Quality, because it does not use a volatility envelope as the breakout shell.
It is not Auto Trendline Break Quality, because it does not score isolated trendline breaks. The event only matters when the upper and lower lines together form a valid triangle compression structure.
That distinction matters visually and analytically. On the chart, this script tells a triangle story: converging boundaries, apex pressure, breakout quality, and retest state. It belongs in the chart-pattern lane, not the generic breakout lane.
⚙️ METHODOLOGY
1. Pivot anchors
The script uses confirmed pivot highs and pivot lows to define the latest upper and lower triangle boundaries. This keeps the structure rules transparent and reproducible.
2. Convergence filter
The upper boundary and lower boundary must move toward each other. The current width of the pattern must be smaller than the starting width, and the compression percentage must meet the selected threshold.
3. Width and maturity filters
The pattern must be old enough to represent a real structure, but not so old that it becomes stale. The starting width and current width are also normalized by ATR so the same logic can adapt across symbols and timeframes.
4. Apex projection
The script calculates where the two projected boundaries intersect. This creates the apex pressure layer, which helps separate mature triangle compression from loose diagonal movement.
5. Breakout confirmation
A bullish breakout requires price to close beyond the projected upper boundary by an ATR-normalized buffer. A bearish breakout requires price to close beyond the projected lower boundary by the same type of buffer.
6. Quality score
The breakout score combines:
• Compression quality
• Apex pressure
• Breakout distance beyond the boundary
• Candle body participation
• Close position inside the breakout candle
• Optional volume participation
The result is displayed as a compact grade and score so the chart remains readable.
7. Retest state
After a breakout, the script projects the broken triangle boundary forward internally and evaluates an ATR-scaled retest tolerance around it. If price revisits that boundary area and holds the correct side, the retest is marked as held. If price loses the boundary, the retest state is marked as failed.
📊 PANEL
The AGPro panel summarizes the current structure and latest event:
• Pattern Age
• Compression
• Apex Pressure
• Breakout Side
• Retest Quality
• Current State
Panel location, theme, and font size are adjustable. The first row follows the AGPro publication standard: one merged blue header row containing only the panel title.
🎛️ KEY INPUTS
Triangle Structure
• Pivot Length
• Minimum Pattern Age
• Maximum Pattern Age
• Minimum Compression %
• Minimum Starting Width ATR
• Maximum Current Width ATR
• Maximum Forward Apex Bars
Breakout Quality
• ATR Length
• Volume Average Length
• Use Volume Participation
• Volume Full-Score Ratio
• Minimum Break Distance ATR
• High Quality Threshold
• Minimum Label Score
• Visual Cooldown Bars
Retest State
• Retest Minimum Bars
• Retest Window Bars
• Retest Tolerance ATR
Visual Controls
• Show Triangle Lines
• Show Breakout Labels
• Show Retest Labels
• Tint Breakout Candles
• Label Offset ATR
• Label Font Size
• Maximum Visible Events
Panel
• Show Panel
• Panel Position
• Panel Theme
• Panel Font Size
🔍 HOW TO READ IT
When a valid triangle is forming, the chart displays the converging upper and lower boundaries. The panel reports apex pressure and compression so the projected decision area is visible without adding extra rectangles to the chart. Compression shows how much the pattern has tightened relative to its opening width.
When price closes beyond a valid boundary, the script prints a compact breakout label with a quality grade and score. A higher score means the breakout candle carried stronger structural qualities according to the script's rules.
After the breakout, retest labels and the panel show whether the first return toward the broken triangle boundary held or failed. A held retest suggests cleaner acceptance of the breakout boundary. A failed retest suggests the release lost quality.
Use the tool as a structured chart-reading layer. It is designed to help users compare triangle breakouts by quality, not to replace broader context such as trend, liquidity, session behavior, or personal execution rules.
🧩 BEST USE CASES
• Symmetrical triangle compression
• Ascending triangle pressure
• Descending triangle pressure
• Breakout candle quality review
• First retest monitoring after triangle release
• Screenshot-friendly pattern study
• Multi-symbol scanning for cleaner chart-pattern candidates
🔹 LIMITATIONS AND TRANSPARENCY
Triangle detection is based on confirmed pivots, so the final anchor points appear only after the selected pivot length has elapsed. This is standard pivot behavior and keeps the structure rules visible.
The live triangle can change while new pivots form. Breakout and retest labels are event-based and are designed to remain stable after confirmation.
Volume participation is optional because volume quality varies across markets and feeds. On instruments where volume is less informative, the volume component can be disabled.
The score is a structured description of the triangle release according to the script's internal model. It should be read as context, not as an execution command.
指标

NY Engulfing StrategyThis backtesting indicator is a rule-based trend strategy designed to identify high-probability engulfing setups during the New York session while enforcing strict trade filters to improve consistency. It combines a moving average for trend direction (with optional slope confirmation), engulfing candle logic based on candle bodies (with optional two-candle patterns), and an optional proximity filter to ensure entries occur near the moving average. Trades are only allowed within a defined session window (default 9:40 AM–4:45 PM EST), with limits on the number of trades per day and optional rules like stopping after the first win or forcing a close at 4:55 PM. The indicator simulates trade outcomes using fixed SL/TP values (with manual inputs always overriding presets), tracks performance over a customizable lookback period, and displays key metrics such as win rate, drawdown, profit percentage, average R per day, streaks, and counts of strong performance days (3 win days and 3 loss days). It also includes intrabar “sticky” entry logic so signals are preserved once price touches an entry level during a candle, providing more realistic backtesting results. 指标

Fibonacci Pivot Levels (KenshinC)══════════════════════════════════════════════════════════════════════════════
FIBONACCI PIVOT LEVELS (KenshinC)
══════════════════════════════════════════════════════════════════════════════
A powerful technical tool that merges classic Pivot Points with Fibonacci ratios
to reveal high-probability support and resistance zones.
By calculating the central Pivot Point (P) from the Highest, Lowest, and Close
prices over your selected period, the indicator automatically projects 10 custom
Fibonacci levels both above and below the pivot — creating clear, precise
horizontal levels that often act as strong price magnets.
Perfect for swing trading, day trading, breakout strategies, and spotting
potential reversals across Forex, Stocks, Crypto, and Commodities.
✨ Additional Feature:
Includes an advanced RSI Predictor that forecasts potential overbought and
oversold zones ahead of time, helping you anticipate momentum shifts.
══════════════════════════════════════════════════════════════════════════════
HOW TO USE
══════════════════════════════════════════════════════════════════════════════
1. Settings Overview
• Start Date & End Date : Choose the period to calculate High, Low & Close
• Use Close Value of End Date? : Use actual close or enter custom value
• Decimal Places : Display precision for price labels
• Fibonacci Rates (1–10) : Customize the 10 Fibonacci ratios
• Show RSI Calculations? : Enable/disable the RSI Predictor lines
2. Understanding the Levels
• P → Central Pivot Point (Black, bold line)
• S1–S10 → Support Levels (Red)
• R1–R10 → Resistance Levels (Green)
Formula:
Pivot (P) = (Highest + Lowest + Close) / 3
Support = P - (Fib Rate × Range)
Resistance = P + (Fib Rate × Range)
3. Information Table
Displays key data in the top-right corner:
- Start & End Date
- Highest & Lowest prices
- Close value used
- Data status
4. RSI Predictor
Plots forward-looking support & resistance based on RSI (length 8, 16, 24)
with customizable overbought/oversold thresholds.
══════════════════════════════════════════════════════════════════════════════
TRADING TIPS
══════════════════════════════════════════════════════════════════════════════
• Price above P → Generally bullish bias (focus on Support levels)
• Price below P → Generally bearish bias (focus on Resistance levels)
• Higher ratios (1.618, 2.000, 2.618, 3.000) often act as major turning zones
• Combine with candlestick patterns or volume for stronger confluences
══════════════════════════════════════════════════════════════════════════════
IMPORTANT DISCLAIMER
══════════════════════════════════════════════════════════════════════════════
This indicator is for educational and informational purposes only.
It is NOT financial advice, investment advice, or a recommendation to buy,
sell, or hold any securities or assets.
Trading involves substantial risk of loss and is not suitable for everyone.
Past performance does not guarantee future results.
Always conduct your own research and consult with a qualified financial advisor
before making any trading or investment decisions.
Use this tool at your own risk.
Created with passion by KenshinC 指标

指标

指标

指标

指标

指标

HH Indicator - ASX Staples, Utilities, CommunicationsASX Staples / Utilities / Comms Sector HH Indicator
Purpose
This indicator identifies when a stock closes above a previous pivot high. It can be used on any time frame.
How it calculates levels:
1. Last pivot high: The last "Pivot High" is identified when a candle is higher than (or equal to) the three candles before it and the three candles after it. This filters out non-significant peaks, but can also give false signals for peaks that are in sideways markets.
2. Price level to break: To determine the price that must be broken to make a new HH, the script takes the top of the candle body (i.e. the higher of the Open or Close) and ignores wicks.
Reading the Table:
A "NEW HH" signal triggers in the indicator if the current candle closes above (or during trade, is above) the previously identified pivot high.
Quirks
1. Identifying a new HH for the 2nd time (when it isn't actually a new HH)
The indicator gives a "NEW HH" signal for a second time is if the stock closes back below the previous pivot high and then breaks out again on a later candle.
In the script, the "memory" isn't stored in a database; it’s just the math comparing Bar A to Bar B. If Bar A is under and Bar B is over, the green box turns on. If both are over, the "cross" didn't happen today, so the box stays gray.
2. Confirmation lag for new pivot highs
Because the script is waiting for 3 lower closes to mark a new pivot, there can be a delay in recording new pivot highs 指标

指标