指标

Risk Manager [SkaleHub]Overview
The ultimate capital preservation tool. This indicator calculates mathematically secure stop-loss placements based on real-time market volatility (ATR) and features a dynamic dashboard that tells you the exact position size to take to protect your account.
The Edge
Amateurs blow accounts by guessing their lot sizes and placing arbitrary stop-losses. This tool professionalizes your risk. By adjusting your position size relative to the asset's current volatility, it ensures that whether you are trading a quiet forex pair or a volatile crypto asset, your monetary risk remains an exact, controlled percentage of your capital.
Key Features:
Volatility-Based Stops: Automatically calculates stop-loss levels using the Average True Range (ATR), ensuring your stop is safely tucked behind the market's natural "noise" to prevent early liquidations.
Auto-Position Sizing: Input your account balance and risk tolerance (e.g., 1%), and the built-in dashboard instantly outputs the exact number of shares or units you should buy.
On-Chart Visual Guardrails: Optionally plots dynamic crosshair lines on the chart so you can visually see exactly where your mathematically optimized stop-loss should be placed before entering a trade.
How to Use
Apply the indicator and open the settings menu. Enter your total account balance and your strict risk percentage (1-2% is highly recommended).
When your Level 3 Momentum Trigger fires an entry signal, look at the Risk Manager dashboard in the corner of your screen.
Execute the trade using the exact "Position Size (Units)" displayed on the dashboard, and immediately set your hard stop-loss at the "Stop Distance" mapped out on the chart.
Author's Note
This is a premium, Invite-Only script. It is Level 4 of the SkaleHub Training System. To gain access, your TradingView username must be explicitly authorized through the SkaleHub Academy. 指标

Xander Scalping Strategy [Price Action + Confirmation]🚀 Xander Scalping Strategy
by @wijayanto_ok
A multi-confirmation scalping strategy combining trend filtering, dynamic support/resistance, Stochastic RSI momentum, and volume confirmation — with visual Risk/Reward estimation for disciplined trading.
================================================================================
📌 OVERVIEW
================================================================================
Xander Scalping Strategy is a Price Action-based trading tool designed for traders who prioritize high-probability, multi-layer confirmation before entry. It helps identify:
✅ Trend Direction using EMA 13/21 crossover
✅ Dynamic Support & Resistance from confirmed swing highs/lows
✅ Precision Entry Signals via Stochastic RSI + Volume spike confirmation
✅ Visual Risk/Reward Estimator for smarter position management
🎯 Best For: Timeframes 5m – 1H | Liquid assets (Forex majors, BTC/ETH, Indices)
================================================================================
✨ KEY FEATURES
================================================================================
🔹 1. Trend Filter (EMA 13/21)
---------------------------------
• Fast EMA (13) & Slow EMA (21) with dynamic coloring:
🟢 Green = Uptrend | 🔴 Red = Downtrend | ⚪ Gray = Sideways
• Real-time trend label in top-right corner for quick reference
🔹 2. Dynamic Support & Resistance
---------------------------------
• Auto-detects Swing High/Low using ta.pivothigh() / ta.pivotlow()
• Horizontal S/R lines extended to the right (real-time visualization)
• Updates automatically when new swings are confirmed
⚠️ Note: 1-candle lag for pivot confirmation = non-repainting logic
🔹 3. Multi-Layer Entry Confirmation
---------------------------------
Component | Settings | Purpose
-------------------|---------------------------------------|---------------------------
Stochastic RSI | RSI Len: 14, %K: 3, %D: 3, OB: 80, OS: 20 | Momentum timing & reversal signals
Volume Filter | Avg Volume (20-period) | Filters low-liquidity false signals
Price Action | Pullback to EMA zone OR bounce/reject at S/R | Confirms structural alignment
✅ BUY Signal Conditions:
1. Uptrend (EMA 13 > EMA 21)
2. Price pulls back to EMA zone OR bounces from Support
3. StochRSI crosses UP from Oversold (<20)
4. Volume > 20-period average
→ Green "BUY" arrow appears below candle
✅ SELL Signal Conditions:
1. Downtrend (EMA 13 < EMA 21)
2. Price pulls back to EMA zone OR rejects from Resistance
3. StochRSI crosses DOWN from Overbought (>80)
4. Volume > 20-period average
→ Red "SELL" arrow appears above candle
🔹 4. Visual Risk/Reward Table (Top-Right)
---------------------------------
Metric | Description
----------|--------------------------------------------------
Status | Current trend or active signal (LONG/SHORT/UPTREND/DOWNTREND)
Est. RR | Estimated Risk:Reward ratio based on latest swing levels
💡 Tip: Use RR ≥ 1:1.5 as an additional filter for higher-quality entries.
🔹 5. Alert System
---------------------------------
• 🔔 "Xander Buy Signal" — Triggered when all BUY conditions met
• 🔔 "Xander Sell Signal" — Triggered when all SELL conditions met
• Compatible with TradingView alerts (popup, email, webhook, SMS)
================================================================================
⚙️ HOW TO USE
================================================================================
🔧 Setup:
1. Apply script to chart with timeframe 5m, 15m, or 1H
2. Recommended assets:
• Forex: EURUSD, GBPUSD, USDJPY
• Crypto: BTCUSDT, ETHUSDT
• Indices: US30, NAS100, SPX500
🎯 LONG Entry Setup:
1. Confirm "UPTREND 🟢" label is visible
2. Wait for pullback to EMA 13-21 zone OR bounce from green Support line
3. Confirm: Green BUY arrow appears + candle closes bullish
4. StochRSI: Crosses up from <20 zone
5. Volume: Bar higher than 20-period average
📍 Stop Loss: Below nearest lastSwingLow
🎯 Take Profit: Nearest lastSwingHigh OR RR target ≥1:1.5
🎯 SHORT Entry Setup:
1. Confirm "DOWNTREND 🔴" label is visible
2. Wait for pullback to EMA 13-21 zone OR rejection from red Resistance line
3. Confirm: Red SELL arrow appears + candle closes bearish
4. StochRSI: Crosses down from >80 zone
5. Volume: Bar higher than 20-period average
📍 Stop Loss: Above nearest lastSwingHigh
🎯 Take Profit: Nearest lastSwingLow OR RR target ≥1:1.5
⚠️ Recommended Filters:
❌ Avoid trading when label shows "SIDEWAYS ⚪"
❌ Skip signals with Est. RR < 1:1
❌ Avoid entries 5 min before/after high-impact news events
✅ Always confirm with candlestick patterns (pinbar, engulfing, etc.)
================================================================================
🔍 TECHNICAL NOTES (Advanced Users)
================================================================================
📐 Pivot Detection (Non-Repainting):
ph = ta.pivothigh(high, lookbackPeriod, lookbackPeriod)
pl = ta.pivotlow(low, lookbackPeriod, lookbackPeriod)
• Requires rightBars = lookbackPeriod for confirmation → NO REPAINTING
• New swing confirmed only after N candles close to the right
• Recommended: lookbackPeriod = 50 for significant swings; 20-30 for responsive signals
📊 Stochastic RSI Calculation:
rsiSource = ta.rsi(close, 14)
stoch = (rsiSource - lowestRSI) / (highestRSI - lowestRSI) * 100
%K = ta.sma(stoch, 3), %D = ta.sma(%K, 3)
• Measures relative momentum within 0–100 range
• Crosses at extremes (20/80) offer high-probability reversal signals
📈 Risk/Reward Estimation:
// For BUY:
risk = close - lastSwingLow
reward = lastSwingHigh - close
RR = reward / risk
• Uses latest confirmed swing levels as reference for SL/TP
⚠️ Estimates only — always adjust to real-time market structure
================================================================================
⚠️ DISCLAIMER & RISK WARNING
================================================================================
🚨 IMPORTANT: This script is an analytical tool only. It does NOT guarantee profits or replace sound trading judgment.
1. Backtest First: Test in demo mode for 2–4 weeks before live trading.
2. No Holy Grail: No strategy wins 100%. Manage expectations and use strict money management.
3. Market Conditions: Performs best in trending markets. May underperform in extreme sideways or news-driven volatility.
4. Non-Repainting: Signals appear only after candle close and pivot confirmation. Minor 1-candle lag on swing detection is intentional for reliability.
5. Always Use Stop Loss: Never trade without predefined risk protection.
🔹 Trading forex, crypto, and derivatives carries substantial risk of loss. Trade only with capital you can afford to lose.
================================================================================
🔄 VERSION HISTORY
================================================================================
Version | Date | Changes
--------|------------|--------------------------------------------------
1.0 | May 2026 | Initial release: EMA + S/R + StochRSI + Volume + RR Table
================================================================================
💬 FEEDBACK & SUPPORT
================================================================================
• 🛠 Found a bug? Report with screenshot + timeframe + asset for faster resolution.
• 💡 Have an improvement idea? Comment below or DM @wijayanto_ok.
• 🌟 Enjoying the script? A like/follow helps support future updates!
"Plan your trade, trade your plan. Consistency > Perfection."
— Xander Scalping Philosophy
================================================================================
🔖 TAGS (For Search Optimization)
================================================================================
scalping, price-action, ema, support-resistance, stochastic-rsi, volume, risk-reward, swing-trading, confirmation, non-repainting, tradingview, pine-script
================================================================================
✅ PRE-PUBLISH CHECKLIST
================================================================================
Tested on 3+ assets & timeframes
All inputs have sensible defaults
Code is well-commented & structured
Risk disclaimer included
Alert conditions defined
No unwanted repainting logic
Documentation complete & professional
================================================================================
🙏 Thank you for using Xander Scalping Strategy!
Happy trading, and may your RR always be in your favor. 🎯📈
================================================================================ 指标

指标

指标
指标

指标

指标
指标

指标

指标

指标

指标

指标

指标
EPS+Sales+Net Profit+MCap+Sector & Industry📄 Full Description
This script displays a comprehensive financial data panel directly on your TradingView chart, helping long-term investors and swing traders make informed decisions based on fundamental trends. It consolidates key financial metrics and business classification data into a single, visually clear table.
🔍 Key Features:
🧾 Financial Metrics (Auto-Fetched via request.financial):
EPS (Earnings Per Share) – Displayed with trend direction (QoQ or YoY).
Sales / Revenue – In ₹ Crores (for Indian stocks), trend change also included.
Net Profit – Also in ₹ Crores, along with percentage change.
Market Cap – Automatically calculated using outstanding shares × price, shown in ₹ Cr.
Free Float Market Cap – Based on float shares × price, also in ₹ Cr.
🏷️ Sector & Industry Info:
Automatically identifies and displays the Sector and Industry of the stock using syminfo.sector and syminfo.industry.
Displayed inline with metrics, making it easy to know what business the stock belongs to.
📊 Table View:
Compact and responsive table shown on your chart.
Columns: Date | EPS | QoQ | Sales | QoQ | Net Profit | QoQ | Metrics
Metrics column dynamically shows:
Market Cap
Free Float
Sector (Row 4)
Industry (Row 5)
🌗 Appearance:
Supports Dark Mode and Mini Mode toggle.
You can also customize:
Number of data points (last 4+ quarters or years)
Table position and size
🎯 Use Case:
This script is ideal for:
Fundamental-focused traders who use EPS/Sales trends to identify momentum.
Swing traders who combine price action with fundamental tailwinds.
Portfolio builders who want to see sector/industry alignment quickly.
It works best with fundamentally sound stocks where earnings and profitability are a major factor in price movements.
✅ Important Notes:
Script uses request.financial which only works with supported symbols (mostly stocks).
Market Cap and Free Float are calculated in ₹ Crores.
All financial values are rounded and formatted for readability (e.g., 1,234 Cr).
🙏 Credits:
Developed and published by Sameer Thorappa
Built with a clean, minimalist approach for high readability and functionality.
指标

Metatrader CalculatorThe “ Metatrader Calculator ” indicator calculates the position size, risk, and potential gain of a trade, taking into account the account balance, risk percentage, entry price, stop loss price, and risk/reward ratio. It supports the XAUUSD, XAGUSD, and BTCUSD pairs, automatically calculating the position size (in lots) based on these parameters. The calculation is displayed in a table on the chart, showing the lot size, loss in dollars, and potential gain based on the defined risk. 指标

指标
Financial GrowthThis indicator will acquire the financial data provided by Tradview.
the data is compare between Quarter, Annual and TTM in term of percent of growth.
YoY, QoQ and CAGR is also available by this script (The minimum is 4).
in addition, ploting of data, label and table also available (you can check the mark to toggle on / off).
Data : Revenue, Net Income, EBITDA, EPS, DVPS, Free Cash Flow and Forward PE .
How to use it.
just select the financial data, period and size of data to compare.
you can check the box to toggle the plotting line, label and table.
Enjoy. 指标

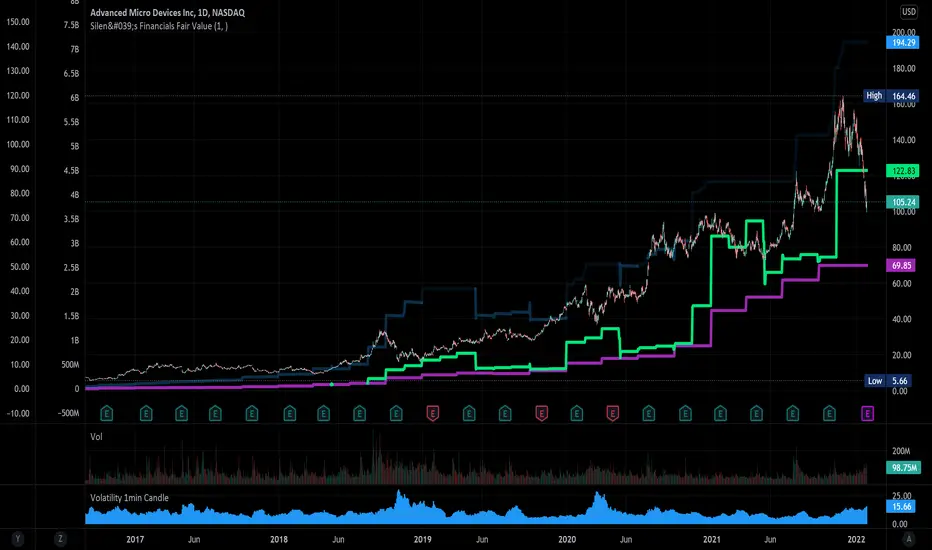
Silen's Financials Fair ValueIt is finally here! 🔥 My 3rd and most important script in my Financial series! 🚀
Ever imagined to see all fundamentals (or many that is) combined into one indicator that is right on your chart, showing you how your favorite stock is trading compared to its fundamentals?
Well, here is your answer! 📡
____________________________________________________________________________________________
This script shows you my own personal interpretation of fair value, based solely on the financial fundamentals of a company compared to market averages.
I don't believe that certain sectors of the market should be priced higher than others. If you look at historical data you'll see that favored sectors always rotate - placing insanely high P/E multiples on some sectors. Once they are "out" and people rotate away from those sectors you're left with nothing but the naked fundamentals that matter. So, you'll see many companies, that have been doing well on paper, see their share price decline by 70-90% for no other reasons than people favoring other sectors.
That's why it's even more important to focus on fair value that is solely fundamentals-based. Know when your stock gets to expensive. 🤯
____________________________________________________________________________________________
To give you some examples:
- Most Megacaps trade at historically high valuations, several times my fair value. Those include AAPL, MSFT, NVDA, AMZN, TSLA, JPM, TSM, V and so on. And no, in the past they partially traded below (my) fair value.
- Most Cybersecurity / Cloud companies are trading at truly massive multiples of my fair value. (NET, DDOG, etc)
- Many Smallcaps & Midcaps are trading several multiples (OESX, CODX, QFIN) below my fair value. And no, in the past they partially traded above (my) fair value.
Ok, so much about the market. You ultimately decide how much you want to orientate on fair value. 👨🏫
____________________________________________________________________________________________
This fair value indicator (purple line):
Takes the P/E rate of the company and compares it to the market (50% weight)
Takes the P/S rate of the company and compares it to the market (50% weight)
Then adds boni and mali f or debt/equity rates and debt and equity itself
Also looks at past growth and calculates future P/E and P/S rates which adds , in some cases, value to the fair value (green line)
Also compares how historical valuations have behaved compared to fair value and simulates a fair value guideline (dark blue line)
____________________________________________________________________________________________
This script is part 3️⃣ of a series of indicators that work well together.
Script 1️⃣ of the series is:
P/E & P/S Rates
Script 2️⃣ of the series is:
Debt & Equity
If you use all 3 scripts together it will look like this, giving you truly deep and simple information about the fundamentals of a company:
Example 1 - AMD
Example 2 - HZO
Example 3 - APPS
I hope this script makes your investing and stock picks a lot easier! 🔆💹🕗
Disclaimer: Fair value is always subjective. There are many different approaches to fair value. This one is only my personal interpretation.
Disclaimer 2: This script works only for the Day-Timeframe.
Disclaimer 3: This script uses 17,5 P/E and 3,0 P/S as market averages. The actual average keeps changing but, historically speaking, these seemed to be good numbers.
Feel free to share your thoughts and feedback! 🙃
指标

FX Profit CalculatorWith this indicator, you will be able to see how much you earn in forex in dollar terms.
It asks you 3 things when adding the indicator.
TP point
SL point
Position Entry point
If you have selected the TP point above, the entry zone below it, and the SL point below it, the indicator will automatically understand that there is a BUY order and will make the calculations accordingly.
The same is true for the opposite.
When you use the indicator in any parity, you will have problems switching to other parities.
So either use it only in one parity, or update your targets from the indicator settings at every parity change.
You will get the same error if:
Your trading entry point should be between your TP and SL points. If you do not set it this way, the indicator will warn that please fix it.
If you are in the trade, tick the settings and show the dollar-based profit of your position according to the instant closing price.
The percentage variable works like this:
When you adjust for one parity, shifts occur in the chart when you switch to the other parity. When switching to non-circulating graphics at the same prices, the user is prompted to re-enter so that the graphic does not deteriorate.
BONUS : You can move these lines up and down with your mouse on the graphic :)
指标

指标

指标