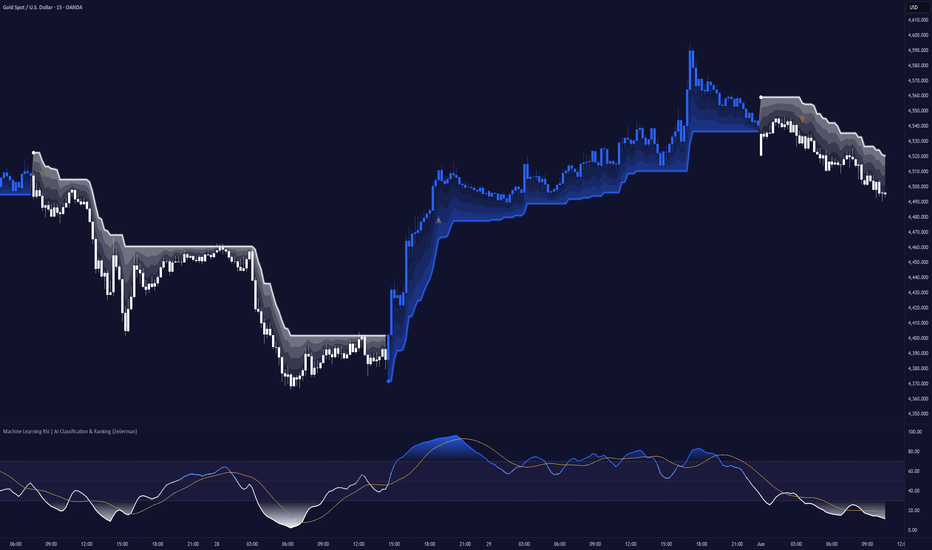
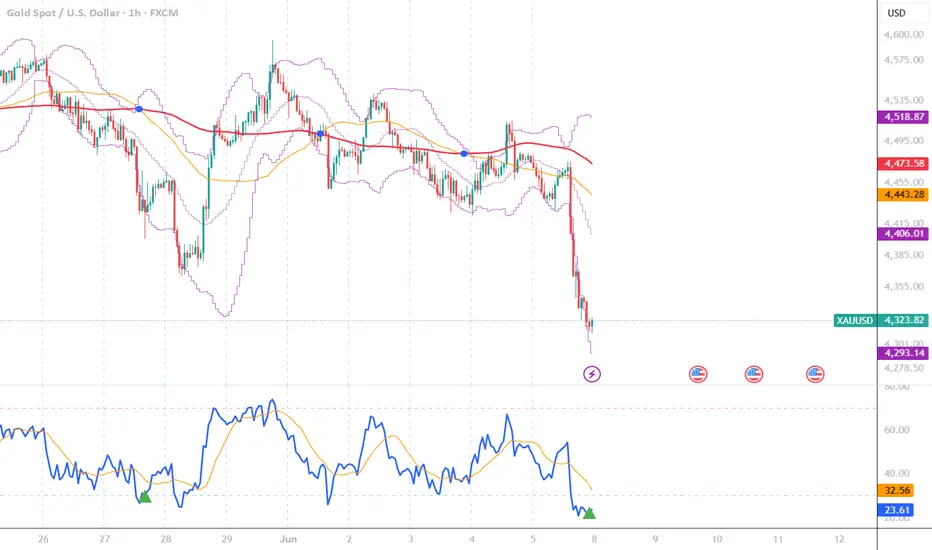
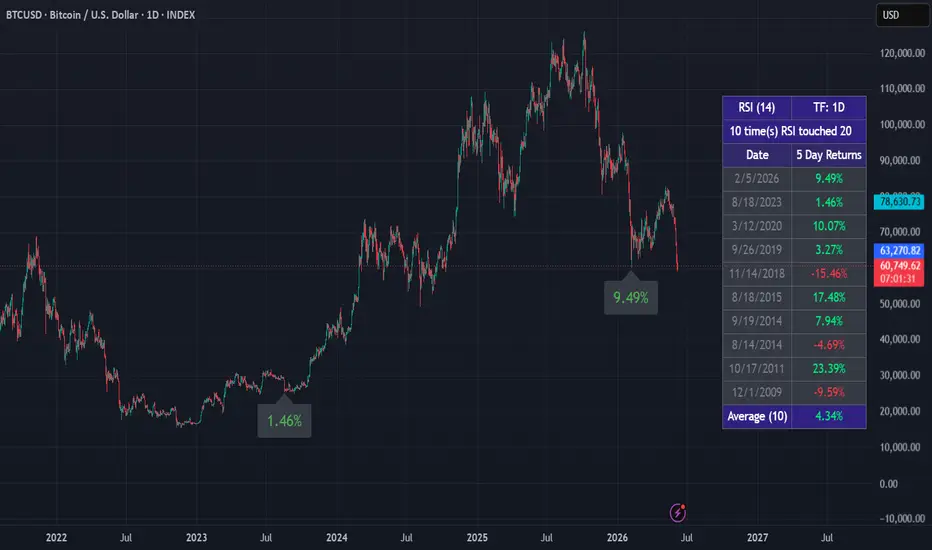
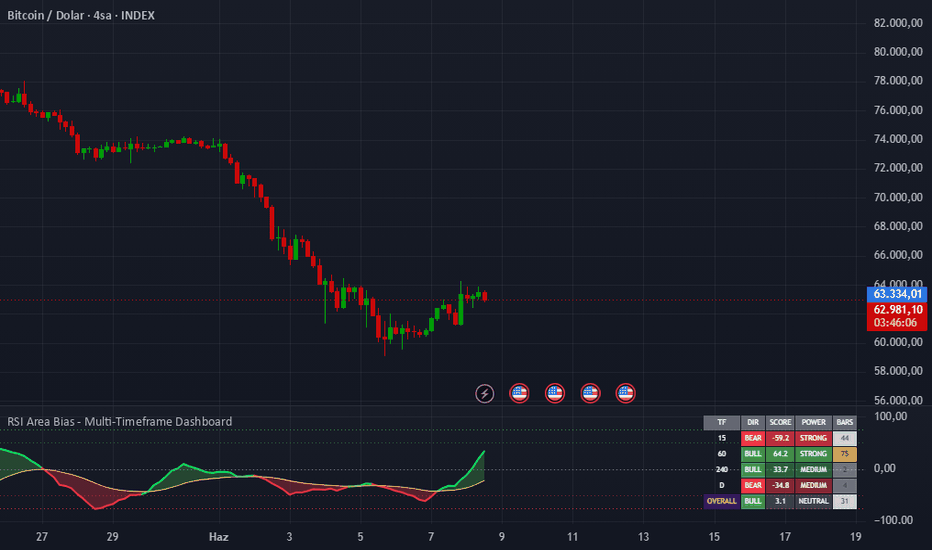
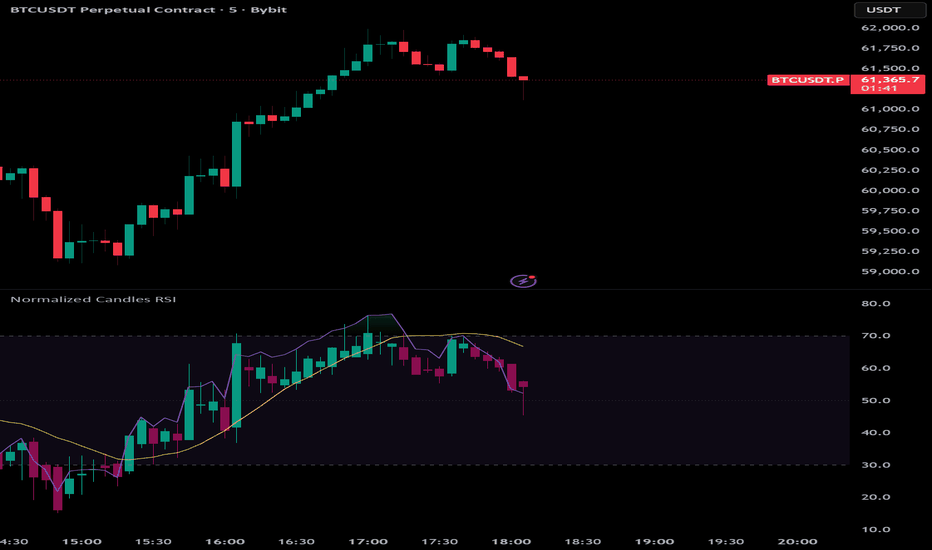
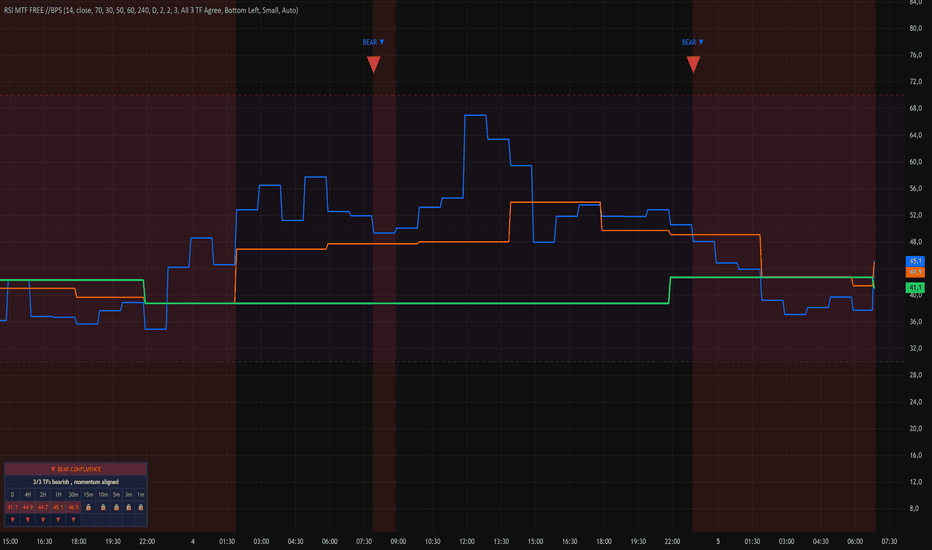
RSI DNARSI dna Oscillator is a momentum analysis tool built around RSI, divergence detection, multi-timeframe RSI readings, volume context, failure swings, higher timeframe bias, and RSI compression behavior.
The purpose of this indicator is to help traders read momentum conditions in a structured way. It is designed to show when RSI is bullish, bearish, overbought, oversold, compressed around the midline, or showing divergence against price action.
This script is an indicator only. It does not place 指标

指标
指标
策略
指标

指标
指标

指标
指标
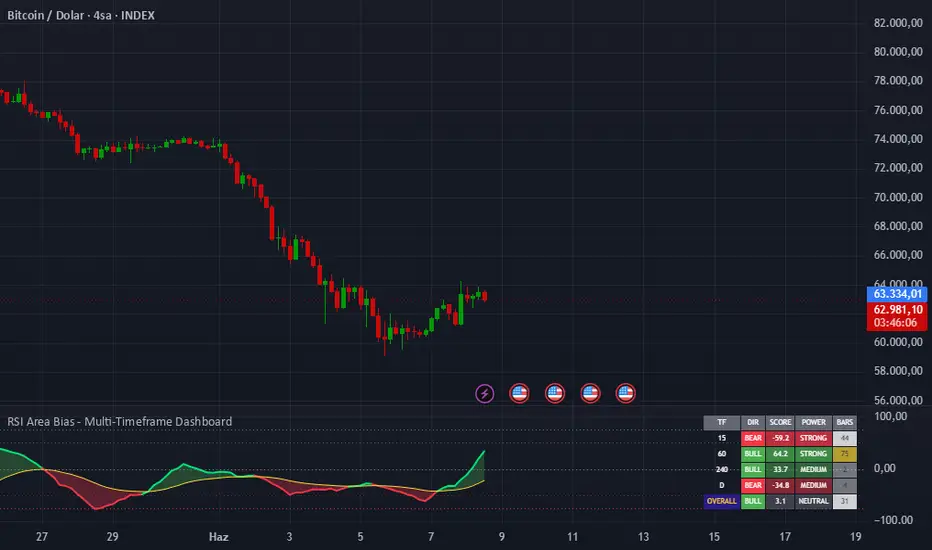
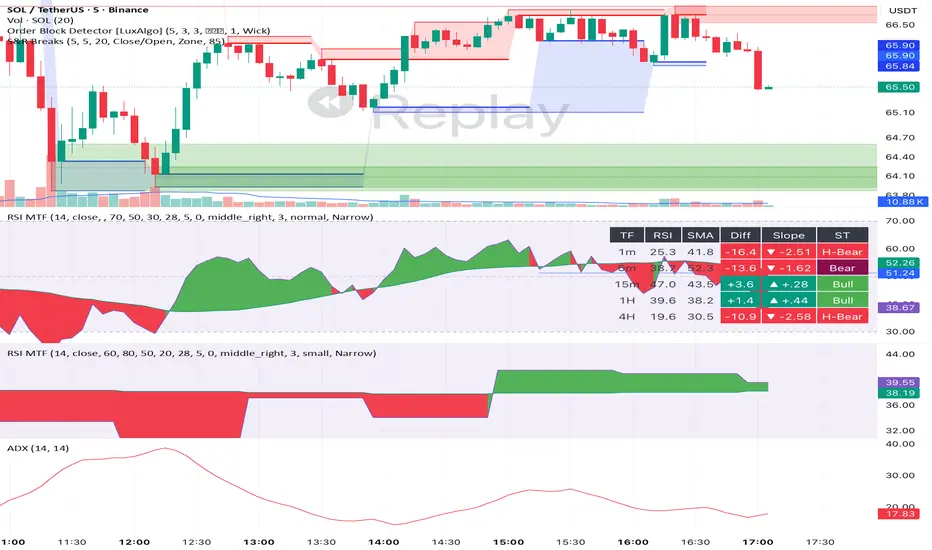
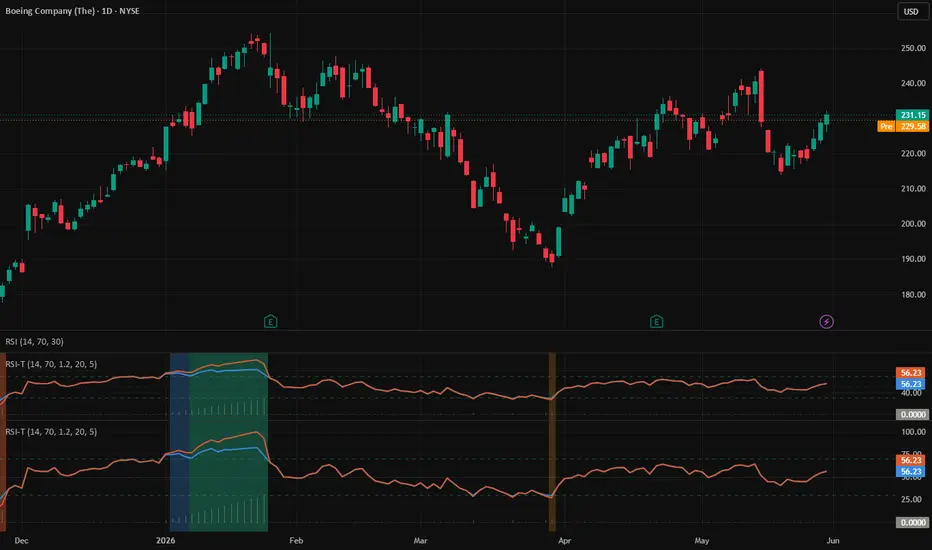
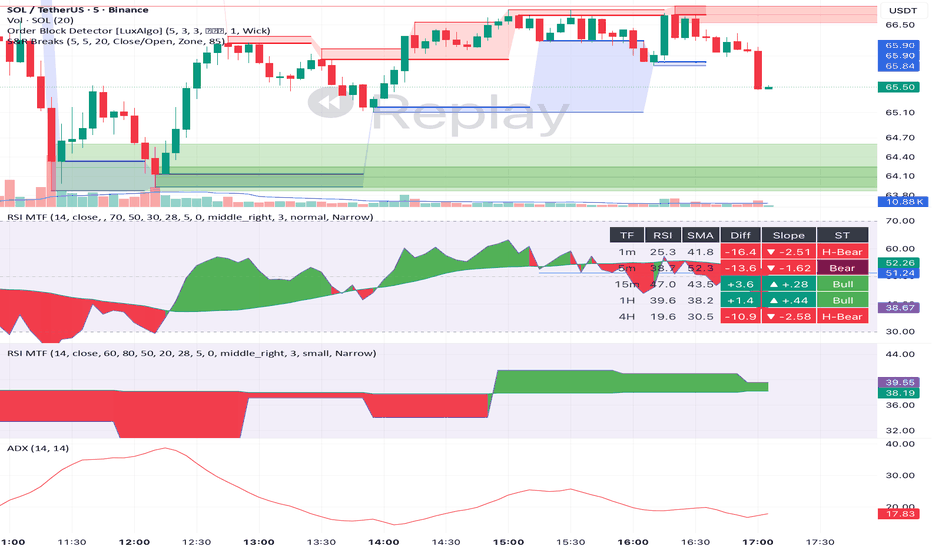
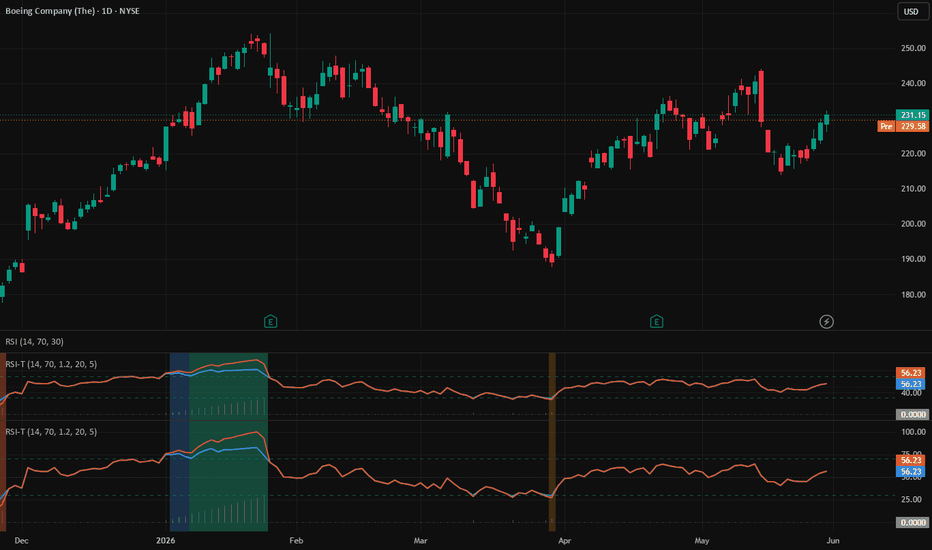
RSI + SMA Crossover Gradient MTF TableA multi-timeframe RSI indicator with SMA smoothing, crossover gradient fill, and a live MTF table.
FEATURES:
- RSI with custom SMA smoothing line
- Crossover Gradient Fill — color darkens as RSI moves away from cross point (bullish/bearish)
- MTF Table showing 1m, 5m, 15m, 1H, 4H timeframes simultaneously
- Each row shows: RSI value, SMA value, Diff (RSI−SMA), Slope direction, and Market State
- Market States: H-Bull, Bull, Bear, H-Bear based on RSI/SMA position relative to 50
- Table size adju 指标
指标
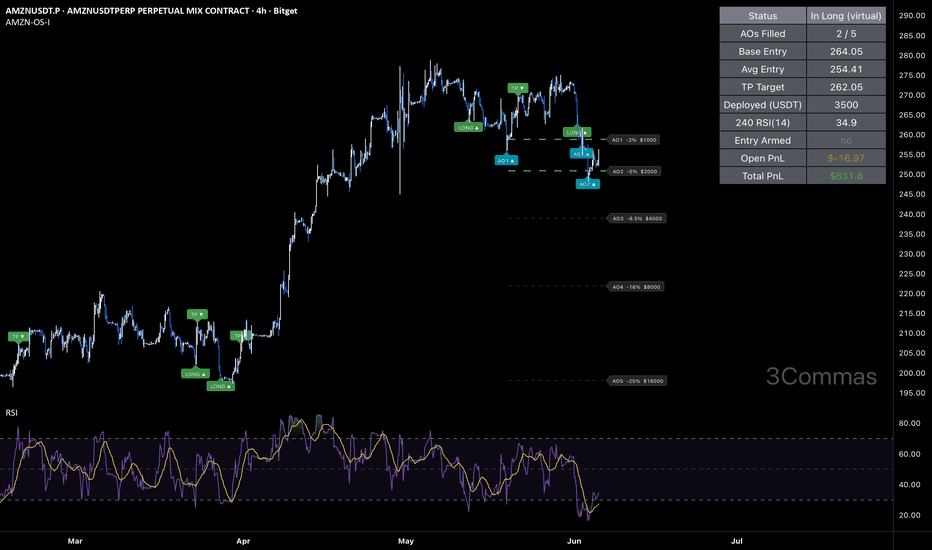
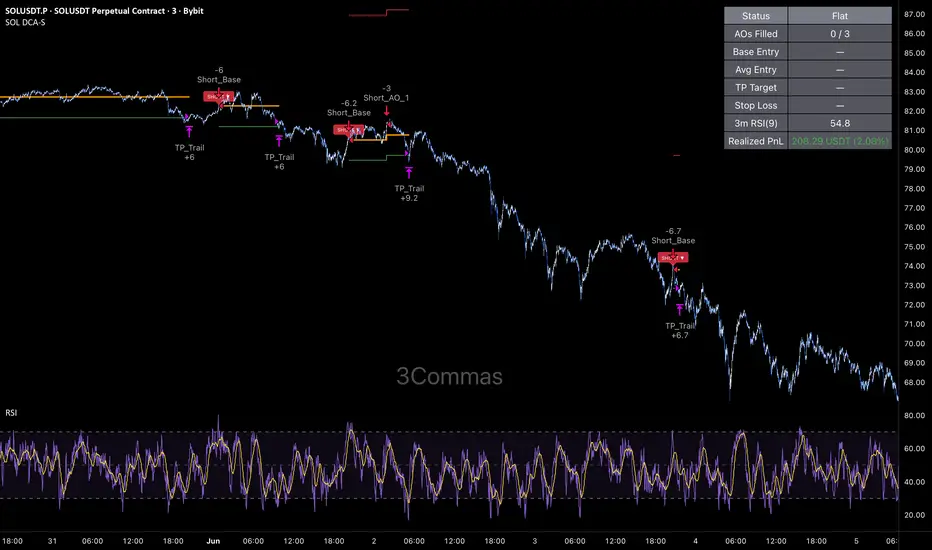
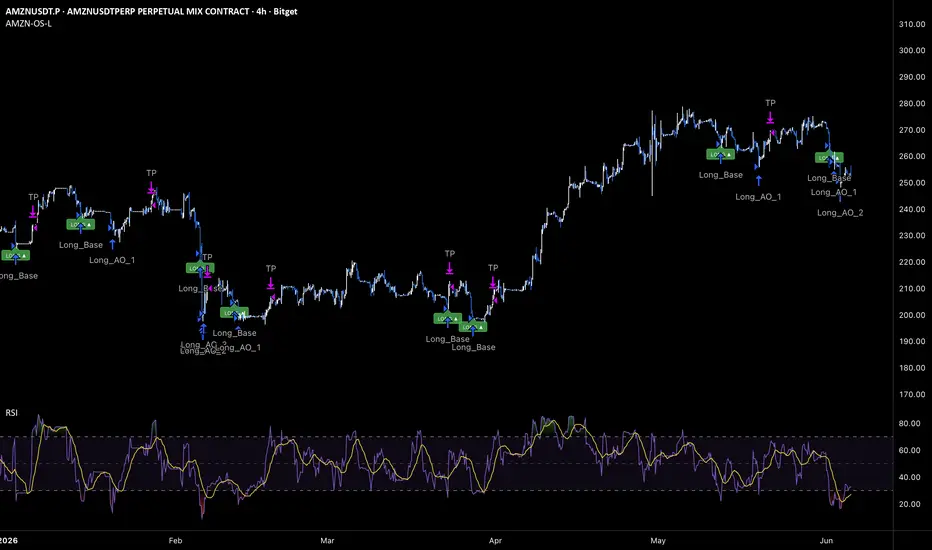
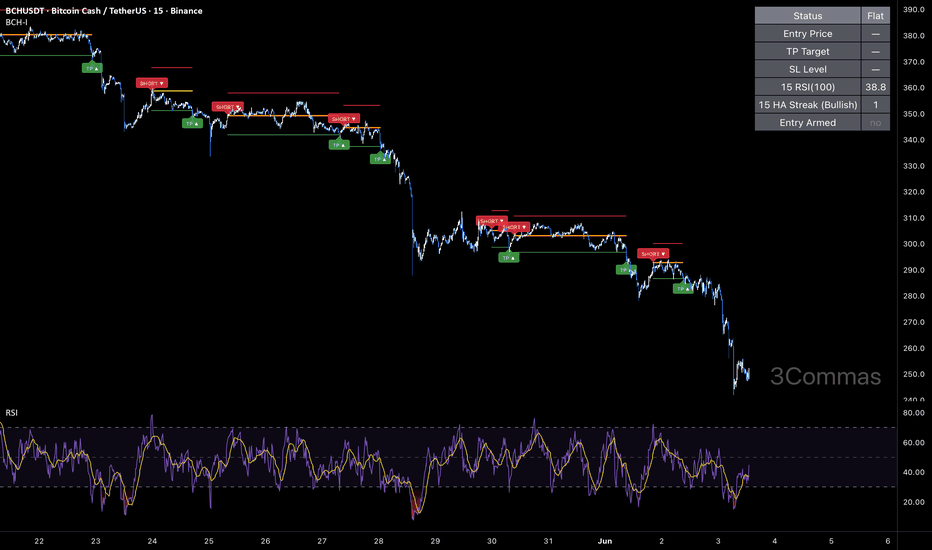
[3Commas] AMZN RSI Oversold Doubling DCA - Long StrategyAMZN RSI Oversold Doubling DCA — Long Strategy
🔷 What it does:
This is a long-only DCA strategy with a selective oversold entry and an aggressive martingale safety-order ladder. A long entry opens only when the 4-hour RSI falls below 28 (deep oversold). Five safety orders then fire at fixed deviations from base entry (−2%, −5%, −9.5%, −16%, −25%) with sizes doubling on every rung ($1,000 → $2,000 → $4,000 → $8,000 → $16,000). Exit is a fixed 3% Take Profit from average entry. No trailing, no St 策略

指标
指标
指标

指标

指标
指标

指标
策略

指标

指标

指标
指标