Yuri Garcia Narrow State Strategy (YGILS)Overview
The Yuri Garcia Institutional Liquidity Strategy (YGILS) is a trend-following and volatility-expansion methodology designed to identify high-probability trading opportunities during periods of market compression and directional momentum.
The strategy combines trend analysis, volatility measurements, momentum confirmation, and risk management into a structured framework that helps traders identify potential institutional participation while maintaining disciplined execution.
The primary objective is not to predict every market move, but rather to participate when multiple conditions align in favor of a directional expansion.
---
Strategy Philosophy
Markets alternate between periods of compression and expansion.
During compression, price contracts, volatility decreases, and market participants become indecisive.
During expansion, volatility increases, momentum accelerates, and directional opportunities emerge.
The strategy is specifically designed to identify the transition from low-volatility environments to high-volatility environments.
The Narrow State identifies compression.
The Elephant Bar identifies expansion.
The highest-quality opportunities typically occur when an Elephant Bar appears shortly after a period of compression and in the direction of the prevailing trend.
---
Core Components
Trend Identification
The strategy uses:
• 20 EMA (Short-Term Momentum)
• 200 SMA (Long-Term Trend)
Bullish Environment
✓ Price above 200 SMA
✓ 20 EMA above 200 SMA
Bearish Environment
✓ Price below 200 SMA
✓ 20 EMA below 200 SMA
This trend filter prevents traders from taking long positions against a bearish market and short positions against a bullish market.
---
Narrow State
A Narrow State occurs when the distance between the EMA 20 and SMA 200 contracts below a user-defined percentage threshold.
Formula:
Distance % = |EMA20 − SMA200| ÷ SMA200 × 100
The Narrow State represents a market compression phase.
Historically, significant market moves frequently begin after periods of compression.
The strategy seeks to participate during the transition from compression into expansion.
Important
The optimal Narrow State threshold depends on the instrument, timeframe, and market volatility.
Lower values produce stricter setups and fewer signals.
Higher values produce more signals but may increase market noise.
Traders are encouraged to optimize this setting based on the specific market being traded.
---
Elephant Bars
An Elephant Bar represents a significant expansion in volatility and directional conviction.
The candle body must exceed the Average True Range (ATR) multiplied by the Elephant Bar Multiplier selected by the user.
Formula:
Candle Body Size > ATR × Elephant Multiplier
Example
ATR = 20 points
Elephant Multiplier = 1.5
Required Body Size = 30 points
Any candle whose body exceeds 30 points is classified as an Elephant Bar.
---
Bullish Elephant Bar
Requirements:
✓ Bullish Candle
✓ Body exceeds ATR threshold
✓ Bullish Trend Active
Bullish Elephant Bars suggest aggressive buying pressure and potential institutional participation.
---
Bearish Elephant Bar
Requirements:
✓ Bearish Candle
✓ Body exceeds ATR threshold
✓ Bearish Trend Active
Bearish Elephant Bars suggest aggressive selling pressure and potential institutional participation.
---
Why Elephant Bars Matter
Institutional traders typically enter positions using significant volume and liquidity.
This often creates unusually large candles relative to recent market activity.
Elephant Bars help identify those moments where participation increases dramatically and may signal the beginning of a directional expansion phase.
---
RBI and GBI Confirmation Patterns
The strategy includes continuation confirmations.
RBI (Red Bar Ignored)
Bullish Continuation Pattern
Requirements:
• Previous candle closes bearish
• Current candle closes bullish
• Current candle closes above previous high
• Bullish trend remains active
This pattern suggests buyers have regained control.
---
GBI (Green Bar Ignored)
Bearish Continuation Pattern
Requirements:
• Previous candle closes bullish
• Current candle closes bearish
• Current candle closes below previous low
• Bearish trend remains active
This pattern suggests sellers have regained control.
---
Entry Conditions
Long Positions
A BUY signal occurs when:
✓ Bullish Trend Active
✓ Narrow State Active
✓ Bullish Elephant Bar OR RBI Pattern
✓ No Existing Long Position
---
Short Positions
A SELL signal occurs when:
✓ Bearish Trend Active
✓ Narrow State Active
✓ Bearish Elephant Bar OR GBI Pattern
✓ No Existing Short Position
---
Risk Management
The strategy uses ATR-based stop loss calculations that automatically adapt to changing market volatility.
Formula:
Stop Loss = Entry ± ATR × Multiplier
This helps maintain consistent risk management across different instruments and market conditions.
---
Take Profit Logic
The strategy uses configurable Risk-to-Reward ratios.
Formula:
Target = ATR × Multiplier × Risk Reward Ratio
Example:
Risk = 50 points
Target = 100 points
Reward Ratio = 2:1
This allows traders to maintain a structured and repeatable approach to position management.
---
Inputs and Customization
ATR Length
Controls volatility calculations.
Higher values create smoother signals.
Lower values create faster reactions.
---
ATR Multiplier
Controls stop-loss distance.
Higher values provide more room for volatility.
Lower values create tighter risk control.
---
Risk Reward Ratio (RRR)
Controls profit target distance relative to stop-loss distance.
Common values:
• 2.0
• 3.0
• 4.0
---
Elephant Bar Multiplier
Controls how large a candle must be before being classified as an Elephant Bar.
Higher values:
• Fewer signals
• Stronger momentum requirements
Lower values:
• More signals
• Faster entries
---
Narrow State Percentage
Controls how close the EMA 20 and SMA 200 must be before a compression phase is recognized.
Smaller values:
• Stricter setups
• Higher selectivity
Larger values:
• More opportunities
• Increased signal frequency
---
Best Practice
The strategy performs best when used as a confirmation tool rather than a prediction tool.
Wait for trend alignment.
Wait for compression.
Wait for volatility expansion.
Then execute according to the rules.
Patience and discipline are often more important than prediction.
The market rewards consistency more than excitement.
---
Disclaimer
This strategy is intended for educational and research purposes only.
Past performance does not guarantee future results.
Always perform your own testing, validation, and risk management before trading live capital. 策略

指标

MA Suite SMA + EMA [Institutional]MA Suite SMA + EMA
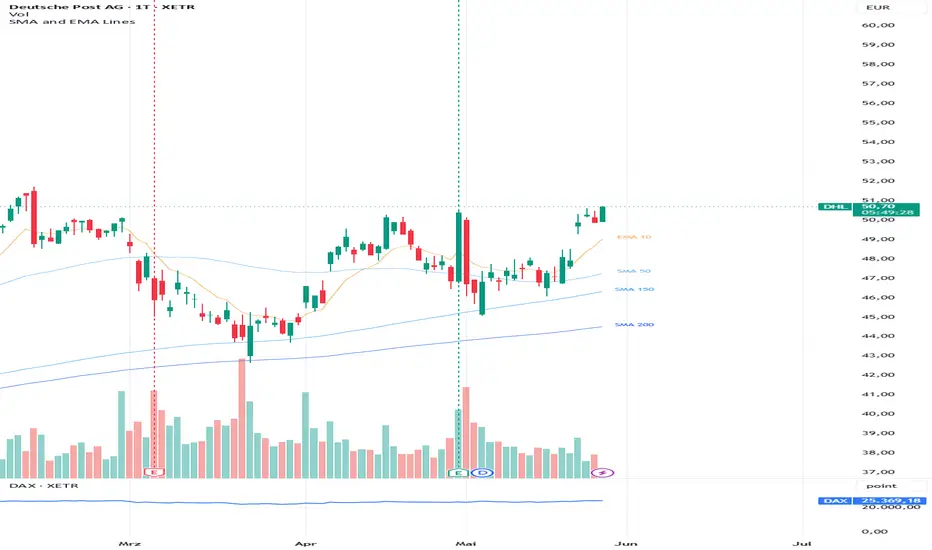
A single overlay that replaces a whole stack of separate moving-average indicators. It plots up to 6 fully configurable SMAs and 6 EMAs side by side, with everything you need to read trend structure at a glance — and nothing you have to fight with.
Core
- 6 SMA + 6 EMA slots, each with its own enable toggle, length, color, and line width.
- Sensible institutional defaults (20 / 50 / 100 / 150 / 200) with the 20, 50 and 200 emphasized by thickness.
- Disabled lines disappear from both the chart and the status line, so the data window stays clean — you only ever see the values you actually use.
Multi-timeframe
- Compute every MA from a higher timeframe (e.g. show daily MAs while viewing an intraday chart).
- Permanent 20-week and 200-week SMA anchors that hold their value on any lower timeframe, with optional smoothing to remove the weekly "staircase."
Slope projection
- Tick ext on any line to extend it forward along its current slope — a quick look at where a moving average is heading. The 200 SMA and both weekly anchors are projected by default.
Context tools
- % distance table showing how far price sits from each active MA — fast read on stretch and mean-reversion.
- Slope coloring (lines fade when falling) and an optional bias background (price above/below the 200 SMA).
- Golden / death-cross markers, a configurable ribbon fill, and an anchored VWAP with standard-deviation bands.
- Built-in alerts for MA crosses and price/MA crossovers.
One indicator, every moving-average reference an institutional trader actually looks at. 指标

指标

指标

Timeframe fix Multi SMA Daily and WeeklyHow it works
All moving averages are calculated from the symbol’s closing price using the standard Simple Moving Average formula. The important design choice is that the moving averages are fixed to their intended higher timeframes:
* The 13D, 20D, 50D, and 200D SMAs are always calculated from daily candles.
* The 50W, 100W, and 200W SMAs are always calculated from weekly candles.
This means the values do not change into “chart-timeframe SMAs” when the user switches to an intraday, hourly, 4-hour, or other lower timeframe chart. For example, the 200D SMA remains the 200-day SMA even when viewed on a 15-minute chart, and the 50W SMA remains the 50-week SMA even when viewed on a daily or intraday chart.
The script uses TradingView’s higher-timeframe data requests to project these fixed daily and weekly SMA levels onto the active chart. This allows traders to analyze lower-timeframe price action while still seeing the same higher-timeframe reference levels they would see on the daily or weekly chart.
For the plotted lines, the script uses higher-timeframe values with gaps enabled, so the displayed levels behave visually like native higher-timeframe data on lower timeframes. For the last-bar labels, the script retrieves the latest available daily or weekly SMA value without gaps, so the labels remain visible and readable at the current price scale.
Lookahead is disabled, so the script does not intentionally use future higher-timeframe data.
指标

指标

指标

指标

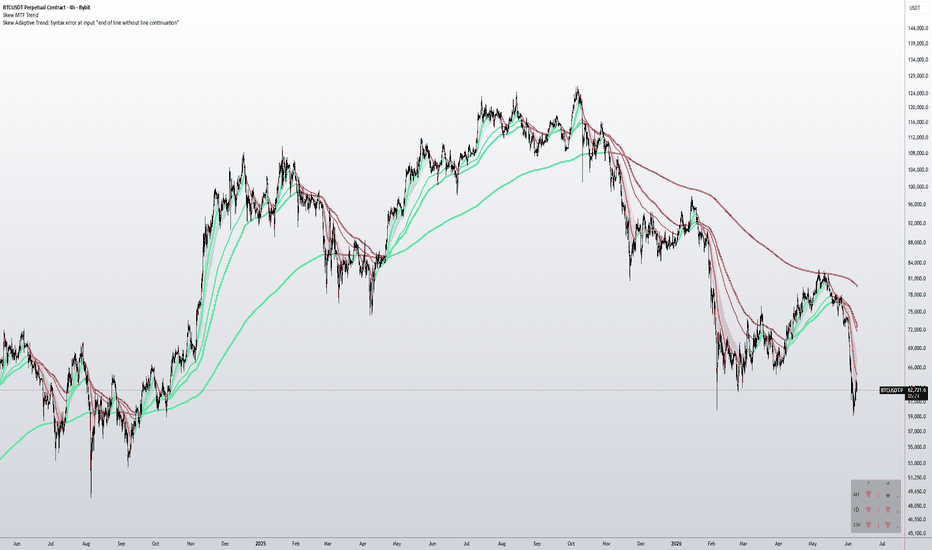
Skew MTF TrendMulti-timeframe trend structure at a glance.
Three fully configurable timeframes on one chart every average colored by its native timeframe's trend state: green above, red below, gray neutral.
Main Timeframe (default 4H)
EMAs 21, 50, 100, 200. A ribbon fills between the 21/50/100 — green when bull-stacked, red when bear-stacked, gray when mixed.
HTF 1 (default Daily)
EMAs 50 and 200 with trend coloring.
HTF 2 (default Weekly)
EMAs 21, 50, 200 and SMA 200 with trend coloring.
All three timeframes can be changed to any combination. Linewidth scales by layer (Main: 2, HTF 1: 3, HTF 2: 4) for instant visual separation. Master toggles show/hide each timeframe with one click. Every period and line is independently configurable.
Trend Table
A compact table in the bottom right reads trend state per timeframe using the 50 EMA and 200 EMA:
▲ Green — price above both the 50 EMA and 200 EMA (uptrend)
▼ Red — price below both the 50 EMA and 200 EMA (downtrend)
● Gray — price between the 50 and 200, or mixed (pending)
The table dynamically displays each selected timeframe, updating automatically when settings change.
Trading with it
The 50 EMA is the key level that defines the trend. The 200 EMA is the level you trade into.
Uptrend — Price holds the 50 EMA as support, table showing ▲. Dips into the 50 EMA and the ribbon are buying opportunities. If price dips deeper, the 200 EMA is the next level to bid — the last line of trend defense.
Downtrend — Price rejects the 50 EMA as resistance, table showing ▼. Rips into the 50 EMA and the ribbon are selling opportunities. The 200 EMA above is the level to sell into on deeper retracements.
Chop — Price is caught between the 50 and 200, table showing ● on one or more timeframes. Neither side has control. Reduce size or sit flat until the 50 EMA cleanly holds or rejects.
When all three timeframes agree, the trend is strong. When they disagree, conditions are transitional. 指标
指标

指标

策略

指标

指标

指标

NTR: NASDAQ M1 - Trend RunnerNASDAQ M1 - MACD Trend Runner is a systematic trend continuation strategy specifically designed and optimized for the NASDAQ index on the 1-minute timeframe.
The strategy was developed around a simple observation:
Strong directional movements in NASDAQ often emerge after temporary pullbacks toward key moving averages while underlying momentum remains intact.
Instead of attempting to predict reversals or market turning points, the objective of this framework is to identify favorable re-entry opportunities within an existing bullish environment and allow winning positions to develop through dynamic trade management.
CORE CONCEPT
The strategy combines momentum, trend structure, market positioning, and risk control into a single execution model.
A valid setup requires:
• MACD bullish crossover.
• Momentum developing from lower MACD values.
• Price trading within a defined proximity to the 200-period moving average.
• Positive higher-order trend structure measured through the slope of the 50-period moving average.
• Time-of-day filtering to focus on periods of meaningful market participation.
This combination seeks to isolate moments where price temporarily retraces into trend support before resuming directional movement.
TRADE MANAGEMENT
Risk management is based on market structure rather than fixed stop distances.
Initial stop placement is determined using recent technical lows, creating a structure-based risk framework that adapts to changing market conditions.
Once a position develops sufficient unrealized profit, the strategy transitions into a trailing stop model designed to protect gains while allowing extended trend participation.
The goal is not to maximize win rate.
The goal is to capture asymmetric reward opportunities where a limited number of successful trades can outweigh multiple small losses.
KEY FEATURES
• MACD Momentum Confirmation
• SMA200 Trend Location Filter
• SMA50 Slope Validation
• Technical Structure-Based Stop Loss
• Dynamic Trailing Stop Management
• Session-Based Time Filter
• Daily Trade Limitation Logic
• Daily Profit Protection Logic
• Visual Diagnostic System
• Re-entry Detection Framework
DESIGN PHILOSOPHY
This strategy is intentionally specialized.
It was developed, tested, and refined specifically for NASDAQ price behavior on the 1-minute timeframe.
While certain concepts may be transferable to other instruments, the framework was not designed as a universal trading system.
The primary objective is to exploit recurring short-term trend continuation behavior observed within NASDAQ intraday market structure.
DISCLAIMER
This strategy is provided for educational and research purposes only.
Past performance does not guarantee future results. All trading involves risk, and users should perform their own analysis and validation before applying any strategy in live market conditions.
Created by @Peter_n_n 策略

SXA: Super Xtation Amplitude | MTF FrameworkSXA (Super Xtation Amplitude) is a multi-timeframe market positioning framework designed to provide a complete visual overview of price location within the broader market structure.
Rather than focusing on entry signals, SXA combines trend context, volatility, session activity, anchored VWAPs, prior-day reference levels, Fibonacci projections, and higher-timeframe moving averages into a single environment. The objective is to help traders understand where price is currently trading relative to statistically and structurally significant areas.
The indicator was built around a simple principle:
"Price behaves differently depending on where it is located within the market."
By integrating multiple forms of context into one view, SXA allows traders to quickly identify premium and discount zones, trend alignment, session-driven liquidity areas, and potential reaction levels without switching between multiple indicators.
FEATURES
• Smart Trend Engine
Multi-timeframe moving average framework designed to visualize short, intermediate, and macro directional bias.
• Dynamic Trend Clouds
Visual cloud structures help identify trend alignment and potential transition zones between bullish and bearish conditions.
• Higher Timeframe Context
Daily 50 SMA and 200 SMA provide broader market structure and long-term directional references.
• Prior Day Reference Levels
Automatic plotting of previous day's Open, High, Low, and Close.
• Fibonacci Expansion Grid
Extended Fibonacci projections derived from the previous day's range to identify potential reaction zones and liquidity targets.
• Anchored Session VWAPs
Includes:
* Daily VWAP
* European Session VWAP
* Pre-New York VWAP
* New York Session VWAP
* Post-European Session VWAP
These levels provide institutional-style references for price acceptance and value.
• Weekly Structure Levels
Dynamic weekly Open, High, and Low levels update in real time throughout the trading week.
• Session Mapping
Visual session boxes highlight important market periods, including the Asian session and Pre-New York range.
INTENDED USE
SXA is designed as a contextual decision-support tool rather than a standalone trading system.
The indicator can be used to:
* Assess overall market positioning.
* Identify trend alignment across multiple timeframes.
* Locate potential support and resistance zones.
* Track session-driven liquidity.
* Monitor volatility expansion and contraction.
* Build discretionary trade narratives.
* Enhance existing trading systems.
SXA does not generate buy or sell recommendations. Instead, it seeks to answer a more fundamental question:
"Where is price currently located within the broader market landscape?"
By providing that context at a glance, traders can make more informed decisions while reducing chart clutter and indicator overload.
Created by @Peter_n_n
指标

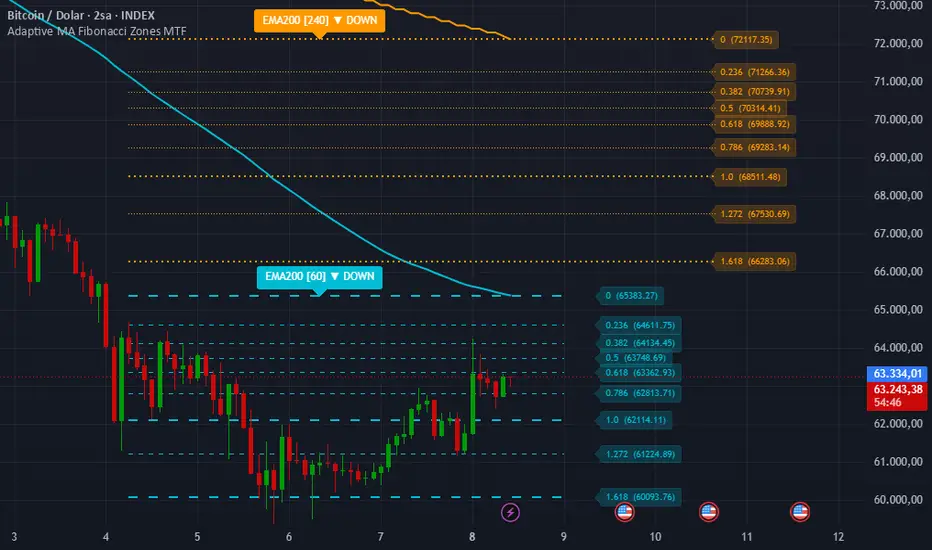
Adaptive MA Fibonacci Zones MTF# Adaptive MA Fibonacci Zones MTF
Adaptive MA Fibonacci Zones MTF is a multi-timeframe technical analysis tool that projects Fibonacci-based price levels around a selected moving average.
The indicator allows traders to choose from multiple moving average types, including EMA, SMA, WMA, SMMA, DEMA, TEMA, HMA, VWMA, ALMA, and KAMA. Two independent higher timeframes can be analyzed simultaneously, making it easier to compare trend structure and potential reaction zones across different market perspectives.
### Features
• Supports multiple moving average calculation methods
• Displays two configurable higher timeframes on a single chart
• Automatically generates Fibonacci-based projection levels around each moving average
• Dynamic bullish and bearish level calculation depending on price position relative to the selected moving average
• Optional Fibonacci level labels
• Visual trend direction labels for each timeframe
• Useful for identifying potential support, resistance, pullback, and expansion areas
### How It Works
The script calculates a selected moving average on two user-defined timeframes. A customizable percentage range is then applied around each moving average, and Fibonacci ratios are projected within that range. When price is above the moving average, levels are projected upward. When price is below the moving average, levels are projected downward.
### Notes
This indicator is designed as a visual analysis tool and should not be considered financial advice. Fibonacci levels and moving averages are analytical references that may be used alongside other forms of technical analysis and risk management techniques.
指标

Moving averages. JB styleMoving averages. JB style
A clean, configurable multi-MA overlay. Up to four moving averages, each colored by its own slope, with debounced crossover markers, weight-scaled line widths, an EMA/SMA switch, a regular-hours session lock, and five color palettes — all tuned so the indicator reads as a separate layer over your candles instead of blending into them.
WHAT IT DOES
- Up to 4 moving averages. Defaults are 9 / 21 / 50 / 200, and every slot has its own editable length and show/hide toggle, so you can run one MA or all four. Source is fixed to close to keep the panel simple.
- EMA or SMA from one dropdown. The MA Type dropdown flips all lines between simple and exponential, reusing the same lengths and styling.
- Slope-based coloring. Each line is colored by its own slope: a blue tone when rising, an orange/amber tone when falling, and neutral gray when essentially flat. Colors sit deliberately off the green/red axis so the lines never blend into the candles.
- Weight-scaled widths. Faster MAs are thin, slower MAs are thick, so the long-term anchors stand out at a glance. The slowest MA is drawn as a dotted circle line to mark it as the long-term reference.
- Crossover markers. A hollow ring with a centered dot marks crossovers between adjacent MAs (1x2, 2x3, 3x4) — including the classic 50/200 — a bright bull tone for a bullish cross and an amber tone for a bearish one, placed right at the crossing price.
- Five palettes. Dark, Light, Neon, Ocean, and Solarized. Candles are never recolored on any theme.
WHY IT'S DIFFERENT
Most moving-average indicators just draw lines and color them by whether price is above or below — which whipsaws constantly. This one is built around signal reliability:
1. Slope coloring instead of price-vs-MA coloring. Color reflects whether the average itself is rising or falling — a steadier read of trend than the noisy "is price above the line" flip.
2. A slope deadband kills color flicker. Near-flat averages normally strobe between colors on every tick. Here the slope must clear an ATR-scaled threshold before the color flips; otherwise the line goes neutral. A flat ribbon looks flat — which is itself useful information.
3. Crossovers are MA vs MA, not price vs MA. A faster average crossing a slower one needs agreement between two degrees of smoothing, so it fires far less on noise than a single line being touched by price.
4. A debounce filter removes chop without lagging the signal. The marker fires on the actual crossover, then suppresses further crosses until the two averages genuinely separate (by an ATR-scaled amount) and reconverge. A cluster of back-and-forth chop crosses produces one marker on the real cross — not a smear of noise, and not delayed to a later cross.
5. Confirmed-bar markers don't repaint. A crossover marker appears only after the bar closes, so it never flashes mid-bar and then vanishes.
6. Regular-hours session lock. Every MA (and the ATR behind the filters) is computed from a regular-session feed, so a 200-MA reads the same whether your chart shows extended hours or not. The lines simply hold flat through pre/post-market instead of drifting. On 24/7 instruments this is a harmless no-op.
7. Always the chart's own timeframe. The session lock swaps only the session, never the timeframe — the MAs are always calculated on the timeframe you're viewing.
8. Lines that don't fight the candles. Bull/bear line colors are deliberately blue/orange rather than green/red, so the indicator reads as a clean layer over the candles instead of camouflaging into them.
INPUTS
- Palette: color theme for lines and markers (Dark / Light / Neon / Ocean / Solarized).
- MA Type: SMA or EMA, applied to all lines.
- Regular Hours Only: compute all MAs and ATR from a regular-session feed, regardless of the chart's session.
- Show Crossovers: toggle all crossover markers.
- Slope Deadband (x ATR): minimum slope before the color flips; 0 disables (default 0.02).
- Crossover Min Sep (x ATR): debounce gap — after a marked cross, the next one is suppressed until the MAs separate by this amount and reconverge; 0 disables (default 0.10).
- MA #1-4 Show / Length: per-slot visibility and period (defaults 9 / 21 / 50 / 200).
指标

Predictive SMA & BB■ Overview
Most technical indicators are strictly lagging—they only tell you what has already happened. The "Predictive SMA & BB" flips this paradigm by projecting the Simple Moving Average (SMA) and Bollinger Bands (BB) into the future space of your chart.
This tool allows you to visualize where dynamic support and resistance (the statistical walls) will be in the future, giving you a massive edge in planning limit orders and understanding the element of "time" in your trades.
■ The Core Logic: Forward Fill & Sliding Window
How do we plot the future without a crystal ball?
This script uses a quantitative approach known as "Forward Fill". It simulates the passing of time by assuming the current price remains perfectly flat (sideways).
As it projects bars into the future, the algorithm drops the oldest historical data points from the calculation window (e.g., a 200-period window) and sequentially fills the new future slots with the current close price.
This reveals a powerful mathematical truth: Even if the price doesn't move, moving averages and standard deviations will shift based on the decay of historical data.
■ Key Features & How to Use
Future Baseline Projection: See exactly when a downward-sloping SMA will mathematically curl upwards as old, extreme price data is dropped from the calculation.
Time-Based Squeeze Anticipation: As future bars are populated with flat prices, the projected Bollinger Bands will naturally squeeze, visualizing the expected statistical boundaries if volatility dies down.
Custom UI: Fully customizable from the inputs panel. Toggle the future SMA, BB lines, and cloud fills, and adjust colors/opacity without touching the code.
■ ⚠️ Crucial Limitations & Disclaimers
To use this tool effectively, you must understand its mathematical limitations:
Not a Crystal Ball: This indicator projects a statistical baseline based on the assumption that current prices will maintain a zero-volatility trajectory.
Vulnerability to Volatility Expansion: The projected ±2σ bands do NOT account for sudden, explosive price movements (e.g., macroeconomic news, central bank interventions). If high-impact news hits and volatility expands, the actual bands will violently widen, overriding the projected squeeze.
Decreasing Confidence: The further you project into the future, the more the calculation relies on the "Forward Fill" assumption, naturally decreasing the statistical confidence of the extreme ends of the projection.
Use these projected lines as strategic zones for "waiting in ambush" during normal market conditions, not as absolute guarantees. Combine this with multi-timeframe analysis and your own price action strategies. 指标

Dual MA Gradient [Gabremoku]Dual MA Gradient is a clean dual moving average overlay designed to highlight not only MA direction and crossover, but also the degree of separation between the two averages through a dynamic gradient ribbon.
The script uses two configurable moving averages and transforms their relationship into a visual ribbon that reacts to:
bullish alignment
bearish alignment
neutral compression
Instead of relying only on a simple crossover, the indicator helps show whether the two averages are:
crossing,
compressing,
or expanding apart
That makes it useful as a compact trend-structure tool for traders who want an at-a-glance read on direction and relative momentum.
What it shows
📈 Two configurable moving averages — each MA can be set independently using:
EMA or SMA
custom length
custom source
🌈 Directional gradient ribbon — the space between the two averages is divided into layered fills that create a smooth visual ribbon.
🟦 Bullish separation — when the fast MA is above the slow MA, the ribbon shifts to bullish color.
🟨 Bearish separation — when the fast MA is below the slow MA, the ribbon shifts to bearish color.
⚪ Compression state — when the spread between the two MAs becomes small enough, the ribbon fades into a neutral state to signal contraction.
🏷️ Status label — optional live label shows the active state:
Compression
Bullish Separation
Bearish Separation
⭕ Cross markers — optional markers can be shown when bullish or bearish MA crosses occur.
Core logic
The indicator is built around three simple but useful ideas:
Which MA is on top
How far apart the two MAs are
Whether the spread is strong enough to be directional or too tight and neutral
A moving average crossover occurs when a shorter-period average crosses a longer-period average, and it is commonly used to identify trend shifts or signal changes in directional bias.
This script goes a step further by emphasizing the spread between the averages. That matters because ribbon spacing is often used as a visual clue for trend structure: when averages are compressed, the market may be in transition or contraction, while a wider directional ribbon can reflect stronger alignment.
How to read it
A practical reading method is:
Compression = the two averages are close together, market may be transitioning or losing directional clarity
Bullish separation = the fast MA is above the slow MA and the ribbon is opening upward
Bearish separation = the fast MA is below the slow MA and the ribbon is opening downward
In many moving-average frameworks:
the cross helps identify the directional shift
the spacing helps evaluate whether that shift is weak or established
a tight ribbon often suggests indecision or a developing transition
Features
✅ Dual moving average framework
✅ SMA or EMA selection for both lines
✅ Fully customizable lengths
✅ Dynamic layered ribbon between MAs
✅ Bullish / bearish / neutral compression states
✅ Optional MA line display
✅ Optional live status label
✅ Optional crossover markers
✅ Built-in bullish and bearish crossover alerts
Notes
This indicator is designed as a trend-visualization tool rather than a complete standalone strategy. Like all moving-average systems, it is inherently lagging, so it is generally more useful for confirming structure and directional bias than for predicting reversals in isolation.
Author: Gabremoku
Pine Script v6 指标

指标