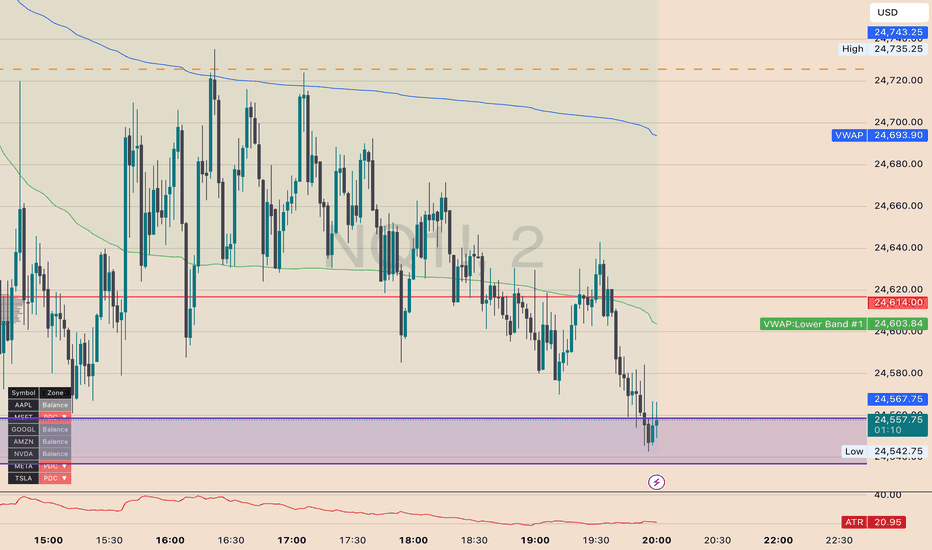
2-Day Volume Weighted Average Price2-Day VWAP (Volume Weighted Average Price)
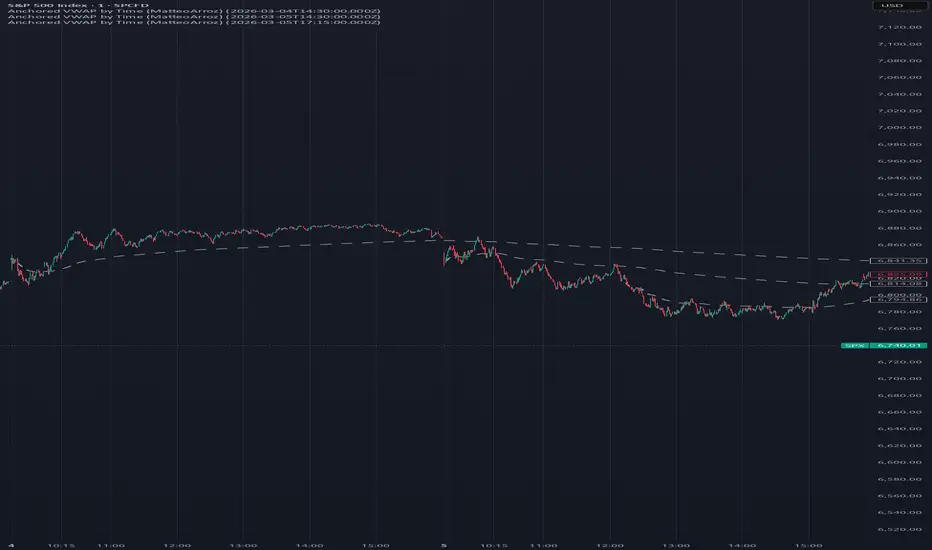
This script plots a 2-Day Volume Weighted Average Price (VWAP) along with optional deviation bands, designed to give traders a clearer understanding of short-term fair value across multiple sessions. Unlike a standard daily VWAP that resets every session, this version blends the current day with the previous trading day, creating a more stable and context-rich reference point for intraday decision-making.
What This Script Does
At its core, this indicator calculates VWAP using cumulative price and volume data from both the current session and the immediately preceding session. This creates a continuous two-day value area that reflects where the majority of trading activity has occurred across that window.
Instead of resetting fully at the start of each day, the script:
Stores the prior session’s volume and price data
Carries it forward into the current session
Combines both datasets into a unified VWAP calculation
This results in a smoother, more structurally meaningful VWAP that avoids the sharp resets seen in traditional single-day VWAPs.
In addition, the script includes up to three configurable bands, which can be calculated using:
Standard deviation (volatility-based expansion)
Percentage-based distance from VWAP
These bands dynamically adjust based on price behavior and volatility, helping define statistically relevant zones around the VWAP.
Why This Is Useful
Markets do not operate in isolation from one day to the next. A standard VWAP resets daily, which can sometimes remove important context—especially in environments where price is balancing, consolidating, or transitioning between regimes.
The 2-Day VWAP addresses this by:
Preserving short-term memory of the market
Providing a more stable equilibrium level
Reducing noise from abrupt daily resets
Offering a clearer view of whether price is trading at a premium or discount relative to recent activity
This makes it particularly effective in:
Range-bound conditions
Transitional market phases
Intraday execution aligned with slightly higher timeframe context
How to Use It
The 2-Day VWAP is best used as a dynamic reference point for value and positioning, not as a standalone signal.
A common framework for using it:
1. Identify Market Location
When price is above VWAP → market is trading at a premium
When price is below VWAP → market is trading at a discount
When price is near VWAP → market is in balance
2. Observe Reactions at VWAP
The VWAP often acts as an area where:
Buyers and sellers reach temporary agreement
Liquidity concentrates
Rotations or continuations begin
Pay attention to how price behaves when interacting with it:
Clean rejection → continuation away from VWAP
Acceptance (chop around it) → balanced conditions
3. Use Bands for Context
The deviation bands help frame extremes:
Outer bands may indicate stretched conditions
Inner bands can act as intermediate reaction zones
In volatility-based mode, these bands expand and contract naturally with market conditions, making them adaptive rather than fixed.
4. Align With Your Execution Timeframe
This indicator is most effective when used on intraday charts (such as 5m or 15m), where it can guide execution while still incorporating higher timeframe context through its 2-day structure.
Key Advantages
Provides a more continuous and stable VWAP framework
Reduces the “reset effect” of traditional VWAP
Helps identify true short-term value
Adapts to volatility through dynamic band calculations
Works well alongside price action, structure, and other confluence factors
Important Notes
This indicator does not predict future price movement. It is a tool for contextualizing current price relative to recent trading activity.
VWAP-based strategies require discretion, experience, and proper risk management.
Market conditions vary, and no single tool is universally effective in all environments.
Disclaimer
This script is provided for educational and informational purposes only. It does not constitute financial advice, investment advice, or a recommendation to buy or sell any financial instrument. Trading involves risk, and past performance is not indicative of future results. Always conduct your own analysis and consult with a qualified financial professional before making any trading decisions.
If you want, I can tailor this description specifically to your style (like your 5DMA absorption + expansion framework) so it matches your system perfectly. 指标

指标

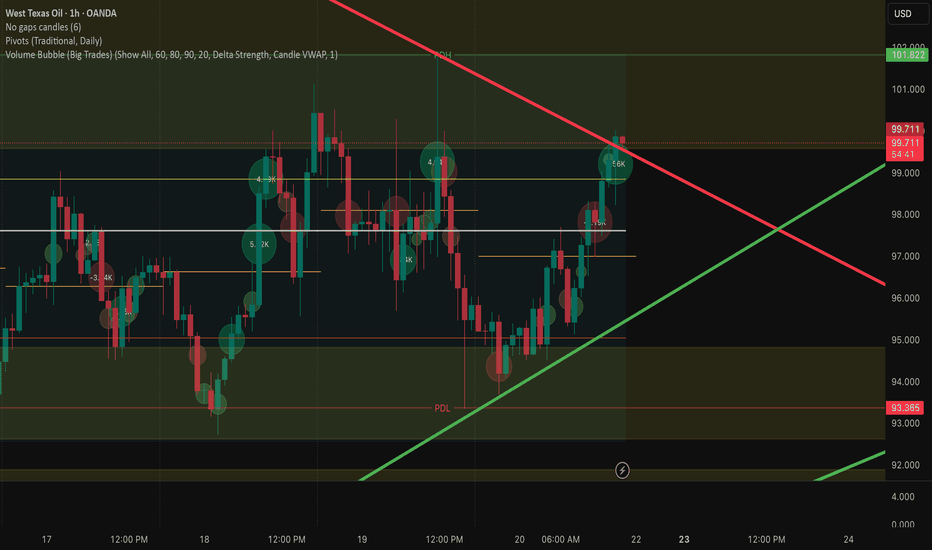
Volume Bubble (Big Trades)Gemini said
Delta Volume Bubbles: How It Works
The Delta Volume Bubbles indicator is a sophisticated order flow tool designed to visualize "aggressive" market activity directly on your price chart. Instead of looking at a separate sub-window for volume, this script places circular "bubbles" on the candles where significant buying or selling pressure occurs.
1. The Core Logic: Delta Calculation
At its heart, the indicator uses Volume Delta, which is the difference between buying volume (at the ask) and selling volume (at the bid).
Positive Delta: More aggressive buying; the bubble is typically green.
Negative Delta: More aggressive selling; the bubble is typically red.
To provide precision, the script uses Lower Timeframe (LTF) data. For example, if you are on a 1-hour chart, it scans 1-minute data to see how volume was distributed within that hour.
2. Bubble Placement & Size
The indicator doesn't just put a dot at the close. It offers two placement modes:
Candle VWAP: Places the bubble at the Volume Weighted Average Price of that specific candle, showing you exactly where the "heavy" trading occurred.
Middle: Places the bubble at the candle’s midpoint (HL/2).
The size of the bubble is dynamic, scaling based on the Z-Score (a statistical measure of how "extreme" the volume is compared to the recent average). A "Huge" bubble represents a significant statistical outlier in volume.
3. Filtering and Intensity
The script filters out "noise" so your chart isn't cluttered.
Percentile Filter: Only shows bubbles if the volume is in the top X% (e.g., top 60%) of recent history.
Intensity Mode: When enabled, the colors shift from "Buy/Sell" to a heat map (Gray → Blue → Orange → Red) based on the pure strength of the volume, regardless of direction.
4. Visual Clarity
The recent update introduces a Transparency Slider. This allows you to make the bubbles "ghost-like," ensuring they don't hide the wick or body of the candlestick. This is crucial for price action traders who need to see if a big volume bubble resulted in a reversal pin bar or a breakout. 指标
指标

指标

Pro Levels & Zones [MTE]Pro Levels & Zones
An intraday futures overlay that combines pivot-based supply and demand zones with multi-session key levels and a confluence-based signal filter. The core idea is that zones alone generate too many potential entries — by requiring alignment across multiple independent factors before labeling a zone touch, the indicator filters out low-conviction setups and highlights where several references converge.
HOW IT WORKS
Supply & Demand Zone Detection
Zones are built from 60-minute pivot highs and pivot lows using a 3-bar left / 3-bar right pivot structure. When a pivot high is confirmed, the area between the candle's high and the top of its body becomes a supply zone (red). When a pivot low is confirmed, the area between the candle's low and the bottom of its body becomes a demand zone (green). Zones extend forward in real time and are automatically removed when price closes beyond the zone boundary or when the zone exceeds a configurable age limit (default: 500 bars). Only the 3 most recent zones per side are kept to avoid chart clutter.
Confluence Scoring (signal filter)
When price enters a fresh (unused) zone, the indicator checks up to 5 independent factors before printing a signal:
1. Volume delta direction — estimated from the bar's close position within its range. A buy signal requires positive delta; a sell signal requires negative delta.
2. VWAP proximity — whether price is near the session VWAP (within 0.15% of current price).
3. Key level proximity — whether price is near a relevant prior-session level (PDH, PDL, PMH, PML).
4. POC proximity — whether price is near the intraday volume Point of Control.
5. VWAP trend bias — whether price is on the "right side" of VWAP for the signal direction (buy below VWAP, sell above).
Each matching factor adds 1 to the score. The signal label displays the count (e.g., "Buy 4/5") so traders can see at a glance how many factors aligned. A configurable cooldown (default: 12 bars) prevents repeated signals in the same area. An additional filter requires bearish candle close for sells and bullish candle close for buys.
Note: The confluence score is simply a count of how many factors happen to align at the moment of zone contact. A higher count does not predict or guarantee a successful trade. It is a filtering tool, not a performance metric.
SESSION LEVELS & KEY LEVELS
The indicator tracks and displays levels from multiple sessions:
- London session high/low — plotted as live-updating steplines during the session, then held after session close.
- Asia session high/low — same behavior, off by default.
- Key levels drawn as dashed horizontal lines: Previous Day High/Low/Close (PDH/PDL/PDC), Pre-Market High/Low (PMH/PML), Previous Week High/Low (PWH/PWL), Overnight High/Low (ONH/ONL), and the RTH Opening Print. All are off by default and individually toggleable.
Previous day and week values use request.security() with a offset and lookahead_on, which is the standard method to reference the prior completed period without future data leakage.
ADDITIONAL TOOLS (all off by default)
- VWAP — standard session-anchored VWAP using ohlc4 as source.
- POC — intraday volume Point of Control calculated by distributing each bar's volume into a 100-bin histogram across the RTH price range, then finding the bin with the highest accumulated volume. Resets daily.
- Fair Value Gaps — bullish and bearish imbalances detected when a gap exists between bar 's low and bar 's high (or vice versa), filtered by a minimum percentage size (default: 0.15%). FVGs auto-expire after 40 bars. Maximum 6 active FVGs.
- Opening Range — plots the RTH opening range as a box (15 or 30 minute, configurable). Extends through the session.
WHY THIS COMBINATION
Most zone-based approaches generate signals every time price touches a zone, regardless of context. This indicator addresses that by requiring zone contact AND directional volume AND candle confirmation before printing anything, then layering additional context (VWAP, key levels, POC) as a visible confluence count. The result is fewer signals that occur only at zones where multiple independent references happen to converge.
The session levels (London, Asia, pre-market, overnight) are included because futures often react at session boundaries, and having them as toggleable overlays avoids needing separate indicators cluttering the chart.
HOW TO USE
1. Apply to a 1-15 minute intraday futures chart (defaults tuned for NQ on 5 min).
2. Adjust "Min Zone Size" for your instrument (NQ: 20-50 pts, ES: 5-15 pts).
3. Watch for Buy/Sell labels at zone touches. Higher confluence counts (4/5, 5/5) mean more factors aligned — use your own judgment on whether the context supports a trade.
4. Toggle key levels on/off depending on which session references matter to your trading approach.
5. All features are independently toggleable. Start with zones + signals, then add levels as needed.
DEFAULT SETTINGS
- Zones: ON, min size 20 pts, max age 500 bars
- Signals: ON, cooldown 12 bars, volume delta confirmation ON
- London session levels: ON
- All other levels and tools: OFF
LIMITATIONS
- Volume delta is estimated from bar close position within range — it is not true order flow data.
- POC uses a 100-bin histogram which is an approximation, not tick-level volume profile.
- Confluence scoring counts factor alignment but does not predict outcomes. Past confluence patterns do not guarantee future results.
- Zone detection has a 3-bar lag due to pivot confirmation.
- Designed for futures instruments. Adjust zone size settings for other markets.
指标

指标

MTF MA Ribbon🌟 MTF MA Ribbon
Hello everyone! I am excited to present the MTF MA Ribbon, a highly customizable indicator designed to bring trend following, crossover strategies, and dynamic support/resistance analysis under one roof.
This tool is specifically crafted for traders who want to monitor multiple moving averages across different timeframes on a single chart without dealing with cluttered or complex code.
🚀 Key Features:
5 Independent Moving Averages: Add up to 5 different MAs to your chart simultaneously from a single indicator. Easily toggle them on or off based on your needs.
Wide Range of MA Types: Choose from 8 different types, including SMA, EMA, WMA, VWMA, RMA, HMA, TEMA, and Tilson T3. (A dedicated T3 Volume Factor setting is included for Tilson T3 users).
Multi-Timeframe (MTF) Support: Select an independent timeframe for each moving average. For example, track 4-hour and Daily MAs while trading on a 15-minute chart.
Extra Smoothing: Reduce signal noise by adding a secondary smoothing filter (SMA, EMA, WMA) to any of your MAs.
🛠️ How to Use:
General Settings: Activate up to 5 MAs and define the type, source, and timeframe for each.
Bollinger / Keltner Panel: Use the "Target MA" option to select which moving average should act as the centerline for your bands (e.g., a Keltner Channel centered on MA 3).
Trend Identification: Determine the primary trend direction by observing the relationship between short-period (e.g., MA 1 & 2) and long-period (e.g., MA 4 & 5) averages.
Crossovers: Capture Golden Cross or Death Cross signals from a broader perspective using the MTF functionality.
Dynamic Support/Resistance: Use averages like TEMA or Tilson T3—especially when set to higher timeframes (4H or 1D)—as dynamic zones where price is likely to react.
📜 Technical Details:
The script is written in Pine Script v6 with the latest performance optimizations. When fetching MTF data, the request.security function is configured securely, offering the option to wait for bar closure to prevent repainting, or to track data in real-time based on your preference.
Integrate this indicator into your strategies to boost your analytical power while keeping your charts clean. Don't forget to boost and support if you find it helpful! I look forward to your comments and suggestions for future improvements. Safe trading! 📊📈
指标

指标

指标

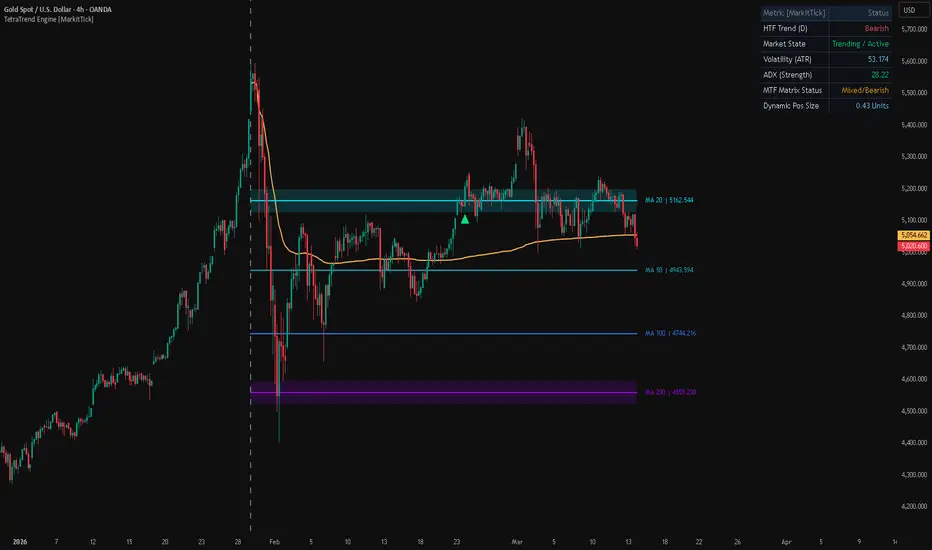
TetraTrend Engine [MarkitTick]💡 The TetraTrend Engine is an advanced, multifaceted overlay indicator designed to provide traders with a comprehensive view of market structure, trend direction, and institutional liquidity levels. By capturing and freezing critical moving average data at a user-defined moment in time, it transforms lagging indicators into static support and resistance frameworks. Furthermore, it integrates a sophisticated Multi-Timeframe (MTF) confluence matrix, ADX-based chop filtering, and dynamic position sizing, making it a complete suite for methodical trade execution. Please note that if applied to non-standard charts (like Heikin Ashi or Renko), the script's calculations may repaint.
✨ Originality and Utility
Standard moving averages constantly adjust to new price data, which is useful for trailing trends but less effective for identifying historical break-and-retest zones. This script introduces a novel "Freeze Point" mechanic. At a specific, fixed date and time, the engine captures the exact values of four distinct moving averages and the Average True Range (ATR). These values are then projected forward as horizontal levels, creating a persistent architectural map of the market based on a fundamental historical event (like an earnings report, macroeconomic news release, or structural pivot). Combined with an Auto-Anchored VWAP that automatically initiates from this exact freeze date, it offers a highly unique, institutional-grade perspective on volumetric average price versus static historical momentum.
🔬 Methodology and Concepts
● Core Trend Identification
The indicator calculates four separate moving averages, with default lengths of 20, 50, 100, and 200.
Users can toggle the calculation method between Simple (SMA), Exponential (EMA), Weighted (WMA), and Volume-Weighted (VWMA) moving averages.
● The Freeze Engine
A timestamp is set by the user (defaulting to a specific date like "2025-12-31 23:59").
Once the market time crosses this threshold, the script triggers a state where calculations are locked.
It records the exact values of the four MAs and the 14-period ATR at that exact candle.
● Institutional Confluence and Risk Matrix
The script checks higher timeframe (HTF) trend alignment using a primary HTF filter (defaulting to Daily).
An optional MTF Matrix requires alignment across three custom timeframes (e.g., 240m, Daily, Weekly) before validating any bullish signals.
It incorporates an ADX threshold (default 20.0) to filter out choppy, ranging markets, ensuring signals are only generated during periods of active momentum.
🎨 Visual Guide
● Chart Overlays and Lines
MA 1 (Length 20): Plotted in bright Cyan (#00E5FF).
MA 2 (Length 50): Plotted in Teal (#14B5CB).
MA 3 (Length 100): Plotted in Royal Blue (#2979FF).
MA 4 (Length 200): Plotted in Purple (#AA00FF).
Freeze Marker: A vertical line (default Dashed, colored Gray/Blue) denotes the exact moment the historical levels were captured.
Anchored VWAP: If enabled, an Orange line (#FFB74D) plots the volume-weighted average price starting precisely from the Freeze Marker.
● Dynamic Liquidity Zones
If enabled, semi-transparent shaded bands appear around Frozen Level 1 and Frozen Level 4.
These bands represent a distance of 0.5 * Frozen ATR, illustrating expected volatility boundaries at the time of the freeze.
● Analytics Dashboard
A heads-up display table is drawn in the top-right corner, displaying a dark theme with blue/gray borders.
It lists the HTF Trend Status (Bullish in Green, Bearish in Red).
It displays the current Market State (Trending/Active vs. Chop/Low Vol) based on the ADX.
It shows current Volatility (ATR) and ADX Strength.
If enabled, it outlines the MTF Matrix Status and the mathematically calculated Dynamic Position Size.
● Signal Shapes and Labels
A green triangle pointing up (#00E676) plots below the bar when a valid Long signal is generated.
Dynamic labels attach to the right side of the frozen levels, constantly updating to show the MA length and exact price level.
📖 How to Use
● Setting the Anchor
Identify a major market event on your chart (a swing high/low, a CPI data release, or a sudden volume spike).
Open the settings and input the exact date and time of this event into the "Fixed Date/Time (Freeze Point)" input.
● Interpreting Signals
Wait for the market to interact with the freshly drawn horizontal frozen levels.
A valid Long signal (Green Triangle) will only trigger if: the price crosses above Frozen Level 1, the HTF trend is bullish, the market is not ranging (ADX > threshold), and the optional MTF matrix is fully aligned.
Monitor the Analytics Dashboard table to ensure the broader market environment supports the trade setup.
⚙️ Inputs and Settings
• Moving Average Settings
Length 1 through 4: Adjust the lookback periods for the core trend calculation.
MA Type: Dropdown to select the mathematical smoothing method (SMA, EMA, WMA, VWMA).
• Advanced Filters & Risk
Primary HTF Filter: Determines the baseline higher timeframe to establish the primary trend direction.
ADX Chop Filter Threshold: Sets the minimum ADX value required to consider the market "trending" rather than "ranging".
Risk/Reward Ratio: A multiplier used to automatically calculate Take Profit 1, 2, and 3 targets based on the dynamically calculated Stop Loss distance.
• Institutional Features (Optional)
Enable Auto-Anchored VWAP: Anchors a VWAP strictly starting from the chosen Freeze Date.
Enable MTF Confluence Matrix: Requires alignment across three separate, user-defined timeframes.
Enable Dynamic Position Sizing: Inputs for Account Size ($) and Risk Per Trade (%). The script uses the ATR-based stop loss to output exact contract/share sizing required to maintain strict risk parameters.
🔍 Deconstruction of the Underlying Scientific and Academic Framework
The TetraTrend Engine leverages several established quantitative and statistical concepts to derive its signals. Moving averages serve as low-pass filters, dampening high-frequency market noise to reveal the underlying directional component of the time series. By capturing these values statically at a user-defined vector (the Freeze Point), the script transitions from dynamic time-series analysis to fixed architectural support/resistance theory, positing that historical mean values at critical temporal nodes retain psychological and institutional relevance.
Furthermore, the integration of the Average Directional Index (ADX) relies on the statistical measurement of trend velocity and momentum dispersion. The ADX component acts as a volatility gatekeeper, mathematically ensuring that the standard deviation of directional movement exceeds a baseline threshold before capital is deployed. Position sizing calculations utilize the Average True Range (ATR)—a measure of absolute price dispersion—to dynamically scale risk exposure inversely to market volatility, ensuring normalized risk parity across varied market environments.
⚠️ Disclaimer
All provided scripts and indicators are strictly for educational exploration and must not be interpreted as financial advice or a recommendation to execute trades. I expressly disclaim all liability for any financial losses or damages that may result, directly or indirectly, from the reliance on or application of these tools. Market participation carries inherent risk where past performance never guarantees future returns, leaving all investment decisions and due diligence solely at your own discretion. 指标

指标

指标

指标
指标

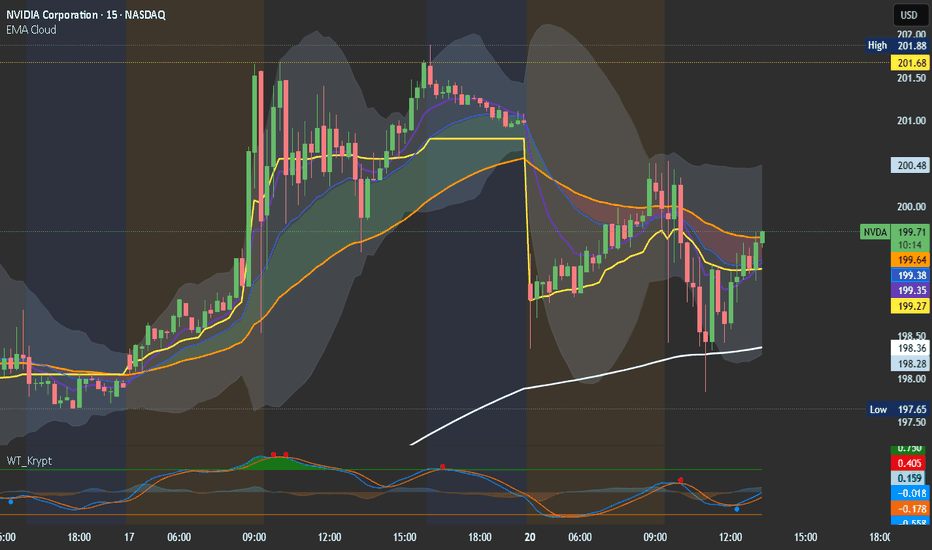
Magnet Map: AVWAP + Locked HVNs & LVNsMagnet Map: AAVWAP + Locked HVNs & LVNs
Magnet Map is a price-structure indicator designed to reveal where the market is statistically most likely to pause, react, or accelerate. It combines Daily VWAP, High-Volume Nodes (HVNs), and Low-Volume Nodes (LVNs) into a clean visual map of intraday “price magnets” and liquidity voids.
The indicator is intended to do one thing: highlight where price is likely to gravitate toward and where it may move quickly through to better gauge breakouts versus false flags that end up reversing.
Core Concepts:
All calculations work across all timeframes, but given its VWAP-focused nature, 5M, 15M, 30M and 1H charts work best, but has toggle features for everything, including number of bars or minutes to look back.
VWAP is auto anchored to the start of each day.
High-Volume Nodes (HVNs)
HVNs represent price levels where large amounts of volume have traded within the customized lookback window. The indicator identifies HVNs by scanning historical volume distribution and selecting the highest-volume price bins. (Not as accurate as real GEX/VEX data as it's not retrievable by TradingView just yet), but it has given a close approximation for much of my trading which has helped avoid making scalp plays only to see the setup invalidated by a key price point, i.e. SPY at $675, QQQ at $600, NVDA at $190, etc.
For anyone unfamiliar, these areas tend to act as price magnets where market makers either absorb the momentum, or have to buy back in, creating a gamma flip/squeeze-like condition.
Key features:
• Adjustable number of HVNs
• Optional strike-price snapping to round levels
• Minimum spacing logic to prevent clustering
• Optional zone bands based on ATR
Low-Volume Nodes (LVNs)
LVNs represent thinly traded areas, and for anyone unfamiliar, are usually described as liquidity gaps or air pockets.
The indicator performs the following two steps:
1. Build a Volume Distribution
The highest and lowest prices in the lookback window are found, and the entire price range is divided into a configurable number of price bins.
Each bar’s typical price (HLC3) is assigned to one of these bins, and the bar’s volume is added to that bin. (Simply put, this creates a simplified volume profile histogram of where trading activity has occurred, almost acting opposite to how a standard VRVP would make accumulate data to find high volume areas).
2. Identify Low-Volume Areas
Once the histogram is built, the script searches for bins with the lowest accumulated volume.
These bins represent price levels where very little trading occurred, which often correspond to:
• Liquidity gaps
• Fast-moving price areas
• Breakout acceleration zones
These create LVNs that signal on your chart.
3. Maintain Consistent Structure
To keep the levels it signals meaningful, readable, and not constantly moving, several filters are applied:
Zero-volume filtering (optional)
Bins with zero volume can be ignored to prevent selecting artificial gaps.
Minimum spacing rules
LVNs must be separated by a minimum distance determined by one of three modes:
• Grid multiple (based on strike increments)
• Fixed dollar distance
• ATR-based spacing
HVN separation
LVNs can optionally be prevented from appearing too close to HVNs.
4. Price Level Placement
The final LVN level is placed at the center of the selected bin.
If grid snapping is enabled, the level is rounded to the nearest strike or round price increment (e.g., $0.50, $1, $5).
Personally, I look at LVNs as the "path of least resistance;" not much price action at those levels, giving signals that nobody is going to go bankrupt if the price moves through those levels towards an HVN. HVNs are where hedge funds go bankrupt if not attended to properly, giving rise to big rejection levels as well as clearing significant breakout levels.
Level Locking
Magnet Map avoids dynamically constant shifting zones with a configurable locking logic, allowing levels to stabilize after the early session.
Lock options:
• Lock after X minutes
• Lock after X bars
• Never lock (fully dynamic)
Once locked, HVN and LVN levels remain fixed for the rest of the session.
Toggleable Filtering for Chart Clarity/Ease of Access
Grid Snap
• Optionally align levels to common strike increments ($0.50 / $1 / $2.50 / $5 etc. intended to behave as PTs with the highest OI. Can't backtest against OI directly without manually doing it, but it aligns almost perfectly with the highest volume areas on a VRVP across multiple indices and stocks, from MAG7 names to highly liquid penny stocks)
Minimum Spacing
Levels can be filtered using:
• Grid multiples
• Fixed dollar spacing
• ATR-based spacing
Zone Visualization
Each level can display an ATR-based band, creating a realistic reaction zone rather than a single line.
How To (And Who Should) Use This: Day traders and short-term options traders who want a quick view of where liquidity and structure are concentrated:
Mean Reversion when price returns to VWAP or HVN
Target Projection when price moves from an LVN toward an HVN
Support / Resistance at the HVN levels (particularly the $2.50 and $5 spacing for indices and other big names)
Breakout Validation when price either enters an LVN or clears a previously rejected HVN. 指标

指标
SMC Crypto Swing Sniper (MTF Edition)The "SMC Crypto Swing Sniper" is an hybrid trading system. It´s evolved it from a pure price-action script into a data-driven order flow and momentum powerhouse.
1. The Macro Compass (Trend & Momentum)
Moving away from guessing candle patterns to using hard data:
The 4H Dashboard: Tracks Bitcoin, BTC Dominance, USDT Dominance, and your current ticker on a fixed 4H basis. It combines Trend (EMA crossover), RSI, MACD, and ADX/DMI. This instantly tells you if the market has real momentum (BULL/BEAR when ADX > 25) or is just chopping sideways (WEAK when ADX < 25).
Fixed Moving Averages: The 4H EMA 50, 4H WMA 200, and the Monthly VWAP dictate your overall macro bias. They are your ultimate directional filter (e.g., only look for long setups if the price is above these levels).
2. The Battlefield (SMC Zones & S/R)
This is the Price Action core that tells you exactly WHERE to look for trades:
Static 1H Price Filter: Three horizontal lines (Resistance / Mid / Support) that strictly lock onto the high, low, and average of the last 50 hours, regardless of what timeframe you are currently viewing. This is your local playing field.
Clean Order Blocks & FVGs: The script dynamically draws institutional zones with an elegant 80% transparency and no borders. They auto-delete to keep your chart clean only when truly invalidated (price breaking completely through an OB or fully filling a gold FVG).
Market Structure: Automated BOS (Break of Structure) and CHoCH (Change of Character) lines pinpoint local trend shifts.
3. The Order Flow Trigger (Sniper Execution)
Here, we measure real money exchanging hands to time the entry:
Whale Volume: Candles paint white when the volume spikes 200% above the 20-period moving average, highlighting Smart Money stepping in.
Rolling CVD (Cumulative Volume Delta): Your strongest weapon. Instead of endlessly adding volume history, it uses a rolling 21-bar period with a sharp sensitivity (Fractal = 2). When price makes a new low, but selling pressure is visibly dying out in the CVD, the script prints a Divergence Arrow. This is your early warning system!
Your Trading Workflow Summarized:
Check the Dashboard/MAs for direction -> Wait for price to tap an SMC Zone or 1H S/R line -> Pull the trigger when CVD Divergence or Whale Volume confirms the reversal. 指标

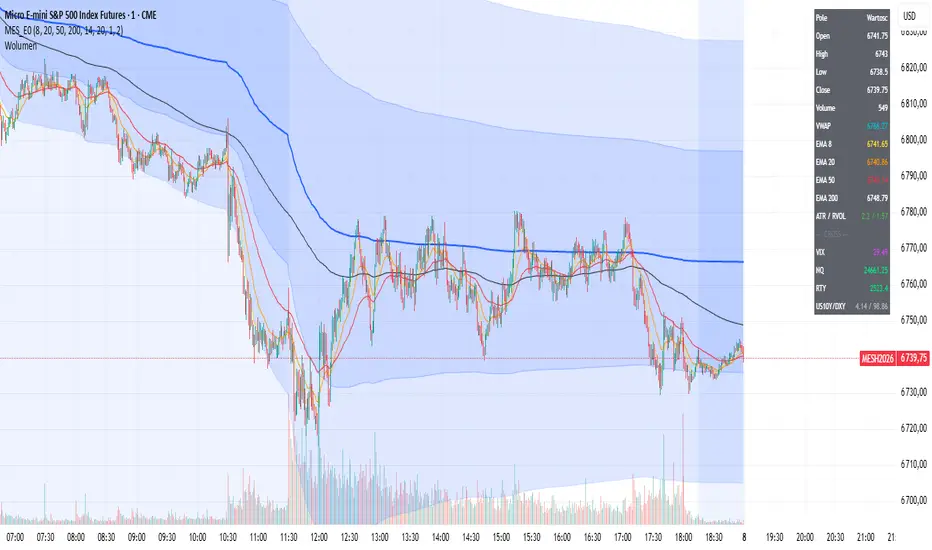
MES Etap 0EN:
One indicator replacing seven. Designed for learning to read the market and exporting clean data for AI analysis.
What's inside:
Session VWAP with standard deviation bands (1σ, 2σ)
EMA 8, 20, 50, 200 with proper column names in CSV export
ATR(14) and RVOL (relative volume) in Data Window
Cross-asset data: VIX, NQ, RTY, US10Y, DXY on every candle
Live data table in the top-right corner (optional)
Why this exists:
TradingView's CSV export labels default EMA indicators as "Plot". Four EMAs = four "Plot" columns and you can't tell which is which. This indicator solves that: every column has a readable name (EMA_8, EMA_20, VWAP, ATR_14, VIX, NQ...). One export = complete data record ready for analysis.
Who it's for:
MES/ES traders building an R&D system with AI. Readers of the "Bractwo Rynku" book series. Anyone who wants clean, labeled data exports from TradingView.
Editable parameters:
EMA, ATR, RVOL periods, VWAP band multipliers, toggle table and bands on/off.
Takes 1 indicator slot. On Essential plan (limit 5) you still have room for Volume and more.
Open source. Repo: github.com/Badmike81/bractworynku-etap0
指标

指标

指标

策略

OB + Big Trades Signal# OB + Big Trades Signal Indicator
## Overview
The **OB + Big Trades Signal** indicator combines three powerful concepts into a single, clean signal layer: **Volume-based Order Blocks**, a **Big Trades (Whale) Detector**, and a **Daily VWAP filter**. A signal is only generated when all three conditions align — significantly reducing noise and increasing the quality of each entry.
---
## How It Works
### 1. Order Blocks with Volume
Order Blocks are price zones where a consolidation phase was followed by a strong breakout candle with above-average volume. These zones represent areas where institutional participants placed significant orders, and price tends to react when revisiting them.
- **Bullish Order Block** — forms when a consolidation is broken to the upside with high volume. Marks potential support / demand zones.
- **Bearish Order Block** — forms when a consolidation is broken to the downside with high volume. Marks potential resistance / supply zones.
Order Blocks are automatically removed ("mitigated") when price trades through them, keeping the chart clean and relevant.
### 2. Big Trades Detector
The Big Trades component analyzes intrabar volume intensity using a statistical model. It splits each candle's volume into estimated **buy pressure** and **sell pressure** based on the candle's close position within its range. A trade is classified as a "Big Trade" when its volume deviates significantly from the recent average — specifically beyond a configurable multiple of the standard deviation (sigma).
- **Big Buy** — abnormally high buying pressure on the current bar
- **Big Sell** — abnormally high selling pressure on the current bar
Three tiers of intensity are detected (T1, T2, T3), with T3 representing the most extreme whale activity.
### 3. Daily VWAP Filter
The Volume Weighted Average Price (VWAP) resets every day at 00:00 UTC. It acts as a directional bias filter:
- Price **above** VWAP → bullish bias → only Long signals are allowed
- Price **below** VWAP → bearish bias → only Short signals are allowed
---
## Signal Logic
| Signal | Conditions Required |
|--------|-------------------|
| **LONG** | Big Buy detected + Price near/inside a Bullish Order Block + Price above Daily VWAP |
| **SHORT** | Big Sell detected + Price near/inside a Bearish Order Block + Price below Daily VWAP |
All three conditions must be true simultaneously for a signal to appear.
---
## Settings
### Order Blocks
| Parameter | Description |
|-----------|-------------|
| Consolidation Lookback | Number of bars to evaluate for consolidation detection |
| Breakout Threshold % | Minimum breakout strength required to form an Order Block |
| Maximum Order Blocks | Maximum number of active Order Blocks shown on the chart |
| OB Proximity % | How close (in %) price must be to an Order Block to trigger a signal |
### Volume (Order Blocks)
| Parameter | Description |
|-----------|-------------|
| Volume Calculation Method | Simple, Relative, or Weighted volume comparison |
| Volume Lookback Period | Lookback for average volume calculation |
| Volume Threshold Multiplier | Minimum volume multiple required to confirm an Order Block |
### Big Trades Detector
| Parameter | Description |
|-----------|-------------|
| Lookback Period | Baseline period for statistical volume analysis |
| Sensitivity (Sigma) | Standard deviation multiplier — higher = fewer but more extreme signals |
### VWAP & Display
| Parameter | Description |
|-----------|-------------|
| Show Daily VWAP | Toggle VWAP line visibility |
| VWAP Color | Color of the VWAP line |
| Show Order Blocks | Toggle Order Block boxes on/off |
### Signal Labels
| Parameter | Description |
|-----------|-------------|
| Long / Short Label Color | Background color of the signal label |
| Long / Short Text Color | Text color of the signal label |
| Label Size | Tiny / Small / Normal / Large / Huge |
| Background Highlight | Tints the bar background when a signal fires |
### Alert Options
| Parameter | Description |
|-----------|-------------|
| Signal Direction | Filter alerts to Long + Short, Only Long, or Only Short |
| Push Notification | Sends a push alert via `alert()` directly — no manual alert setup needed |
| Enable Time Window | Restricts alerts to a defined time range |
| From / To Hour & Minute (UTC) | Start and end of the active alert window in UTC |
> **Time zone note:** The time window runs in UTC. Adjust for your local time zone when setting the hours (e.g. CET = UTC+1, so subtract 1 hour).
---
## Alerts Available
The indicator provides **9 alert conditions** selectable in the TradingView alert dialog:
1. `LONG – OB + Big Buy + VWAP` — Full Long signal (all filters active)
2. `SHORT – OB + Big Sell + VWAP` — Full Short signal (all filters active)
3. `Signal (Long or Short)` — Either direction
4. `Big Buy detected (unfiltered)` — Big Buy only, no OB/VWAP filter
5. `Big Sell detected (unfiltered)` — Big Sell only, no OB/VWAP filter
6. `Price in Bullish OB Zone (above VWAP)` — Price enters demand zone
7. `Price in Bearish OB Zone (below VWAP)` — Price enters supply zone
8. `Price crosses VWAP upward` — Bullish VWAP crossover
9. `Price crosses VWAP downward` — Bearish VWAP crossover
All signal alerts include an **anti-spam filter** — each alert fires only once per bar regardless of how many ticks meet the condition.
---
## Tips & Recommendations
- **Timeframe:** Works best on 5m–1h charts. Lower timeframes produce more signals; higher timeframes produce fewer but more significant ones.
- **Sensitivity tuning:** Start with Sigma = 3.0. Increase to 3.5–4.0 for stricter, less frequent signals. Decrease to 2.0–2.5 for more activity.
- **OB Proximity:** Set tighter (0.05–0.10%) for precise entries, wider (0.20–0.30%) if you want signals slightly ahead of the zone.
- **Push alerts:** Enable the Push Notification toggle and set your time window to only receive alerts during your active trading hours — no noise outside your session.
- **Combine with trend context:** For best results, trade Long signals during uptrends and Short signals during downtrends on a higher timeframe.
---
## Disclaimer
This indicator is a tool to assist analysis and does not constitute financial advice. Past signal performance is not indicative of future results. Always use proper risk management.
指标