指标

Accordion Index (Swing-Based) Structural Market Regime AnalysisThe Accordion Index is a multi-dimensional market structure indicator designed to diagnose regime formation, expansion, compression, and transition phases across financial markets. Rather than generating isolated buy/sell signals, it provides contextual insight into how price, structure, and participation interact over time.
The indicator is based on a swing-based, multi-leg framework, which reflects how markets naturally alternate between expansion, correction, re-expansion, and resolution phases. These repeating swing sequences form the foundation of both classical cycle analysis and Elliott Wave structures.
By quantifying the internal quality of these swing structures, the Accordion Index evaluates whether price movements are structurally aligned, directionally efficient, and institutionally supported.
Core Components
The indicator consists of three complementary components:
1) Accordion Correlation (Blue Line) Structural Alignment
Measures the degree of synchronization between short-term swing behavior and the dominant higher-timeframe regime.
Rising values indicate increasing structural coherence.
Declining values reflect regime decay and fractal misalignment.
This component highlights whether market movements are organized within a broader cycle structure or fragmented across timeframes.
2) Efficiency (Green Line) Directional Progress
Measures how much net directional displacement price achieves relative to its internal movement.
Rising values indicate clean, trend-supportive movement.
Falling values reflect consolidation, churn, or distribution.
This component distinguishes productive trends from sideways or internally conflicted phases.
3) Average Swing Speed (Red Line) Participation and Energy
Measures the velocity and urgency of swing movements.
Rising values indicate strong institutional and speculative engagement.
Declining values suggest fading participation or exhaustion.
This component reflects whether major capital is actively sponsoring price movement.
Regime Thresholds
Two reference levels provide structural context:
Directional Regime (+0.5, Blue Dashed Line)
Identifies mature directional regimes with strong structural coherence, typically associated with sustained trend phases.
Strong Accordion (–0.5, Purple Dashed Line)
Marks extreme structural dislocation, often occurring during crisis periods, panic phases, or major regime breakdowns.
Interpreting the Accordion Index
The indicator should be interpreted as a regime and structure filter rather than a standalone signal generator.
Typical configurations include:
Rising correlation, rising efficiency, rising speed
=Trend expansion and regime confirmation
Rising correlation, falling efficiency, elevated speed
=Compression and accumulation/distribution
Falling correlation and efficiency with unstable speed
=Regime decay and transition
Simultaneous recovery in correlation and efficiency
=Structural re-synchronization and trend re-emergence
These configurations allow traders to assess whether markets are trending, consolidating, transitioning, or reorganizing internally.
Market-Agnostic and Fractal Design
The Accordion Index is market-agnostic and fractal in nature. It can be applied to:
FX, commodities, indices, equities, and crypto
Intraday, swing, and long-term timeframes
The underlying swing structure exists in all sufficiently liquid markets. Differences in behavior are reflected through changes in structural coherence, efficiency, and participation rather than through pattern distortion.
The indicator therefore adapts naturally to different asset classes and volatility regimes.
Integration with Cycle and Wave Analysis
The Accordion Index is designed to complement, not replace, existing analytical frameworks.
Cycle Analysis
It can be used to validate cycle phases by confirming whether internal structure supports expansion, compression, or transition scenarios.
Elliott Wave Analysis
The indicator aligns naturally with Elliott Wave principles by evaluating the quality of impulsive and corrective phases:
Impulsive waves typically show rising correlation, efficiency, and speed.
Corrective waves tend to display falling efficiency and structural fragmentation.
Wave extensions and failures are often preceded by changes in internal alignment.
This makes the Accordion Index a valuable supplemental tool for confirming wave counts and identifying regime exhaustion or re-synchronization.
Practical Usage
The Accordion Index functions best as a contextual filter:
High structural alignment = trust trend structure
Low efficiency = expect consolidation
Low participation = avoid forcing trades
Trades and projections should be executed in alignment with prevailing structural conditions rather than isolated price patterns.
Disclaimer
This indicator is intended for educational and analytical purposes. It does not constitute financial advice. All trading decisions remain the responsibility of the user.
Closing Note
The Accordion Index is designed to visualize how markets organize, exhaust, compress, and re-synchronize over time. By integrating structural alignment, directional efficiency, and participation dynamics, it provides a unified framework for understanding market regimes across asset classes and timeframes. 指标

指标

Adaptive Kinetic Ribbon [QuantAlgo]🟢 Overview
The Adaptive Kinetic Ribbon indicator synthesizes price velocity and volatility dynamics to identify trend direction, momentum strength, and acceleration phases across varying market conditions. It combines velocity-based momentum measurement, adaptive volatility weighting, dual-speed ribbon analysis, and acceleration-deceleration detection into a unified visual system that quantifies periods of sustained directional movement and momentum shifts, helping traders and investors identify trend continuation and reversal signals across various timeframes and asset classes.
🟢 How It Works
The indicator's core methodology lies in its adaptive kinetic approach, where velocity and volatility components are calculated dynamically and then smoothed through an adaptive alpha mechanism.
First, Velocity is measured to capture raw directional momentum by calculating the net price change over the lookback period:
velocity = source - source
This creates a momentum vector that quantifies how far and in which direction price has moved, providing the foundation for understanding trend strength and establishing whether the market is in a sustained directional phase.
Then, Volatility is computed to evaluate price variability and market noise by analyzing the standard deviation of bar-to-bar price changes:
volatility = ta.stdev(source - source , length) * mult
The volatility sensitivity multiplier allows traders to adjust how responsive the indicator is to market noise, with higher values creating faster adaptation during volatile periods and lower values maintaining stability during choppy conditions.
Next, Adaptive Alpha is calculated to create a dynamic smoothing coefficient that automatically adjusts based on the relationship between velocity and volatility:
adaptive_alpha = math.abs(velocity) / (math.abs(velocity) + volatility)
This alpha value ranges from 0 to 1, where values closer to 1 indicate strong, clear directional movement (high velocity relative to volatility), causing the indicator to respond quickly, while values closer to 0 indicate noisy, range-bound conditions (high volatility relative to velocity), causing the indicator to smooth more heavily and filter out false signals.
Following this, the Kinetic Line is constructed using exponential smoothing with the adaptive alpha coefficient:
var float kinetic_line = na
kinetic_line := na(kinetic_line ) ? source : kinetic_line + adaptive_alpha * (source - kinetic_line )
This creates an adaptive moving average that automatically adjusts its responsiveness: during strong trends with clear velocity, it tracks price closely like a fast EMA; during choppy, volatile periods, it smooths heavily like a slow SMA, providing optimal trend identification across varying market regimes without manual parameter adjustment.
Then, Ribbon Lines are generated by applying additional moving average smoothing to the kinetic line at two different speeds:
ribbon_fast = ma(kinetic_line, ribbon_fast_length, ma_type)
ribbon_slow = ma(kinetic_line, ribbon_slow_length, ma_type)
The dual-ribbon structure creates a visual envelope around the kinetic line, where the fast ribbon responds quickly to kinetic changes while the slow ribbon provides trend confirmation, with crossovers between these ribbons generating primary trend reversal signals.
Finally, Trend State and Acceleration are determined by analyzing the relative positioning and directional movement of the ribbon lines:
trend_up = ribbon_fast > ribbon_slow
acceleration = ribbon_fast > ribbon_fast
ribbonColor = trend_up ?
acceleration ? bullAccel : bullDecel :
not acceleration ? bearAccel : bearDecel
This creates a four-state classification system that distinguishes between bullish acceleration (uptrend strengthening), bullish deceleration (uptrend weakening), bearish acceleration (downtrend strengthening), and bearish deceleration (downtrend weakening), providing traders with nuanced momentum insights beyond simple bullish/bearish binary signals.
🟢 Signal Interpretation
▶ Bullish Acceleration (Bright Green): Fast ribbon above slow ribbon AND fast ribbon rising, indicating confirmed uptrend with building momentum = Strongest bullish condition, ideal for new long entries, adding to positions, or holding existing longs with confidence
▶ Bullish Deceleration (Dark Green): Fast ribbon above slow ribbon BUT fast ribbon falling, indicating uptrend intact but momentum weakening = Caution signal for longs, potential trend exhaustion developing, consider tightening stops or taking partial profits
▶ Bearish Acceleration (Bright Red): Fast ribbon below slow ribbon AND fast ribbon falling, indicating confirmed downtrend with building momentum = Strongest bearish condition, ideal for new short entries, exiting longs, or maintaining defensive positioning
▶ Bearish Deceleration (Dark Red): Fast ribbon below slow ribbon BUT fast ribbon rising, indicating downtrend intact but momentum weakening = Caution signal for shorts, potential trend exhaustion developing, prepare for possible reversal or consolidation
▶ Bullish Crossover: Fast ribbon crosses above slow ribbon, signaling trend reversal from bearish to bullish and initiation of new upward momentum phase = Primary buy signal, entry opportunity for trend-following strategies, exit signal for short positions
▶ Bearish Crossover: Fast ribbon crosses below slow ribbon, signaling trend reversal from bullish to bearish and initiation of new downward momentum phase = Primary sell signal, entry opportunity for short strategies, exit signal for long positions
▶ Ribbon Spread Width: Distance between fast and slow ribbons indicates trend strength and conviction, where wider spreads suggest strong, sustained directional movement with low reversal probability, while tight or converging ribbons indicate weak trends, consolidation, or impending reversal conditions
▶ Bar Color Alignment: When bar coloring is enabled, candlestick colors mirror the ribbon state providing immediate visual confirmation of momentum conditions directly on price action, eliminating the need to reference the indicator separately and enabling faster decision-making during active trading
🟢 Features
▶ Preconfigured Presets: Three optimized parameter configurations accommodate different trading styles, timeframes, and market analysis approaches: "Default" provides balanced trend identification suitable for swing trading on 4-hour and daily charts, "Fast Response" delivers heightened sensitivity optimized for intraday trading and scalping on 5-minute to 1-hour charts, and "Smooth Trend" offers conservative trend identification ideal for position trading and long-term analysis on daily to weekly charts.
▶ Built-in Alerts: Three alert conditions enable comprehensive automated monitoring of trend reversals and momentum transitions. "Bullish Crossover" triggers when the fast ribbon crosses above the slow ribbon, signaling the shift from downtrend to uptrend and the beginning of bullish momentum building. "Bearish Crossover" activates when the fast ribbon crosses below the slow ribbon, signaling the shift from uptrend to downtrend and the beginning of bearish momentum building. "Any Ribbon Crossover" provides a combined notification for either bullish or bearish crossover regardless of direction, useful for general trend reversal monitoring and ensuring no momentum shift goes unnoticed.
▶ Color Customization: Six visual themes (Classic, Aqua, Cosmic, Cyber, Neon, plus Custom) accommodate different chart backgrounds and visual preferences, ensuring optimal contrast and immediate identification of acceleration versus deceleration states across various devices and screen sizes. Each preset uses distinct colors for the four momentum states (bullish acceleration, bullish deceleration, bearish acceleration, bearish deceleration) with proper visual hierarchy. Optional bar coloring with adjustable transparency provides instant visual context of current momentum state and trend direction without switching between the price pane and indicator pane, enabling traders and investors to immediately assess trend positioning and acceleration dynamics while analyzing price action patterns and support/resistance levels.
指标

指标
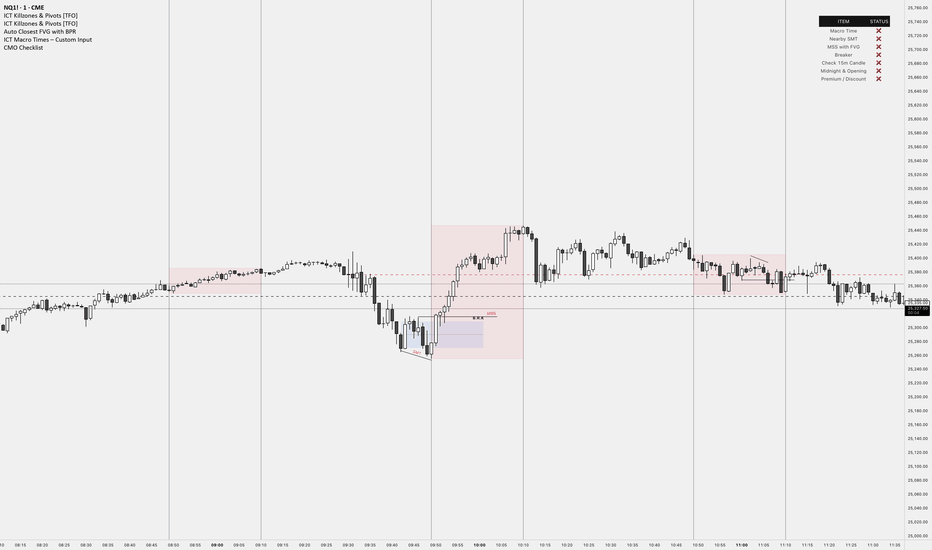
Luminous Trend Wave [Pineify]```
Luminous Trend Wave - Hull MA Based Normalized Momentum Oscillator
The Luminous Trend Wave (Pineify) is a momentum oscillator designed to provide clear, responsive trend signals while minimizing the lag commonly associated with traditional momentum indicators. By combining Hull Moving Average (HMA) calculations with ATR-based normalization and hyperbolic tangent transformation, LTW delivers a bounded oscillator that works consistently across different assets and timeframes.
Key Features
Hull Moving Average foundation for reduced lag trend detection
ATR normalization for universal applicability across all markets
Bounded output range (-100 to +100) using mathematical tanh transformation
Dynamic gradient coloring that reflects momentum intensity
Built-in signal line for momentum confirmation
Automatic alerts for trend reversals and momentum shifts
How It Works
The indicator operates through a four-stage calculation process:
Trend Basis Calculation: The indicator first calculates a Hull Moving Average (HMA) of the closing price. HMA was chosen specifically because it provides significantly less lag compared to Simple or Exponential Moving Averages while maintaining smoothness. This allows the oscillator to respond quickly to genuine price movements.
Distance Measurement: The raw distance between the current close price and the HMA trend line is calculated. This distance represents how far price has deviated from its smoothed trend.
ATR Normalization: The distance is then divided by the Average True Range (ATR) over the same lookback period. This normalization step is crucial - it makes the oscillator readings comparable across different assets regardless of their price levels or typical volatility. A stock trading at $500 and one at $5 will produce equivalent readings when their relative movements are similar.
Tanh Transformation: Finally, the normalized value is passed through a hyperbolic tangent function scaled by a sensitivity multiplier. The mathematical formula (e^2x - 1) / (e^2x + 1) naturally bounds the output between -100 and +100, preventing extreme spikes while preserving the directional information.
Trading Ideas and Insights
Zero Line Crossovers: When the oscillator crosses above zero, it indicates a shift from bearish to bullish momentum. Conversely, crossing below zero signals bearish momentum. These crossovers can be used as entry triggers when confirmed by other analysis.
Overbought/Oversold Levels: Readings above +80 suggest overbought conditions where price has extended significantly above its trend. Readings below -80 indicate oversold conditions. These extremes often precede mean reversion moves.
Signal Line Divergence: When the main oscillator (histogram) is above the signal line, momentum is increasing. When below, momentum is decreasing. This relationship helps identify the strength of the current move.
Momentum Fading: The indicator automatically fades the color intensity when the oscillator value is closer to the signal line than to the extremes, visually indicating weakening momentum before potential reversals.
How Multiple Indicators Work Together
LTW integrates three distinct technical concepts into a cohesive system:
Hull MA + ATR Integration: The Hull Moving Average provides the trend direction while ATR provides the volatility context. Together, they answer not just "where is the trend?" but "how significant is the current deviation relative to normal market movement?"
Mathematical Bounding + Visual Mapping: The tanh transformation ensures readings stay within predictable bounds, while the gradient coloring maps these bounded values to intuitive visual feedback. Strong bullish readings appear in bright green, strong bearish in bright red, with smooth transitions between.
Oscillator + Signal Line System: Similar to MACD's relationship between the MACD line and signal line, LTW uses a WMA-smoothed signal line to filter noise and confirm momentum direction. The interplay between the faster oscillator and slower signal creates actionable crossover signals.
Unique Aspects
Universal Normalization: Unlike many oscillators that produce different reading ranges on different assets, LTW's ATR normalization ensures consistent interpretation whether trading forex, crypto, stocks, or commodities.
Sensitivity Control: The sensitivity parameter allows traders to adjust how aggressively the oscillator responds to price changes. Higher values make it more responsive (useful for scalping), while lower values smooth out noise (better for swing trading).
Visual Momentum Feedback: The gradient coloring and transparency adjustments provide immediate visual feedback about trend strength without requiring traders to interpret numerical values.
How to Use
Add the indicator to your chart - it displays in a separate pane below price.
Watch for zero line crossovers as primary trend signals. Bullish when crossing above, bearish when crossing below.
Use the ±80 levels as caution zones where reversals become more likely.
Monitor the relationship between the histogram and signal line - histogram above signal indicates strengthening momentum.
Pay attention to color intensity - faded colors indicate weakening momentum and potential reversal zones.
Set alerts for automated notifications on trend changes and momentum shifts.
Customization
Trend Lookback (default: 21): Controls the HMA period. Lower values increase responsiveness but may generate more false signals. Higher values provide smoother trends but with more lag.
Signal Smoothing (default: 5): Adjusts the WMA period for the signal line. Higher values create a slower signal line with fewer crossovers.
Sensitivity (default: 1.5): Multiplier for the tanh transformation. Increase for more reactive signals, decrease for smoother readings.
Colors: Fully customizable bullish and bearish colors to match your chart theme.
Gradients: Toggle gradient coloring on/off based on preference.
Conclusion
The Luminous Trend Wave indicator offers traders a mathematically sound approach to momentum analysis. By combining the low-lag properties of Hull Moving Average with ATR-based normalization and bounded output transformation, LTW provides consistent, interpretable signals across any market. The visual feedback system makes trend strength immediately apparent, while the signal line crossovers offer clear entry and exit timing. Whether used as a standalone tool or combined with price action analysis, LTW helps traders identify trend direction, momentum strength, and potential reversal zones with clarity.
```
指标

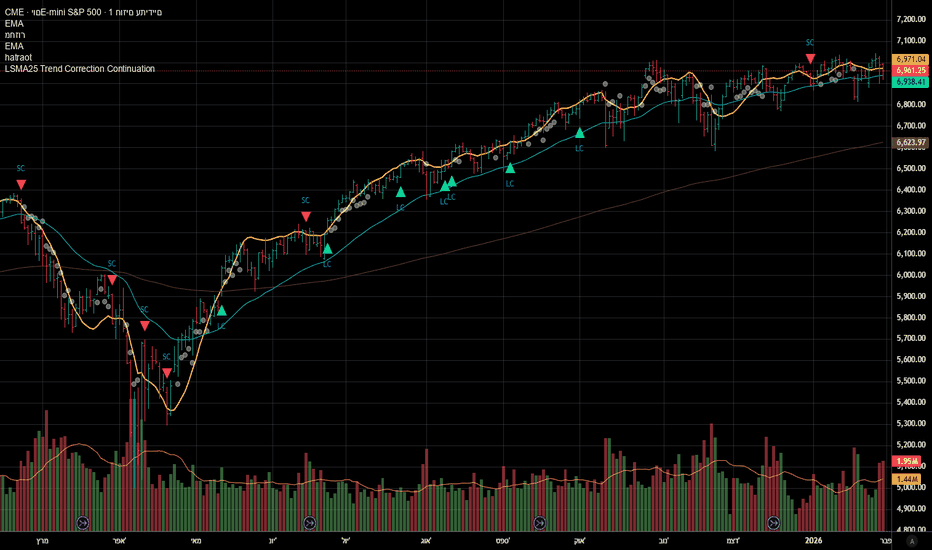
LSMA25 Trend Correction Continuation
## LSMA25 Trend Correction Continuation - Publishing Description
### Overview
This indicator highlights **trend continuation opportunities** using a **25-period LSMA (Least Squares Moving Average)** with a **slope/angle filter** and a simple **correction + re-entry** logic.
It is designed to mark:
* **Continuation entries** after a pullback (correction) and re-cross of LSMA in the direction of a strong trend
* **Strong-trend state** (subtle dots) when price stays on the trend side of LSMA with a steep angle, even without a fresh cross
### Core logic
1. **LSMA (25 by default)**
* Uses `ta.linreg(close, lsmaLen, 0)` as the LSMA line.
2. **Trend strength via angle (tick-normalized)**
* Computes 1-bar LSMA slope in **ticks**:
* `slopeTicks = (lsma - lsma ) / syminfo.mintick`
* Converts slope to an angle using `atan()` and a calibration input:
* `ticksPerBarFor45` approximates how many ticks per bar corresponds to ~45°
* Strong trend conditions:
* LONG trend strength when `angleDeg >= minAngleLongDeg`
* SHORT trend strength when `angleDeg <= minAngleShortDeg`
3. **Correction detection**
* LONG side: a correction exists if within the last `corrLookback` bars the close was **below** LSMA:
* `ta.barssince(close < lsma) <= corrLookback`
* SHORT side: correction exists if within the last `corrLookback` bars the close was **above** LSMA:
* `ta.barssince(close > lsma) <= corrLookback`
4. **Continuation signals**
* **Long Continuation (LC)** triggers when:
* Price **crosses above** LSMA (`ta.crossover(close, lsma)`)
* Angle indicates **strong uptrend**
* A recent **pullback below LSMA** occurred
* Optional ATR% filter passes
* **Short Continuation (SC)** triggers symmetrically on cross below.
5. **Strong trend markers**
* When price is on the trend side of LSMA and angle is strong:
* Uptrend: `close > lsma and strongUp`
* Downtrend: `close < lsma and strongDown`
* Drawn as small, semi-transparent circles (not entry signals by themselves).
### Plots and labels
* **LSMA line** plotted in yellow.
* **LC**: green triangle below bar (trend continuation long).
* **SC**: red triangle above bar (trend continuation short).
* **Dots**: tiny circles for strong-trend state when no fresh continuation signal is present.
### Inputs (how to tune)
* **LSMA length**
* Higher = smoother, fewer signals
* Lower = more responsive, more signals/noise
* **Ticks per bar ≈ 45°**
* Calibration control for angle scaling across different instruments/timeframes
* Increase it if angles look too “aggressive”; decrease it if angles look too “flat”
* **Min angle for LONG / Max angle for SHORT**
* Tighten to filter for only steep trends; loosen to allow more setups
* **Max correction bars back**
* Larger values allow older pullbacks to qualify
* Smaller values require a more recent correction
### Optional volatility filter (ATR%)
* When enabled, the script requires:
* `ATR% = (ATR / close) * 100 >= minAtrPct`
* Useful to avoid low-volatility chop (but can filter out valid trends on slow markets).
### How to use (practical)
* Use **LC/SC** as “trend continuation after pullback” markers:
* Prefer trading in the direction of higher timeframe bias (if applicable)
* Consider entries on LC/SC with your own risk rules (stops/targets are not included)
* Use the **strong-trend dots** as a regime filter:
* If dots persist, continuation setups have higher context quality
* If dots disappear frequently, market may be ranging/choppy
### Limitations (important)
* Angle is based on **LSMA 1-bar slope**, so it is sensitive to sudden changes and can vary across markets/timeframes.
* Correction logic is binary: it only checks whether price crossed to the other side of LSMA recently (not depth/structure of pullback).
* Signals depend on **close crossing LSMA**, not intrabar wick behavior.
* Not a full trading system: no position sizing, stops, or take profits.
### Alerts
Alerts fire only on **confirmed bars** (`barstate.isconfirmed`) for:
* “LSMA25 Long continuation”
* “LSMA25 Short continuation”
指标
指标

指标
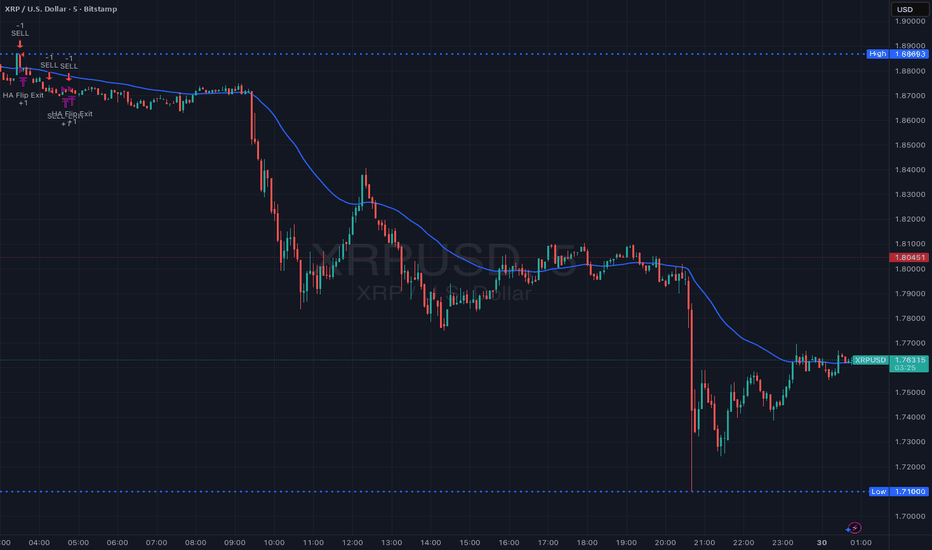
HA EMA50 Trend Filter No Chop Daily Trade LimitsThis strategy trades strong directional moves using Heikin-Ashi candle confirmation and a 50-period EMA trend filter, while aggressively avoiding consolidation. Entries occur only after two consecutive Heikin-Ashi candles close in the same direction with price on the correct side of the EMA, and are further filtered using ATR-normalized volatility, range, EMA slope, and EMA cross-chop conditions to ensure the market is actively trending. Trades are executed at the open of the next candle, managed with structure-based or fixed stop losses, an optional break-even rule, and exited on Heikin-Ashi color reversal or protective stops. To protect capital and reduce overtrading, the strategy enforces strict daily limits, allowing a maximum of five trades per symbol and automatically stopping trading after two losing trades in a single day. Designed for forex markets during active sessions, this system prioritizes clean trends and capital preservation over frequent entries. 策略
指标

指标

指标

指标

指标

指标

Hodrick-Prescott Structural CycleThis script is about solving one specific problem: Decomposition.
In any market, you have two things happening at once: the underlying "Trend" (the structural value) and the "Cycle" (the noise or volatility around that value). The Hodrick-Prescott (HP) filter is the standard econometric tool to separate them.
1. The Separation Logic (HP Filter)
Most moving averages lag. The HP filter attempts to find a smooth curve that represents the long-term path of the asset, minimizing the variance of the cycle.
In the code, the "stiffness" of this curve is controlled by Lambda ().
get_auto_lambda() =>
timeframe.isintraday ? 6250000 :
timeframe.isdaily ? 129600 :
1600
1600 is the standard used by economists for quarterly data. If the timeframe changes (daily or intraday), it automatically scales Lambda up to maintain that same "quarterly" smoothness on a faster chart.
2. The Mechanics (2-Pole Recursion)
The classic HP filter looks at future data, which is impossible for live trading. We uses a 2-Pole Super Smoother to approximate that curve using only past data.
hp_filter_2pole(src, period) =>
// ... coefficients calculated ...
var float filt = 0.0
filt := c1 * (src + nz(src )) / 2 + c2 * nz(filt ) + c3 * nz(filt )
See the filt and filt -> that's recursion. The filter references its own previous output. This creates memory, allowing the line to resist sudden spikes in price (noise) while slowly adapting to the true direction.
3. The Four Market Regimes
This script splits the market into four distinct quadrants based on where the Z-Score is and where it is going.
bool is_expansion = z_score > 0 and z_score > z_score
bool is_downturn = z_score > 0 and z_score < z_score
bool is_recovery = z_score < 0 and z_score > z_score
bool is_recession = z_score < 0 and z_score < z_score
1. Expansion (Green): We are above the trend, and momentum is accelerating.
2. Downturn (Orange): We are above the trend, but momentum is slowing (topping out).
3. Recession (Red): We are below the trend, and price is collapsing.
4. Recovery (Blue): We are below the trend, but price has stopped falling and is turning up.
The Background Zones: Statistical Extremes
This script monitors the Z-Score (the normalized cycle). When this score moves beyond 1.0 standard deviation from the mean (zero), the background lights up.
Red Background (Recession Zone): The Z-Score is < -1.0. Price is significantly below its structural trend. This is where fear is highest, and the asset is statistically "underwater."
Green Background (Overheating Zone): The Z-Score is > 1.0. Price is stretching far above the trend.
Why it matters: Markets rarely stay beyond 2.0 standard deviations for long. When you see the background colored, you are in an outlier event. (The rubber band is stretched)
Divergences: The "Check Engine" Light
It also scans for discrepancies between Price Action and the Cycle Momentum (Z-Score).
Bullish Divergence: Price makes a Lower Low, but the Cycle makes a Higher Low. The sellers are pushing price down, but with less conviction than before.
Bearish Divergence: Price makes a Higher High, but the Cycle makes a Lower High. Buyers are exhausted.
How to use this:
Do not treat a divergence tag as an entry signal.
A divergence is a state of discrepancy, not a timing trigger. It tells you that the prevailing trend is running out of steam. 指标

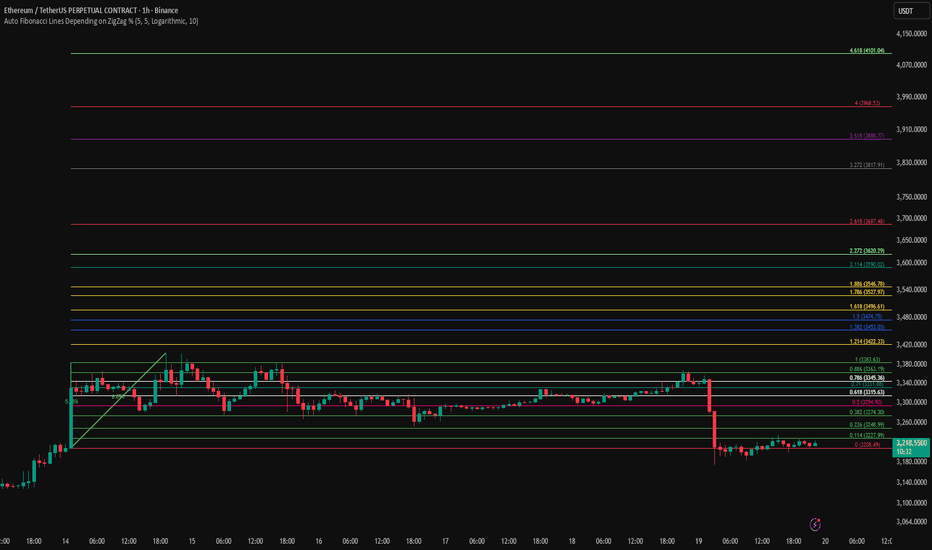
Auto Fibonacci Lines Depending on ZigZag %In the world of technical analysis, few tools are as powerful—or as misused—as Fibonacci Retracements. The Auto Fibonacci Lines Depending on ZigZag % is not just an indicator; it is a complete, automated trading system designed to eliminate subjectivity and bring institutional-grade precision to your charts.
This script automates the identification of significant market structures using a ZigZag algorithm. Once a market swing is mathematically confirmed (based on your deviation settings), it instantly projects a complete suite of Retracement and Extension levels. This allows you to stop guessing where to draw your lines and start focusing on price action.
🧠 The Logic Behind the Indicator
Understanding how your tools work is the first step to trusting them. This script operates on a three-step logic loop:
ZigZag Identification:
The script continuously monitors price action relative to the last known pivot point. It uses a user-defined Deviation % to filter out market noise. A new "Leg" is only confirmed when price reverses by this specific percentage. This ensures that the Fibonacci lines are only drawn on significant market moves, not random chop.
Automated Anchor Points:
Once a downward trend is confirmed (e.g., price drops 30% from the top), the script automatically anchors the Fibonacci tool to the Swing High (Start) and the Swing Low (End). It does this without you needing to click or drag anything.
Dynamic Cleanup:
Markets evolve. A key feature of this script is its self-cleaning mechanism. As soon as a new trend leg is confirmed, the script automatically deletes the old, invalidated Fibonacci lines and draws a fresh set for the new structure. This keeps your chart clean and focused on the now.
🎓 How to Trade This System
This indicator is color-coded to simplify your decision-making process. It moves beyond standard "rainbow" charts by categorizing price levels into three distinct actionable zones.
1. The "Reload Zone" (White Lines: 0.618 - 0.786) ⚪
Role: High-Probability Support / Entry
In institutional trading, the 0.618 (Golden Ratio) to 0.786 region is often where algorithms step in to defend a trend.
Why it works : This is the "discount" area where smart money re-accumulates positions before the next leg up.
2. The "Decision Wall" (Blue Lines: 1.382 - 1.5) 🔵
Role: Strong Resistance / Trend Check
This is a unique feature of this suite. The 1.382 and 1.5 levels often act as a "ceiling" for weak breakouts.
Strategy : If you entered in the White Zone, the Blue Zone is your first major hurdle. If price stalls here, consider securing partial profits.
Warning : A rejection from the Blue Lines often leads to a double-top formation. However, a clean break above the Blue Lines usually signals a parabolic move is beginning.
3. The "Extension Zone" (Yellow, Red, Purple > 1.618) 🟡🔴
Role : Take Profit / Exhaustion
Levels above 1.5 (starting with the 1.618 Golden Extension) are statistical extremes.
Strategy : These are Strict Take Profit levels. Do not FOMO (Fear Of Missing Out) into new long positions here. The probability of a reversal increases drastically as price climbs through these levels (2.618, 3.618, 4.618).
📐 The Mathematical Edge: Logarithmic vs. Linear
One of the most critical features of this script is the ability to toggle between Logarithmic and Linear calculations.
Why use Logarithmic?
If you are trading Crypto (Bitcoin, Altcoins) or high-growth Tech Stocks, linear Fibonacci levels are mathematically incorrect over large moves. A 50% drop from $100 is different than a 50% drop from $10.
This script calculates the percentage difference (Log Scale), ensuring your targets are accurate even during 100%+ parabolic runs.
Why use Linear?
For mature markets like Forex (EURUSD) or Indices (SPX500) where volatility is lower, Linear scaling is the industry standard.
🛠️ Configuration & Best Practices
Deviation % : This is the heartbeat of the indicator.
Swing Trading : Set to 20-30%. This filters out noise and only draws Fibs on major macro moves.
Scalping : Set to 3-5%. This will catch smaller intraday waves.
Text Place : Keeps your chart clean by pushing labels to the right, ensuring they don't overlap with the current price action.
👤 Who Is This Indicator For?
The Disciplined Trader : Who wants to remove emotional bias from their charting.
The Crypto Investor : Who needs accurate Logarithmic targets for long-term holding.
The Confluence Trader : Who combines these automated levels with Order Blocks, RSI, or Volume to find the perfect entry.
⚠️ RISK DISCLAIMER & TERMS OF USE
For Educational Purposes Only:
This script and the strategies described herein are provided strictly for educational and informational purposes. They do not constitute financial, investment, or trading advice. The "Auto Fibonacci Lines" indicator is a tool for technical analysis and should not be used as the sole basis for any trading decision.
No Guarantees:
Past performance of any trading system or methodology is not necessarily indicative of future results. Financial markets are inherently volatile, and trading involves a high level of risk. You could lose some or all of your capital.
User Responsibility:
By using this script, you acknowledge that you are solely responsible for your own trading decisions and risk management. The author assumes no liability for any losses or damages resulting from the use of this tool or the information provided. Always consult with a qualified financial advisor before making investment decisions. 指标
CVD-MACD### CVD-MACD (Research)
The CVD-MACD is a research-oriented indicator that combines Cumulative Volume Delta (CVD) with the classic MACD framework to provide insights into market momentum and potential reversals. Unlike a standard MACD based on price, this version uses CVD (the running total of buy vs. sell volume delta) as its input source, offering a volume-driven perspective on trend strength and divergences.
Key Features:
- **CVD-Based MACD Calculation**: Computes MACD using CVD instead of price, highlighting volume imbalances that may precede price moves.
- **Dual Divergence Detection**: Identifies bullish/bearish divergences on both the MACD line and histogram, with configurable pivot lookbacks and filters (e.g., momentum decay and zero-side consistency).
- **Visual Flexibility**: Toggle divergences in the indicator pane or overlaid on the main chart, with optional raw CVD line for reference.
- **Alerts**: Built-in conditions for bullish and bearish divergences to notify users of potential setups.
###This indicator is designed for research and experimentation—it's not financial advice. It performs best on liquid assets with reliable volume data (e.g., stocks, futures). I've shared this to gather community feedback: please test it thoroughly and point out any bugs, inefficiencies, or improvements! For example, if you spot issues with divergence detection on certain timeframes or symbols, let me know in the comments. Your input will help refine it.
Inspired by volume analysis techniques; open to collaborations or forks.
## User Manual for CVD-MACD (Research)
### Overview
The CVD-MACD indicator transforms traditional MACD by using Cumulative Volume Delta (CVD) as the base input. CVD accumulates the net delta between estimated buy and sell volume per bar, providing a volume-centric view of momentum. The indicator plots a MACD line, signal line, and histogram, while also detecting divergences on both the MACD line and histogram for potential reversal signals.
This manual covers setup, interpretation, and troubleshooting.
Note: This is a research tool—backtest and validate on your own data before using in live trading.
### Installation and Setup
1. **Add to Chart**: Search for "CVD-MACD (Research)" in TradingView's indicator library or paste the script into the Pine Editor and add it to your chart.
2. **Compatibility**: Works on any timeframe and symbol with volume data. Best on daily/intraday charts for stocks, forex, or futures. Avoid illiquid symbols where volume may be unreliable.
3. **Customization**: All inputs are configurable via the indicator's settings panel. Defaults are optimized for general use but can be tuned based on asset volatility.
### Input Parameters
The inputs are grouped for ease of use:
#### MACD Settings
- **Fast EMA (CVD)** (default: 12): Length of the fast EMA applied to CVD. Shorter values make it more responsive to recent volume changes.
- **Slow EMA (CVD)** (default: 26): Length of the slow EMA on CVD. Longer values smooth out noise for trend identification.
- **Signal EMA** (default: 9): Smoothing period for the signal line (EMA of the MACD line).
#### Divergence Logic (MACD Line)
- **Pivot Lookback (MACD Line)** (default: 5): Bars to look left/right for detecting pivots on the MACD line. Higher values detect larger swings but may miss smaller divergences.
- **Max Lookback Range (MACD Line)** (default: 50): Maximum bars between two pivots to consider a divergence valid. Prevents detecting outdated signals.
- **Enable Momentum Decay Filter (Histogram)** (default: false): When enabled, requires the histogram to show decaying momentum (absolute value decreasing) for MACD-line divergences to trigger.
#### Histogram Divergence
- **Pivot Lookback (Histogram)** (default: 5): Similar to above, but for histogram pivots.
- **Max Lookback Range (Histogram)** (default: 50): Max bars for histogram divergence detection.
- **Show Histogram Divergences in Indicator Pane** (default: true): Displays dashed lines and "H" labels for histogram divergences in the sub-window.
- **Show Histogram Divergences on Main Chart** (default: true): Overlays histogram divergences on the price chart with semi-transparent lines and labels.
- **Require Histogram to Stay on Same Side of Zero** (default: true): Filters divergences to only those where the histogram doesn't cross zero between pivots, ensuring consistent momentum direction.
#### Visuals (Dual View)
- **Show MACD-Line Divergences (Indicator Pane)** (default: true): Draws solid lines and "L" labels for MACD-line divergences in the sub-window.
- **Show MACD-Line Divergences (Main Chart)** (default: true): Overlays MACD-line divergences on the price chart.
- **Show Raw CVD Line** (default: false): Plots the underlying CVD as a faint gray line for reference.
### How to Interpret the Indicator
1. **Core Plots**:
- **MACD Line** (blue): Difference between fast and slow CVD EMAs. Above zero indicates building buy volume momentum; below zero shows sell dominance.
- **Signal Line** (orange): EMA of the MACD line. Crossovers can signal potential entries/exits (e.g., MACD above signal = bullish).
- **Histogram** (columns): MACD minus signal. Green shades for positive/expanding bars (bullish momentum); red for negative/contracting (bearish). Fading colors indicate weakening momentum.
- **Zero Line** (gray horizontal): Reference for bullish (above) vs. bearish (below) territory.
- **Raw CVD** (optional gray line): The cumulative buy-sell delta. Rising = net buying; falling = net selling.
2. **Divergences**:
- **Bullish (Green Lines/Labels)**: Occur when price makes lower lows, but MACD line or histogram makes higher lows. Suggests weakening downside momentum and potential reversal up. Look for "L" (MACD line) or "H" (histogram) labels.
- **Bearish (Red Lines/Labels)**: Price higher highs vs. MACD/histogram lower highs. Indicates fading upside and possible downturn.
- **Dual View**: Divergences appear in the indicator pane (sub-window) for clean analysis and overlaid on the main chart for price context. Histogram divergences use dashed lines to distinguish from MACD-line (solid).
- **Filters**: Momentum decay ensures only "hidden" or weakening divergences trigger. Zero-side filter prevents false signals from oscillating histograms.
3. **Alerts**:
- **Bullish Divergence (L or H)**: Triggers on either MACD-line or histogram bullish divergence. Message: "CVD-MACD Bullish Divergence detected on {{ticker}}".
- **Bearish Divergence (L or H)**: Similar for bearish. Use TradingView's alert setup to notify via email/SMS/webhook.
- Tip: Combine with price action (e.g., support/resistance) for confirmation.
### Usage Tips and Strategies
- **Trend Confirmation**: Use in uptrends for bullish divergences (pullback buys) or downtrends for bearish (short entries).
- **Timeframe Selection**: Higher timeframes (e.g., daily) for swing trading; lower (e.g., 15-min) for intraday. Adjust pivot lookbacks accordingly (shorter for faster charts).
- **Combination Ideas**: Pair with RSI for overbought/oversold confirmation or VWAP for intraday volume context.
- **Risk Management**: Divergences are probabilistic—not guarantees. Always use stop-losses based on recent swings.
- **Performance Notes**: Backtest on historical data via TradingView's Strategy Tester. CVD relies on accurate volume; test on exchanges like NYSE/NASDAQ.
### Known Limitations and Troubleshooting
- **Volume Dependency**: CVD estimation assumes linear buy/sell distribution based on bar position—may be less accurate on thin markets or during gaps.
- **Repainting**: Pivots and divergences can repaint as new data arrives (common in pivot-based indicators). Use on closed bars for reliability.
- **Resource Usage**: High max_bars_back (5000) ensures deep history; reduce if chart loads slowly.
- **No Signals on Low-Volume Bars**: If CVD flatlines, check symbol volume—some crypto/forex pairs have inconsistent data.
- **Community Feedback**: If you encounter bugs (e.g., false divergences on specific symbols/timeframes), missing alerts, or calculation errors, please comment below with details like symbol, timeframe, and screenshots. Suggestions for enhancements (e.g., more filters or visuals) are welcome!
If you have questions or find issues, drop a comment—let's improve this together! 指标

指标

策略

指标
Wave Dynamics - Neural Adaptive Engine🌊 WAVE DYNAMICS - NEURAL ADAPTIVE ENGINE
The Official Reference Manual & Trading Protocol
═════════════════════════════════════════════════════════════
📖 PREFACE: THE END OF STATIC ANALYSIS
The financial markets are not linear; they are fractal. They do not move in straight lines; they breathe. They expand in trending volatility and contract in chopping noise.
The fundamental failure of traditional technical analysis is Static Sensitivity .
• A 14-period RSI works beautifully in a range but fails in a trend.
• A 12,26 MACD captures trends but destroys capital in chop.
Wave Dynamics solves this by treating the market as a living organism. At its core is a Neural Adaptive Engine that calculates the Hurst Exponent (Fractal Dimension) in real-time. It measures the "roughness" of price action and automatically adjusts the lookback periods of every subsystem—Waves, Ribbons, and Oscillators—to match the current market regime.
This manual is your guide to navigating this adaptive framework.
PART 1: THEOLOGY & MARKET PHYSICS
To use this tool, you must understand the three pillars of its logic:
1. The Hurst Exponent (Chaos Theory)
The engine continuously calculates H (Hurst) on a rolling window.
• Persistent Regime (H > 0.5): "What is happening now is likely to continue." The market is trending. The Engine Tightens sensitivity to catch fast pullbacks.
• Anti-Persistent Regime (H < 0.5): "What is happening now is likely to reverse." The market is chopping/ranging. The Engine Widens sensitivity to filter out noise and stop runs.
2. The Elliott Wave Cycle (Crowd Psychology)
Price moves in 5-wave motive sequences followed by corrections.
• Waves 1 & 3: Institutional Accumulation/Mark-up.
• Waves 2 & 4: Profit Taking (The Pullback). These are the only safe entry points.
• Wave 5: Retail FOMO (The Trap). Identified by Momentum Divergence .
3. Smart Money Concepts (Liquidity)
Price moves from liquidity to liquidity.
• Order Blocks: Where institutions initiated the move.
• Breakers: Where institutions trapped traders (Support flips to Resistance).
• Fair Value Gaps: Where price moved too fast, leaving inefficiency.
PART 2: VISUAL INTELLIGENCE (COLOR THEORY)
The chart communicates instantly through a strict color-coded language.
🎨 THE RIBBON (Adaptive Equilibrium)
The background "Cloud" is an Adaptive EMA ribbon.
• Neon Green (#00FF88): Bullish Trend. Only look for Longs. Price is above the equilibrium mean.
• Neon Red (#FF3366): Bearish Trend. Only look for Shorts. Price is below the equilibrium mean.
• Grey/Narrow: Compression. The market is deciding. Do not trade inside a grey ribbon.
🎨 INSTITUTIONAL ZONES
• Green/Red Boxes (Order Blocks): Standard Support/Resistance. Valid entry zones, but lower probability.
• Vivid Purple Boxes (#9C27B0) - THE BREAKER: CRITICAL. This appears when a Green Order Block is smashed through by price. It turns Purple to signify it has flipped from Support to Resistance (or vice versa). A retest of a Purple Zone is the highest probability setup in the system.
• Dotted Outlines (FVG): Magnets. Do not place stops inside these; price will likely travel through them.
🎨 WAVE ANATOMY
• Cyan Lines: Valid Impulse Waves (1, 3, 5).
• Orange Lines/Dots: EXHAUSTION. If a wave line turns Orange, Angular Momentum is decaying. The trend is dying.
• Diamonds (◆): DIVERGENCE. Price made a Higher High, but the internal oscillator (MPI) made a Lower Low. Immediate reversal warning.
🎨 SIGNALS
• Triangles: Confirmed Entries. (Green = Long, Red = Short).
• Labels (e.g., A+): The Grade of the trade based on Confluence.
• A+: Perfect Confluence (Trend + Structure + Zone + Momentum).
• C: Counter-trend or Weak.
PART 3: THE DASHBOARD ECOSYSTEM
Three panels provide Total Situational Awareness. You must read them in order: Top Right → Bottom Left → Bottom Right.
1. MISSION CONTROL (Top Right)
This panel tells you the "Weather Report."
• Neural Status:
• 🧠 TREND: Safe to trade breakout and trend-following strategies.
• 🧠 CHOP: Danger. Use mean-reversion or stay out.
• 🧠 RND (Random): No clear edge.
• Phase: Displays the Bias (Bull/Bear) and Strength. "WEAK BEARISH" usually signals a bottom is forming.
• Score Bar: A live visual meter of the Confluence Score (0-100%).
2. THE ASSISTANT (Bottom Left)
This panel acts as your co-pilot, translating data into English.
• Situation:
• "💎 BULL GEM": You are in a range, at the bottom, showing exhaustion. Buy immediately.
• "🔥 COMPRESSION": Volatility squeeze. A violent move is imminent.
• Action: Tells you exactly what to do (e.g., "Wait for confluence," "Trail Stop," "Let it develop").
• Pro Metrics (Simulated):
• Win Rate: The percentage of signals on the current visible chart that hit Target 1.
• Profit Factor: Gross Win / Gross Loss. If this is < 1.0, stop trading this asset immediately.
• Buckets: Shows the win rate of A-Grade signals vs. C-Grade signals.
3. WAVE INTELLIGENCE (Bottom Right)
This panel provides structural context.
• Channel Gauge (0-100%):
• 0-20%: Oversold / Channel Bottom.
• 80-100%: Overbought / Channel Top.
• 50%: Equilibrium.
• W3/W1 Ratio: The "Health Check" of the trend.
• < 1.0: Weak. Wave 3 is shorter than Wave 1. The trend is struggling.
• > 1.618: Extended. The move is parabolic. Expect a snap-back.
• Trend Health (0-100): Composite score of sub-wave physics. If Health < 30, the trend is effectively dead.
PART 4: PARAMETER OPTIMIZATION (THE INPUTS)
Every input allows you to tune the engine. Here is the deep dive:
🧠 NEURAL ADAPTIVE ENGINE
• Enable Neural Adaptive Engine: Master switch for the Hurst calculation.
• Hurst Period (100):
• Adjustment: Increase to 200 for Crypto/Alts (too much noise). Decrease to 50 for
Forex/Indices (need speed).
• How to tell: If the dashboard says "TREND" but the chart is sideways, INCREASE this value.
• Min/Max Lookback: Defines the constraints. Only adjust if you are an advanced user creating a custom scalping setup (e.g., Min 3 / Max 10).
🌊 WAVE & STRUCTURE
• Base Swing Detection (8): The "Anchor."
• Scalpers (1m-5m): Set to 5-8.
• Swing Traders (1H-4H): Set to 15-20.
• Min Wave Size (ATR): Prevents the script from labeling tiny wicks as waves. Increase this during high-volatility news events.
🔗 MTF STRUCTURE MAPPING
• Require Macro Align: Strict Mode. If enabled, the script checks the Higher Timeframe (e.g., 4H). If 4H is Bearish, it BLOCKS all Long signals on the 5m chart. Use this to prevent counter-trend losses.
🏦 SMART MONEY CONCEPTS
• Enable Breakers: ALWAYS ON. This turns failed Order Blocks into Breaker Zones (Purple).
• Institutional Mode: ULTRA STRICT. If enabled, signals will ONLY fire if price is physically touching an Order Block, FVG, or Breaker. This creates very few, very high-quality signals.
🎯 SIGNAL ENGINE
• Signal Mode:
• Strict: Grades A+ and A only.
• Balanced: Grades B and above.
• Aggressive: Includes counter-trend scalps (Grade C).
• Min Confluence Score (5-35): The raw points needed to trigger. 5 is standard. 10 is conservative.
PART 5: TRADE EXECUTION PLAYBOOKS
PLAYBOOK A: THE "BREAKER RETEST" (Highest Probability)
1. Context: Ribbon is Green.
2. Event: Price creates a Red Order Block, then smashes upward through it.
3. Change: The Red Block turns Purple (Bullish Breaker).
4. Trigger: Price pulls back down to touch the top of the Purple Box.
5. Signal: Green Triangle appears.
6. Action: Max Size Entry. Stop Loss below the Purple Box. Target Wave 3 Projection.
PLAYBOOK B: THE "WAVE 4 DIP" (Trend Following)
1. Context: Wave count shows "3". Ribbon is Green.
2. Event: Price pulls back towards the Ribbon.
3. Wave Panel: Wave count flips to "4".
4. Trigger: Price touches Ribbon, prints Green Triangle.
5. Action: Standard Size Entry. Stop Loss at Swing Low. Target New High (Wave 5).
PLAYBOOK C: THE "HIDDEN GEM" (Range Reversal)
1. Context: Ribbon is Grey (Consolidation). Neural Status is CHOP.
2. Wave Panel: Channel Gauge is < 10% (Extreme Bottom).
3. Visuals: Orange Exhaustion Dot + Divergence Diamond (◆).
4. Assistant: Reads "💎 BULL GEM".
5. Action: Half Size Entry. This is a counter-trend trade. Target the middle of the range (50% Channel).
PLAYBOOK D: THE "BULL TRAP" (When to Fold)
1. Context: Wave Count is "5".
2. Wave Panel: Trend Health < 30. W3/W1 Ratio > 1.618 (Extended).
3. Visuals: Orange Line appears on price high.
4. Signal: Green Triangle appears (Grade C).
5. Action: NO TRADE. The system is warning you that even though a signal fired, the structural physics indicate exhaustion.
PART 6: GRADING & SCORING MATRIX
Every signal is graded on a 35-point scale. Know what you are buying.
• Trend Alignment (5 pts): Ribbon & HTF agreement.
• Structure (5 pts): BOS (Break of Structure) & Higher Highs.
• Physics (5 pts): MPI (Volume Flow) & Angular Velocity.
• Institutional Location (10 pts):
• Inside Order Block: +3 pts
• Inside Breaker: +4 pts
• Wave 2/4 Pullback: +3 pts
• Penalty: Wave 5 Extension (-3 pts).
Grade Scale:
• A+ (Score ≥ 70%): "All In" Setup.
• A (Score 55-69%): Strong Setup.
• B (Score 40-54%): Standard Setup.
• C (Score < 40%): Dangerous.
PART 7: RISK DISCLOSURE & LIMITATIONS
1. The Reality of Adaptation (Redrawing):
The Neural Engine is dynamic. As new data arrives, the calculation of "Chaos" changes. This means historical channel lines or wave labels may shift to fit the matured trend. HOWEVER: Entry Signals (Triangles) NEVER repaint once the bar is closed.
2. Simulation vs. Reality:
The Dashboard metrics (Win Rate, Profit Factor) are Simulations run on the historical data visible on your chart. They do not account for spread, slippage, or liquidity. They are a tool to gauge the current market personality, not a promise of future returns.
3. No Financial Advice:
Wave Dynamics is a tool for structural analysis. It helps you see the market, but it cannot trade for you. You are responsible for your own risk management.
CLOSING THOUGHTS
Wave Dynamics is not just an indicator; it is a lens. It allows you to see the market not as a random walk of candles, but as a structured, breathing entity.
Trust the Neural Status. Respect the Breakers. Fear the Exhaustion.
Taking you to school. — Dskyz, Trade with insight. Trade with anticipation.
指标