Chart view mode
There are three ways to display data in screeners:
- Table view — data is presented in a table with column sets.
- Chart view — data is presented as charts of price movement for the selected date range, with trading volume and technical indicators (SMA, EMA).
- Heatmap view - data is presented as a grid of cells sized and colored by key metrics (such as market capitalization, turnover, or assets under management).
All three view types are available in Stock, ETF, and Crypto Coins Screeners. In CEX and DEX Screeners, only Table and Chart views are available.
To switch between these three modes, click Table view, Chart view, or Heatmap view in the top-left corner of the screener:
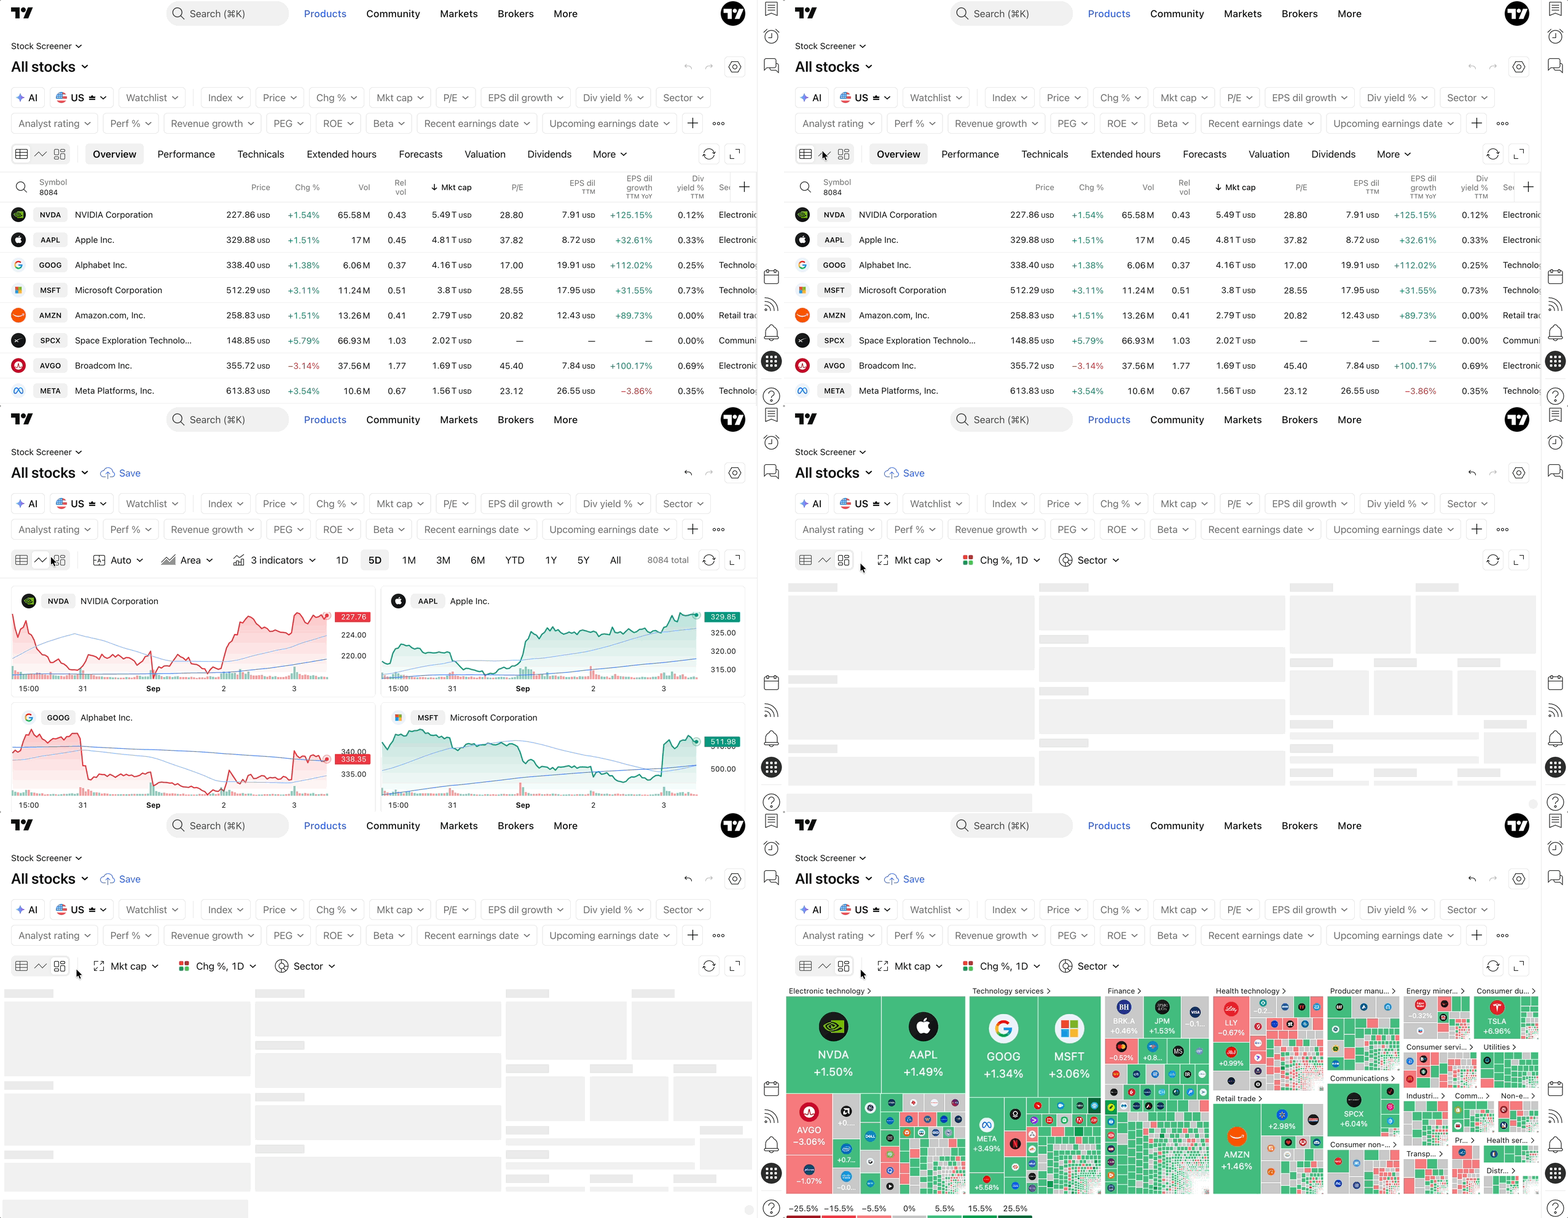
Chart View Settings
The Chart view mode has four key settings: Chart grid, Chart type, Indicators, and date ranges.
Chart grid
There are two grid modes available:
- Auto
- Custom
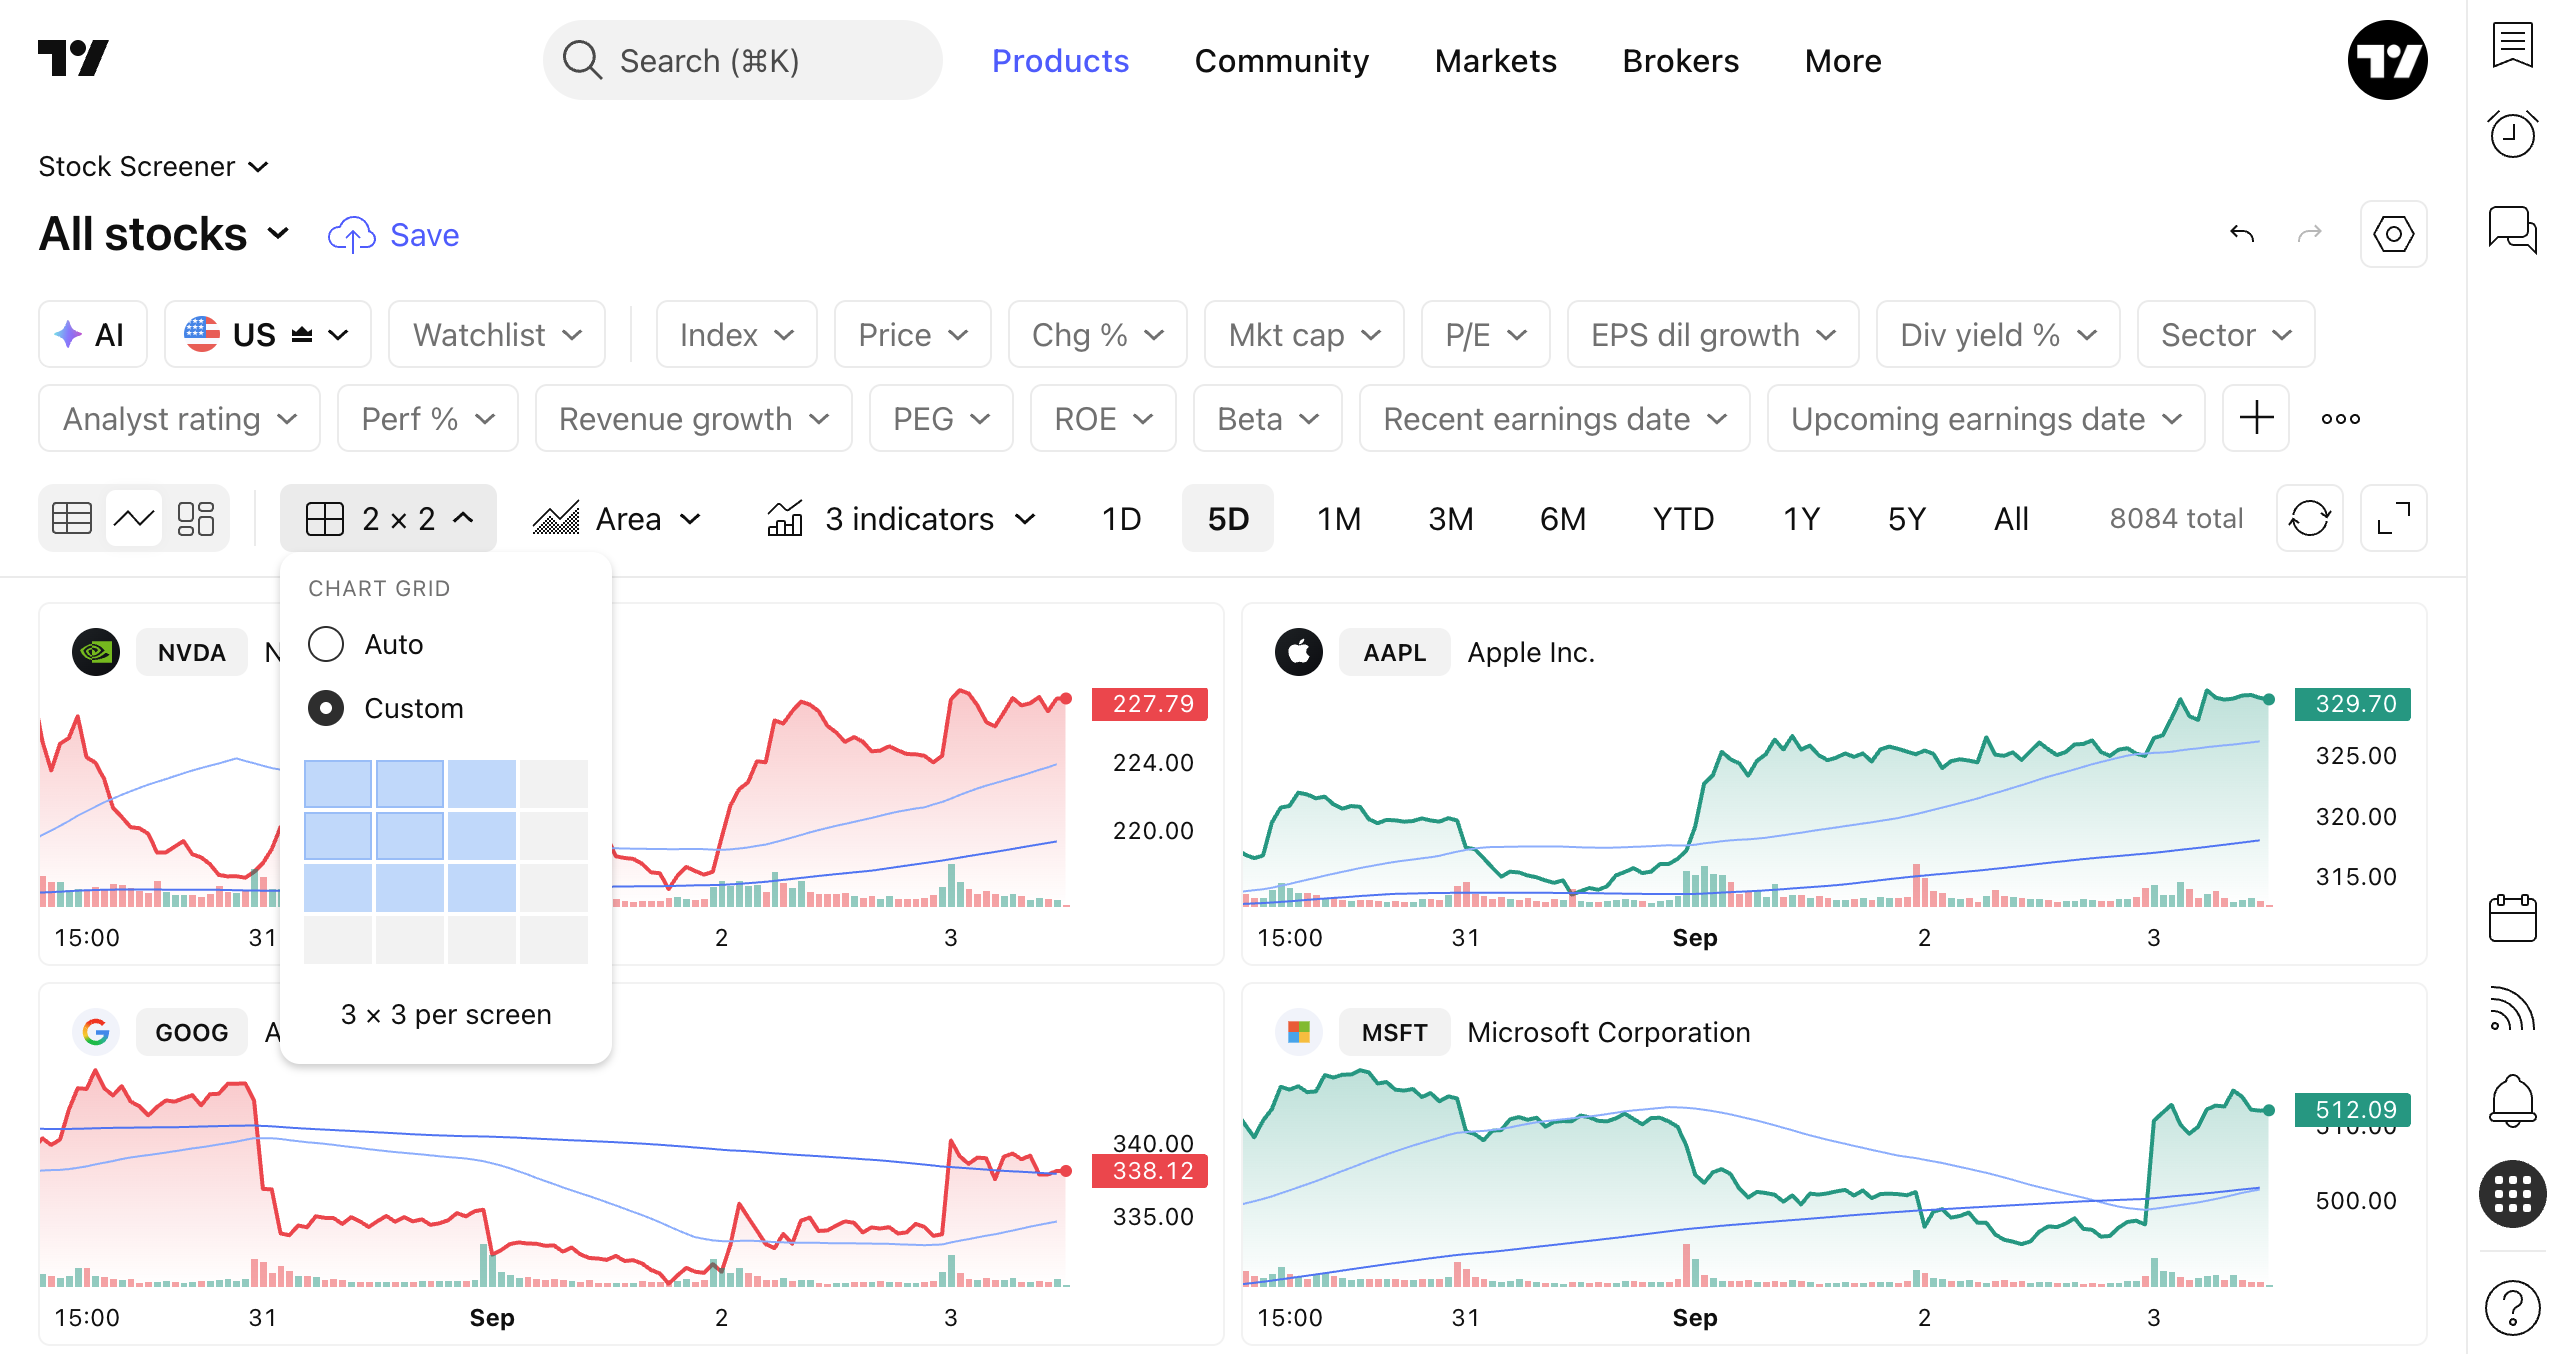
In Custom mode you can configure the display layout with 1 to 4 cells horizontally and vertically, depending on your screen size (up to a 4x4 maximum grid):
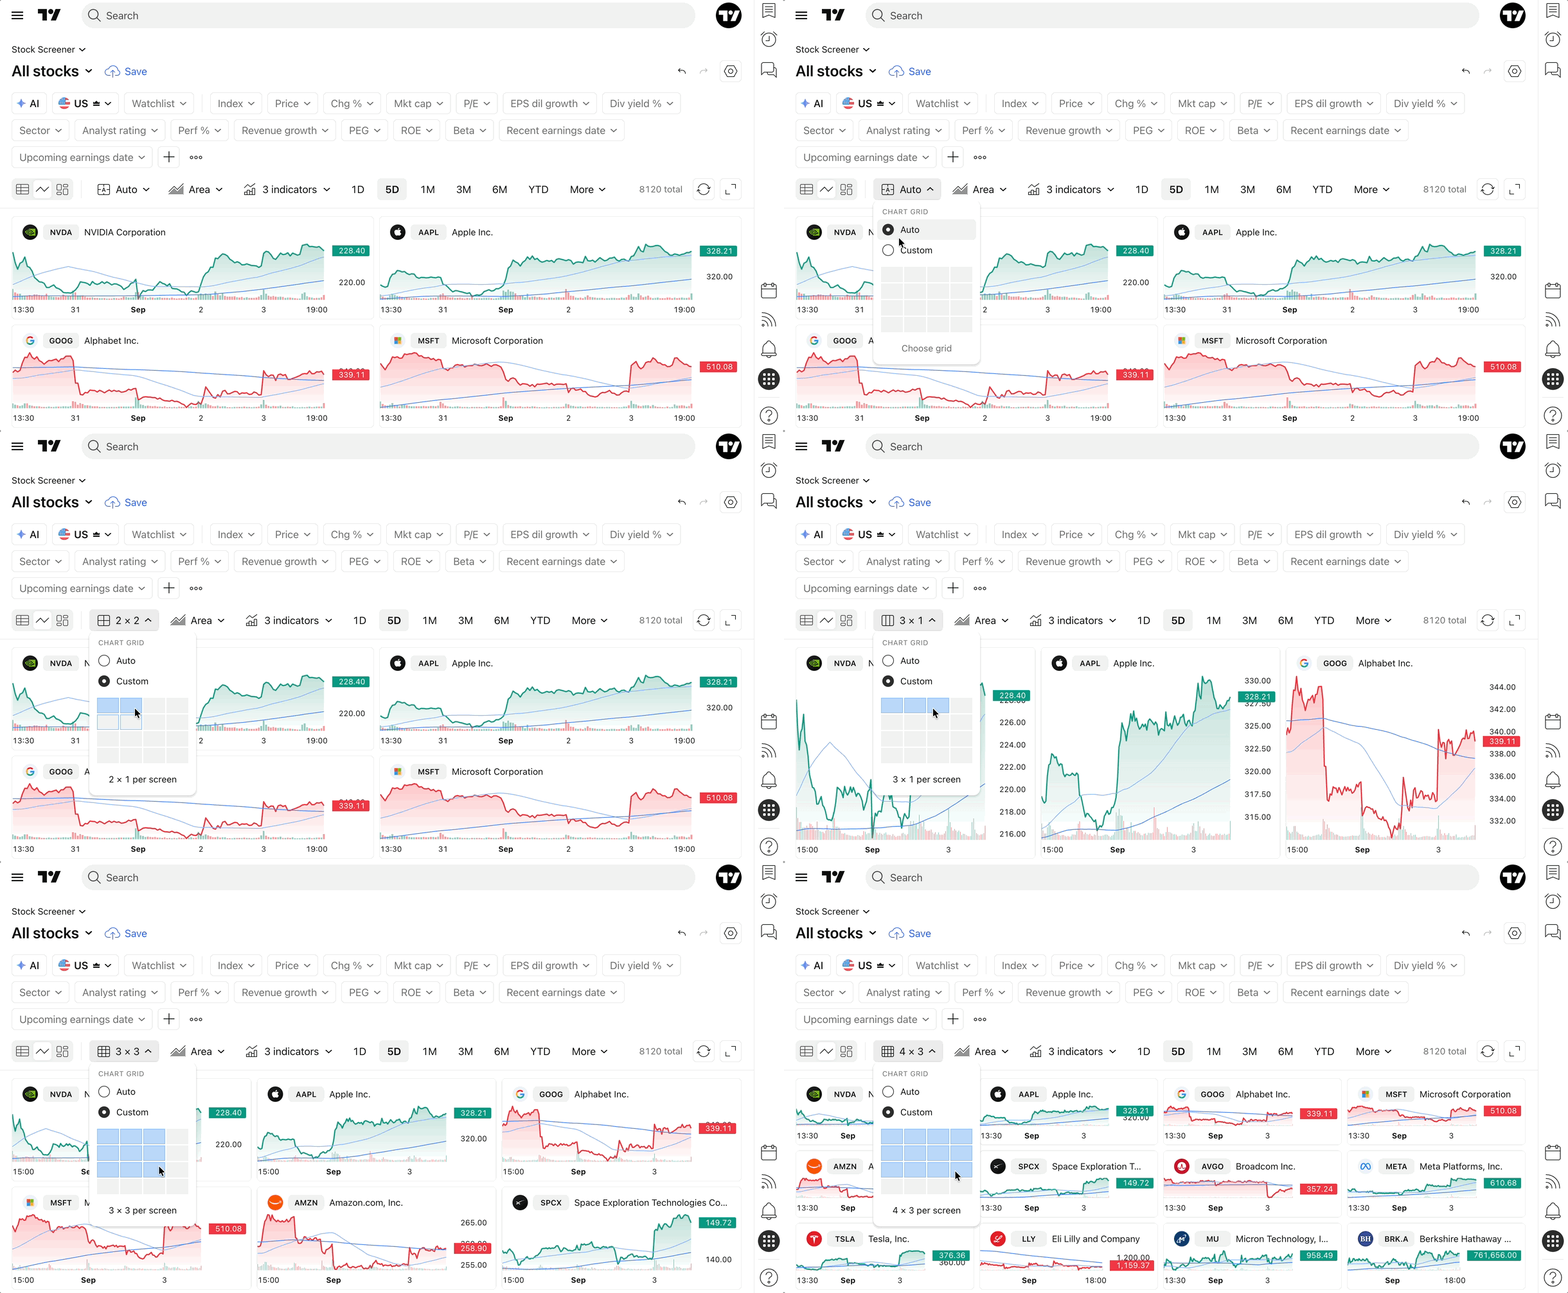
Chart type
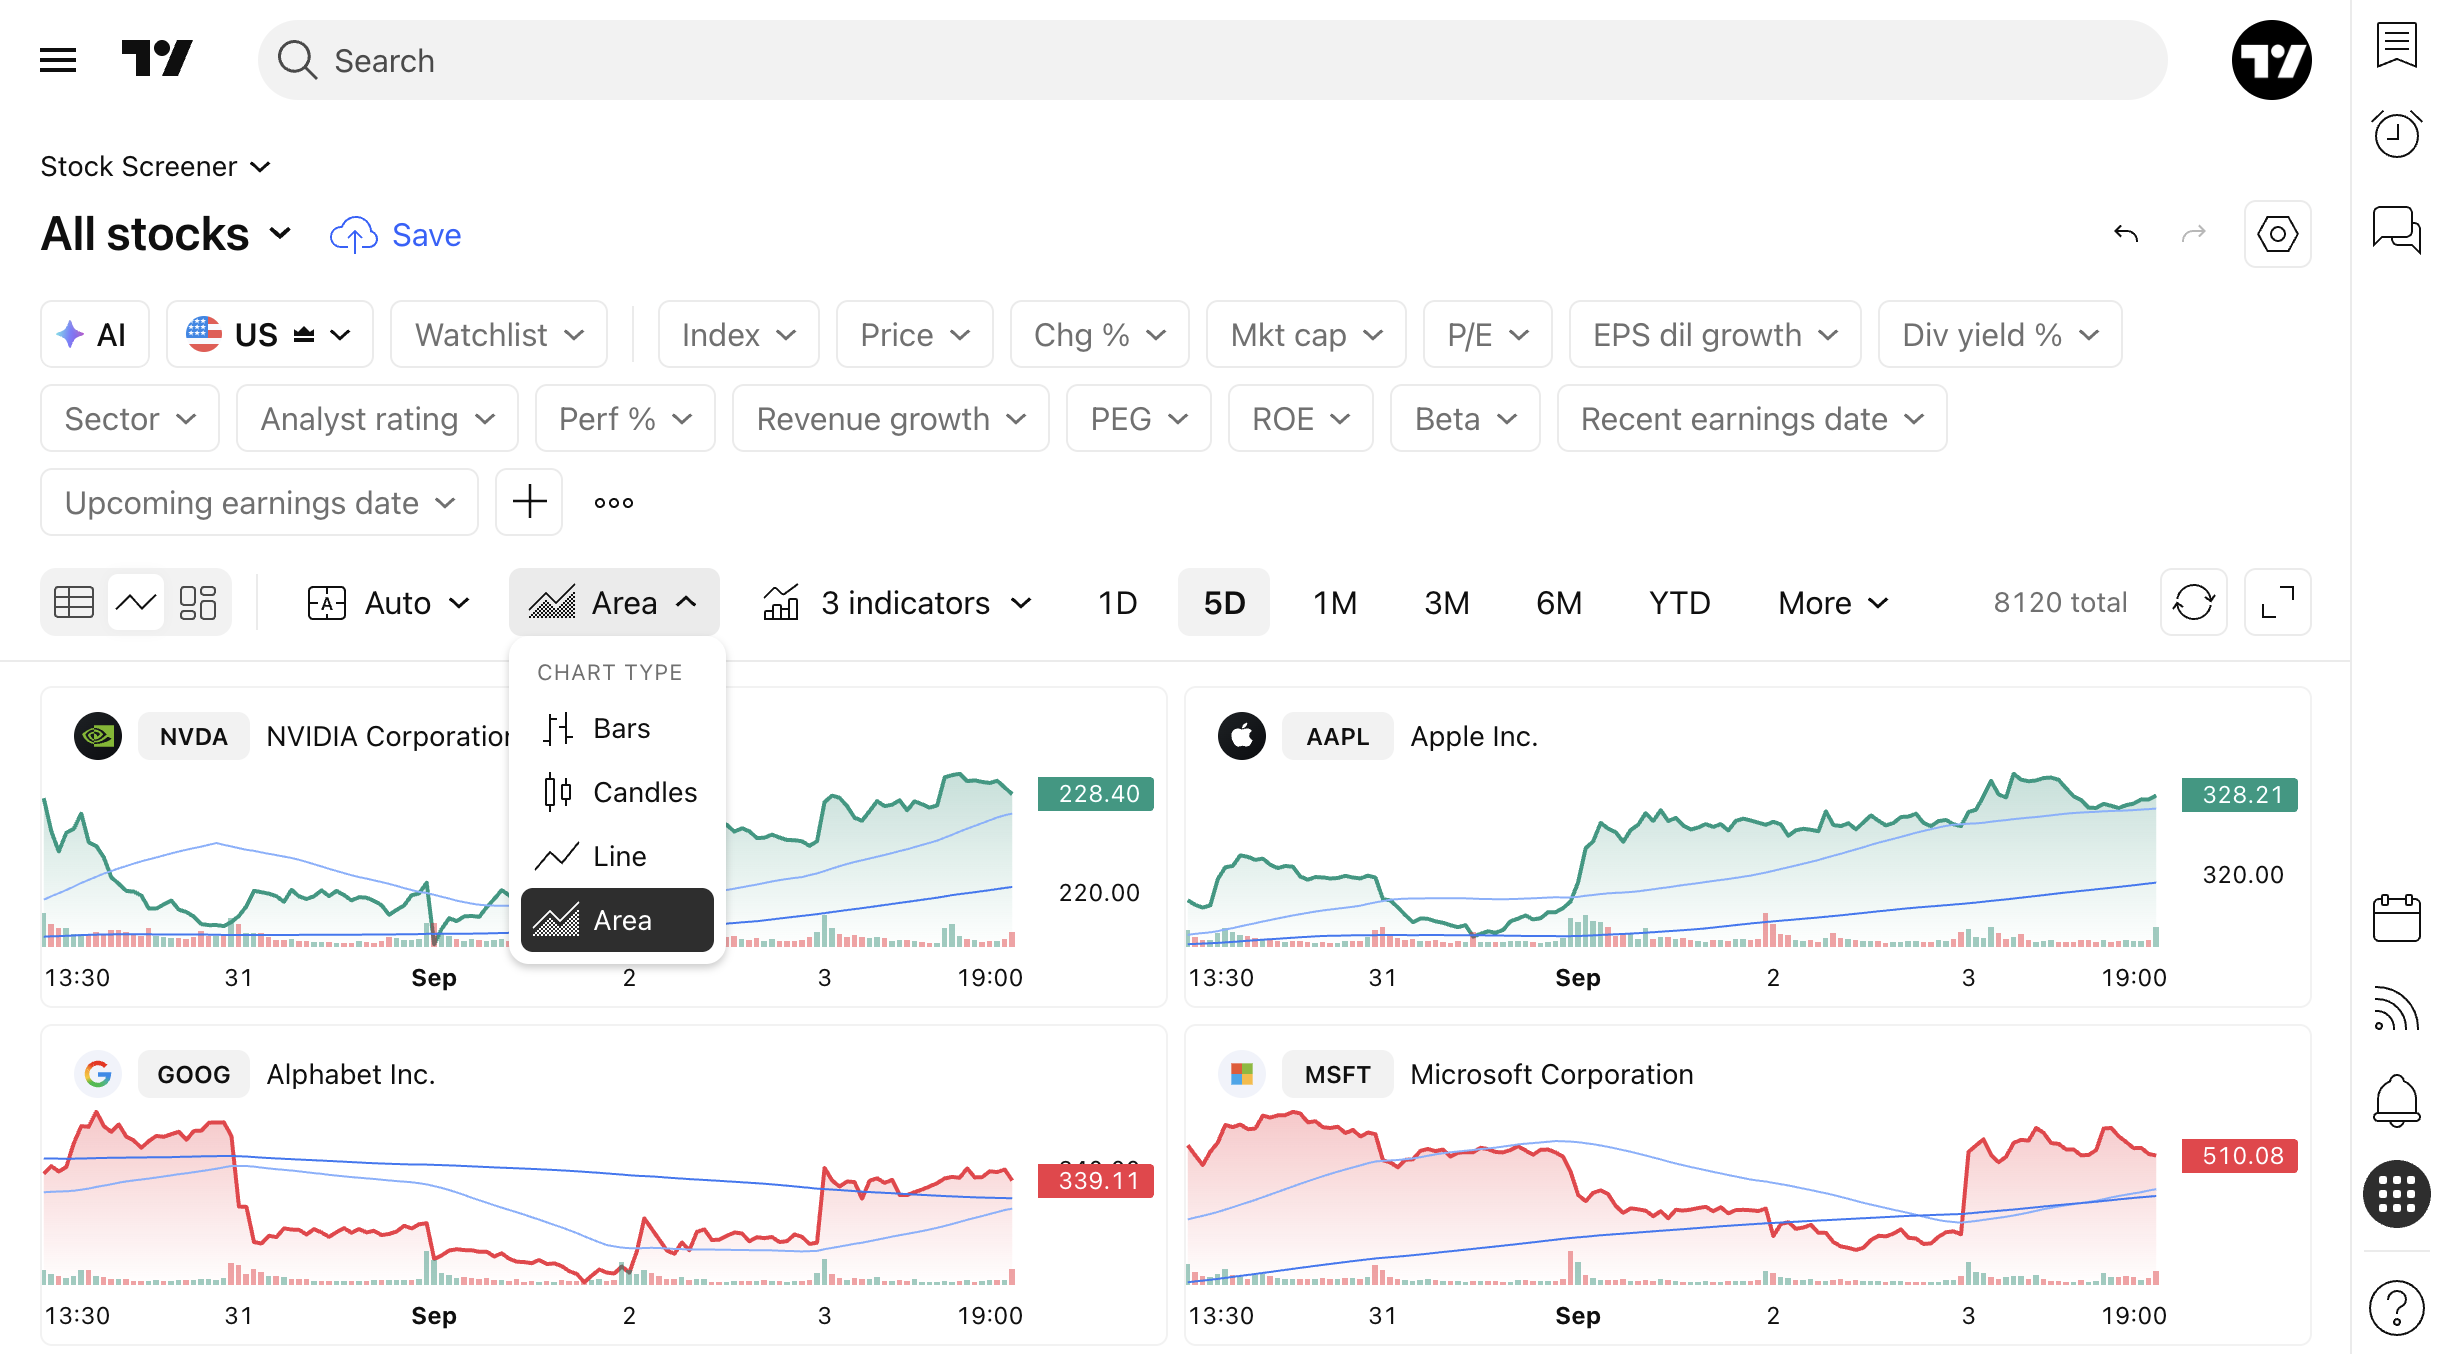
Click the Chart type button (located next to Chart grid) to select a chart style. The Area chart is selected by default, but you can also choose Bars, Candles, or Line.
Indicators
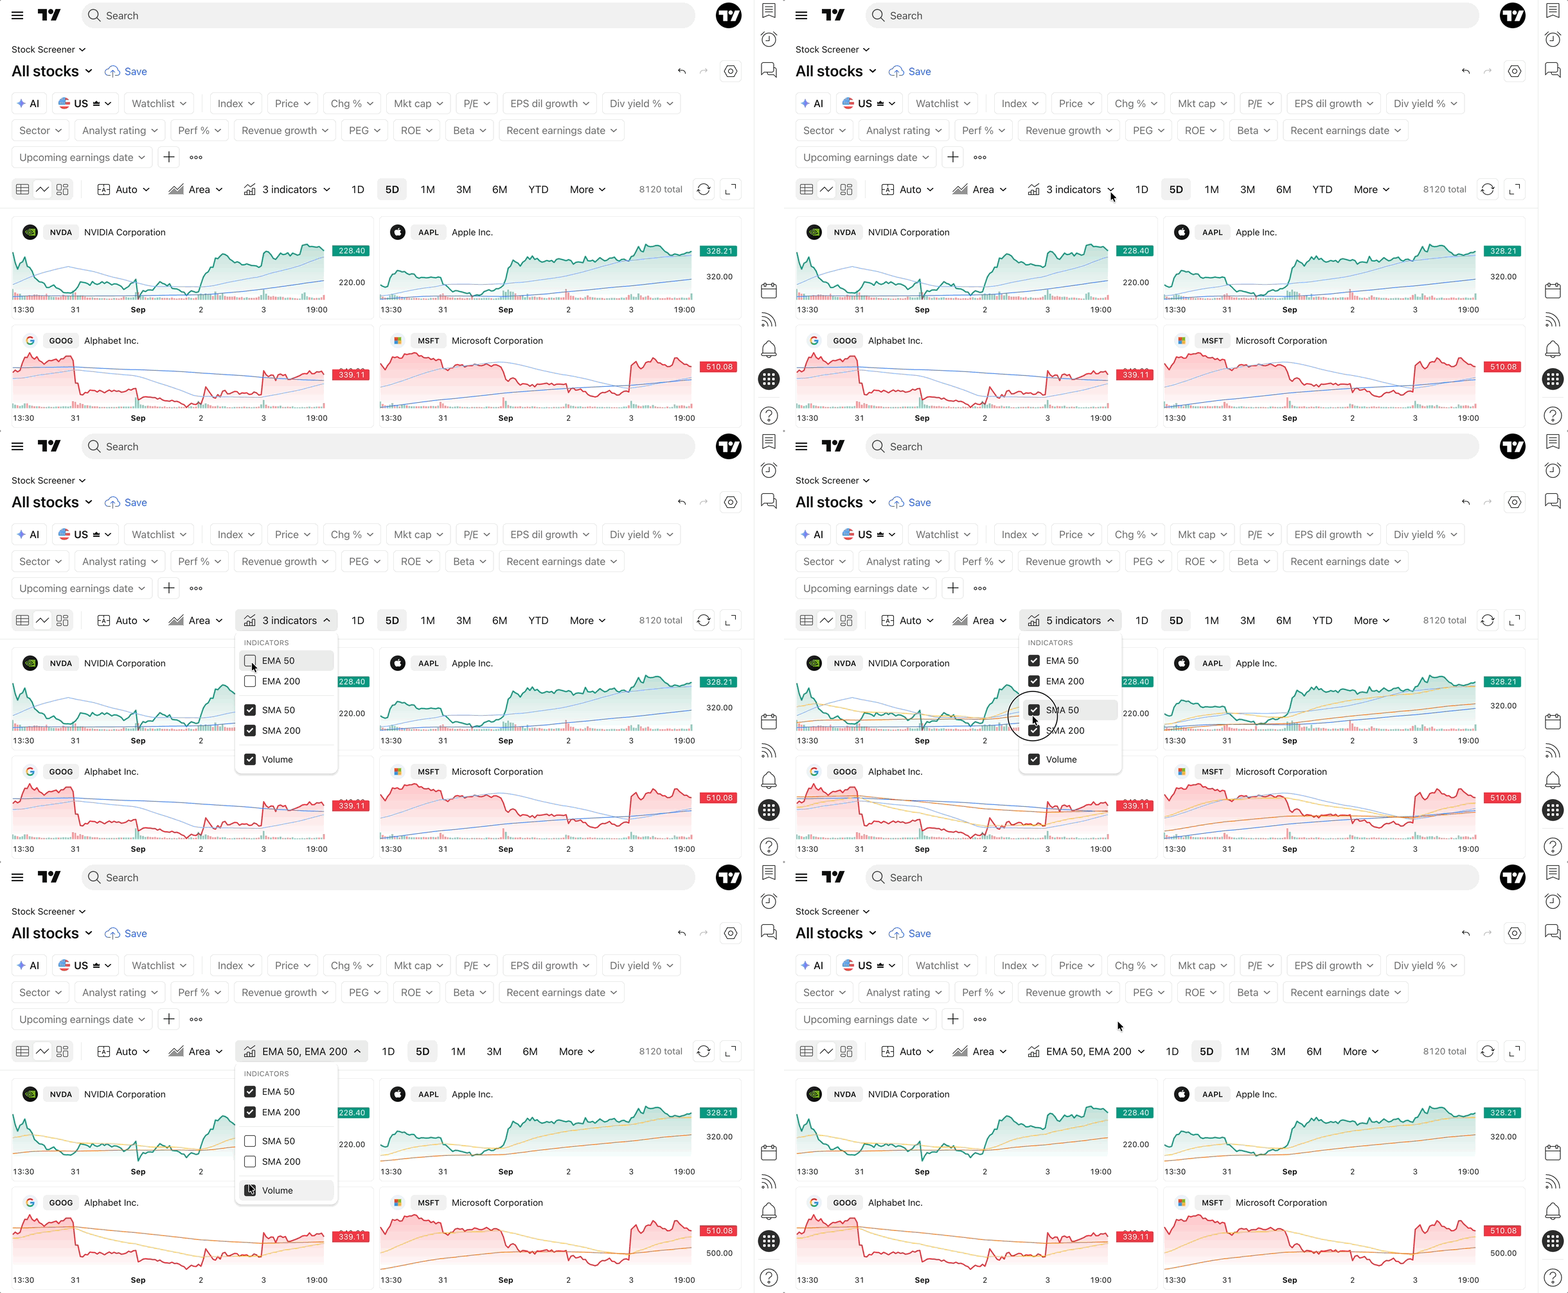
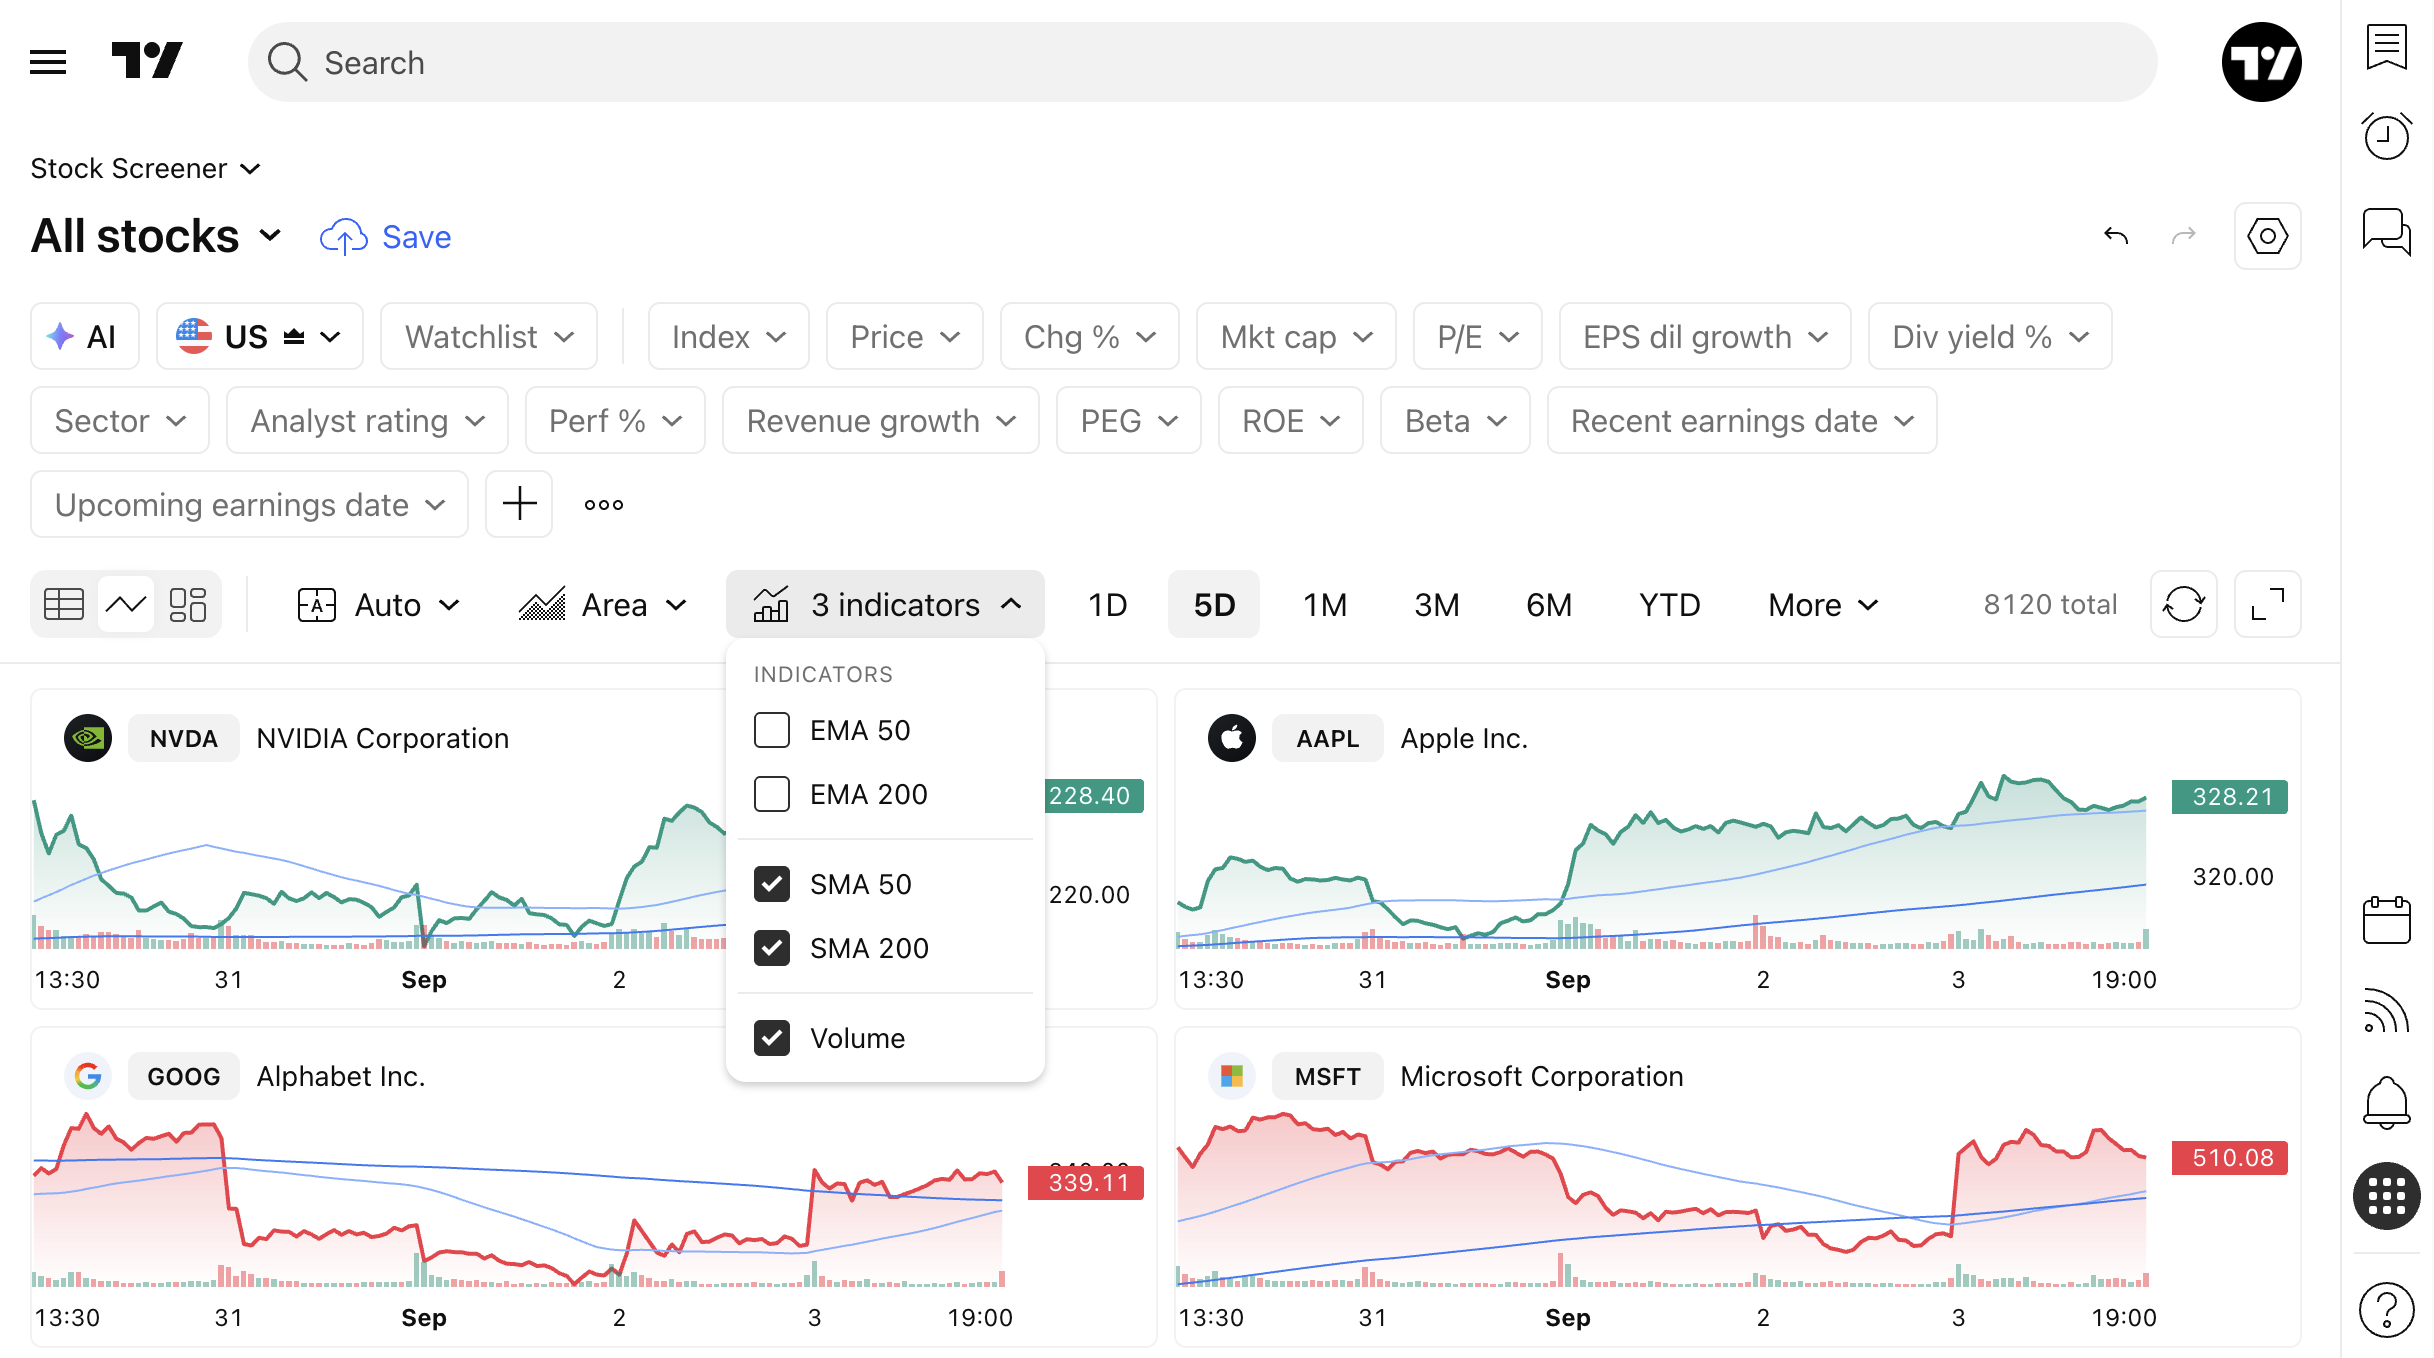
In the Chart view mode you can add indicators to the chart:
Date ranges
You can also select a date range for the charts:
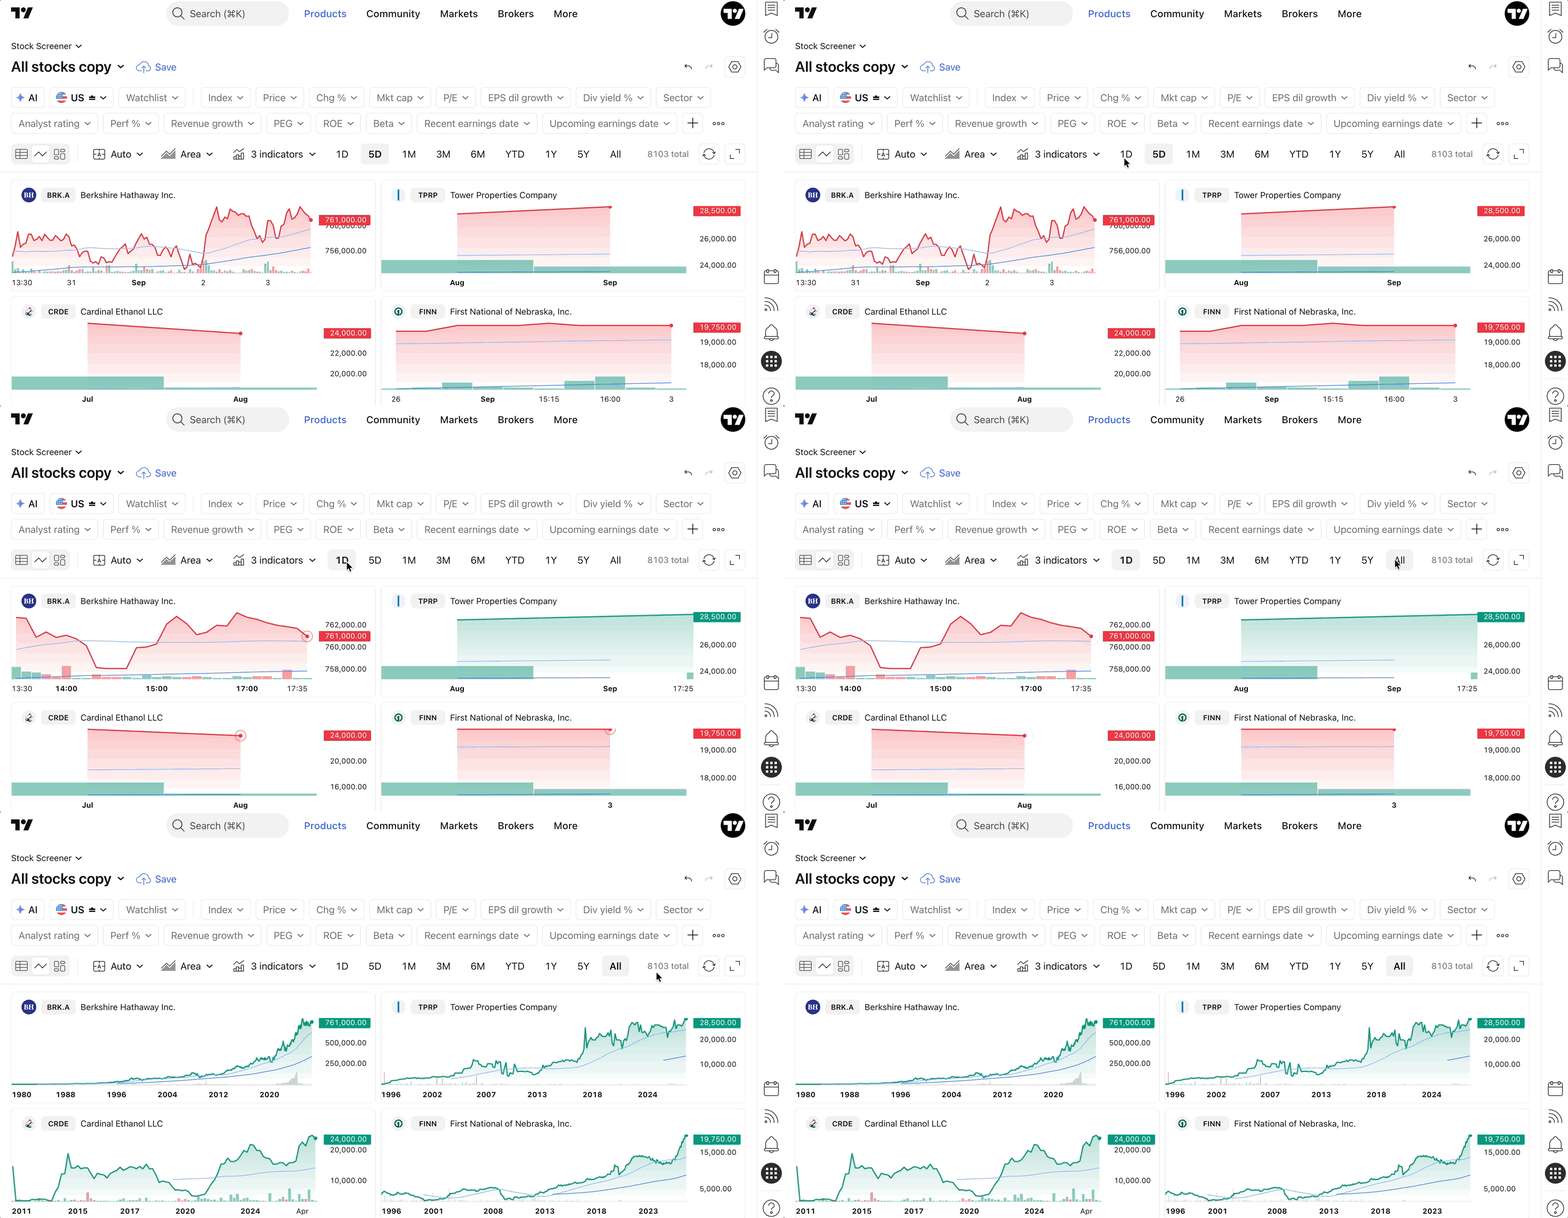
Each range is linked to a specific timeframe in the Screener Chart view:
For example, if you select a 1-year range in the Screener Chart view, each bar will equal one week.
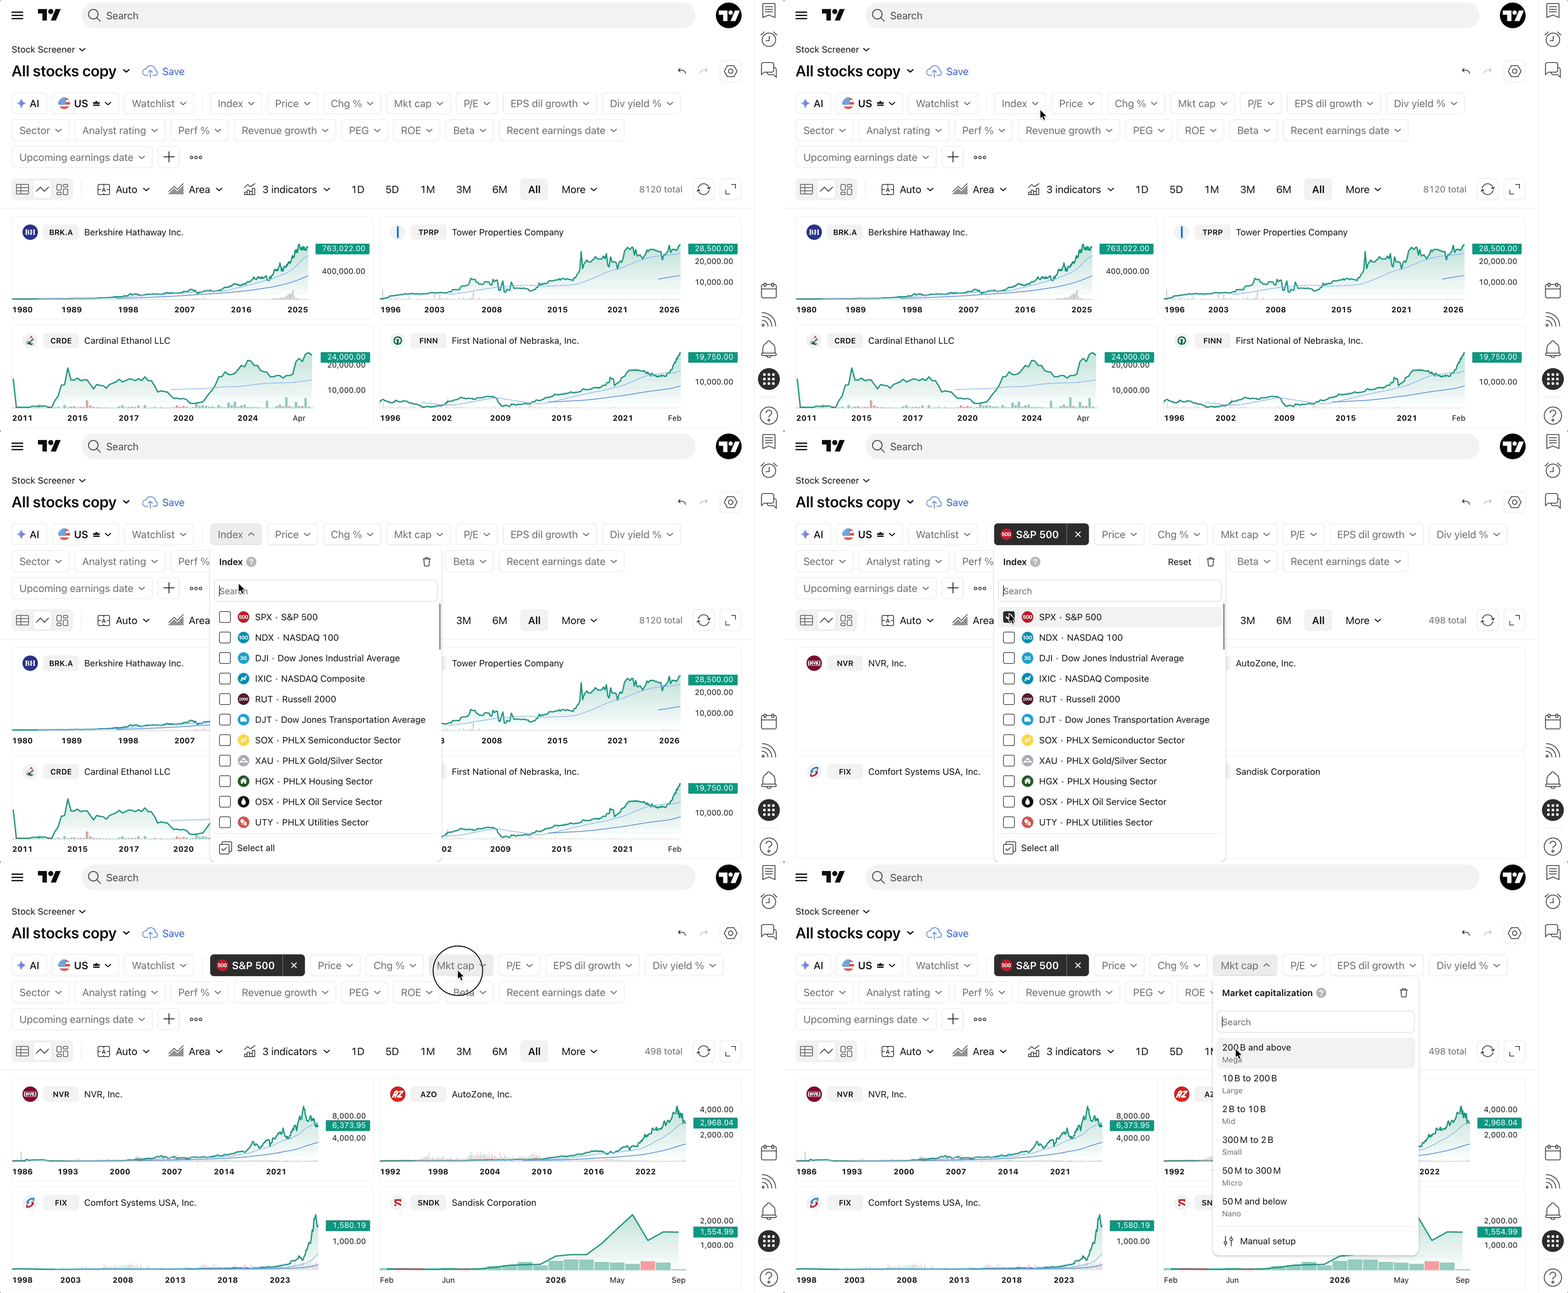
When Chart view is enabled, you can still apply all available filters and select your desired market: