
hello
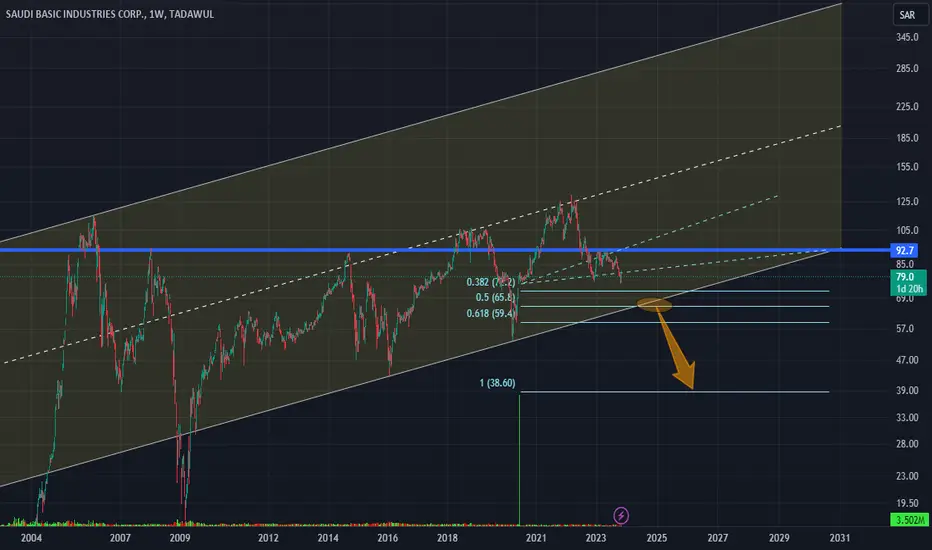
first as you see on my chart resepects its evolution according to the figure so:
- if it breaks the suuport line around 65.8 it will reach 59.4 then maye be pulback toward its broken support then continue its free fall until 38.6 or more.
- otherwise it will rebond on its support and buyers can hold their stocks wishing higher levels
Remember that this support is a critical level so pay attention
NB:the horizontal blue line presents a historical level that retraces history of this stock
Keep in mind that i am not having a cristal ball predicting future but i try to be more efficient and rationnal
first as you see on my chart resepects its evolution according to the figure so:
- if it breaks the suuport line around 65.8 it will reach 59.4 then maye be pulback toward its broken support then continue its free fall until 38.6 or more.
- otherwise it will rebond on its support and buyers can hold their stocks wishing higher levels
Remember that this support is a critical level so pay attention
NB:the horizontal blue line presents a historical level that retraces history of this stock
Keep in mind that i am not having a cristal ball predicting future but i try to be more efficient and rationnal

Verbundene Veröffentlichungen
Haftungsausschluss
Die Informationen und Veröffentlichungen sind nicht als Finanz-, Anlage-, Handels- oder andere Arten von Ratschlägen oder Empfehlungen gedacht, die von TradingView bereitgestellt oder gebilligt werden, und stellen diese nicht dar. Lesen Sie mehr in den Nutzungsbedingungen.
Verbundene Veröffentlichungen
Haftungsausschluss
Die Informationen und Veröffentlichungen sind nicht als Finanz-, Anlage-, Handels- oder andere Arten von Ratschlägen oder Empfehlungen gedacht, die von TradingView bereitgestellt oder gebilligt werden, und stellen diese nicht dar. Lesen Sie mehr in den Nutzungsbedingungen.