Rabigh Refining & Petrochemical : Parallel Channels 🇸🇦
 2380
📈 Weekly Parallel Channel Nearing Resolution — Is a Multi-Year Breakout Around the Corner? 🇸🇦
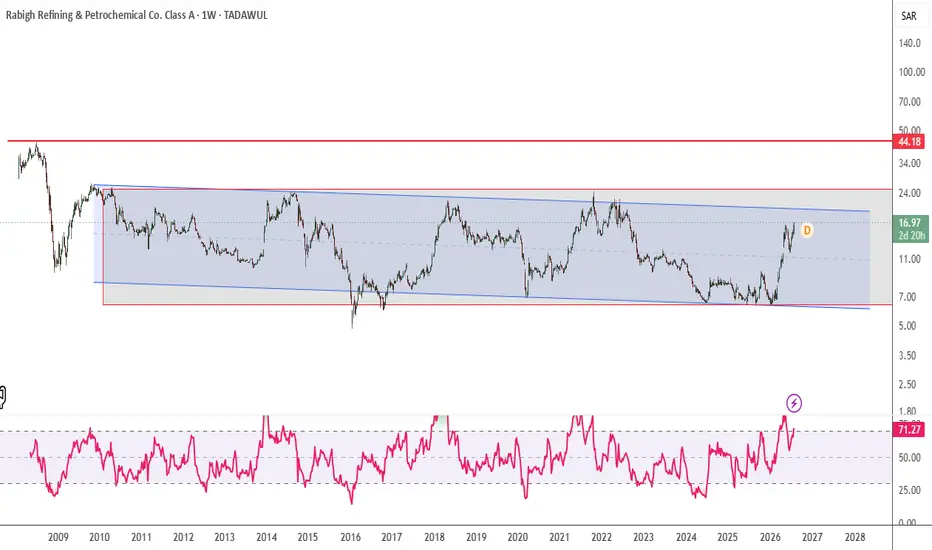
The stock continues to trade within a well-defined weekly parallel channel, keeping the long-term trend at a decisive technical juncture.
After months of consolidation, price is now approaching the upper boundary of the channel, where the next major trend is likely to emerge.
🔍 Technical Outlook
The broader structure remains constructive, but buyers still need to clear two key resistance levels before a confirmed breakout can be declared.
📌 First Resistance: 20
📌 Major Breakout Level: 25
These levels represent the upper boundary of the weekly channel and are likely to determine whether the stock enters a new bullish phase.
🚀 Bullish Scenario
A sustained breakout above 20, followed by a decisive move through 25 with strong volume and bullish weekly closes, would confirm a channel breakout.
Once this resistance zone is reclaimed, the technical picture improves significantly, opening the door for a potential rally toward the stock's:
🎯 All-Time High: 45
Breaking out of a long-term consolidation pattern often attracts fresh momentum traders and long-term investors, making this one of the most important setups to monitor.
⚠️ Why Patience Matters
Until the breakout is confirmed, the stock remains range-bound inside the weekly channel.
Rather than anticipating the move, it's prudent to wait for:
✅ Weekly close above 20
✅ Strong breakout above 25
✅ Rising volume confirming buying interest
✅ Successful retest of the breakout zone
Confirmation helps reduce false breakouts and improves the overall risk-to-reward profile.
📊 My View
This is a classic "watchlist before breakout" setup.
👀 Key Levels: 20 → 25
🚀 Breakout Confirmation: Weekly close above the channel resistance.
🎯 Long-Term Target: 45 (All-Time High)
The stock is approaching a make-or-break technical zone. If bulls successfully reclaim 25, the next major trend could already be underway.
Do you think this weekly channel is preparing for a breakout, or will sellers defend resistance once again? Share your technical view below! 👇
#Tadawul #SaudiStockMarket #SaudiStocks #TASI #SaudiInvesting #SaudiTrading #SaudiInvestors #KSAStocks #SaudiEquities #MiddleEastMarkets #GCCMarkets
#TechnicalAnalysis #TradingView #PriceAction #WeeklyChart #MarketStructure #TrendReversal #BullishDivergence #HigherLow #EMA200 #Fibonacci #Breakout #SupportAndResistance #SwingTrading #TrendFollowing #MomentumTrading #ChartAnalysis #TradingIdeas #StockAnalysis #BullishSetup #RiskManagement
#WiSHFundManagement

Verbundene Veröffentlichungen
Haftungsausschluss
Die Informationen und Veröffentlichungen sind nicht als Finanz-, Anlage-, Handels- oder andere Arten von Ratschlägen oder Empfehlungen gedacht, die von TradingView bereitgestellt oder gebilligt werden, und stellen diese nicht dar. Lesen Sie mehr in den Nutzungsbedingungen.
Verbundene Veröffentlichungen
Haftungsausschluss
Die Informationen und Veröffentlichungen sind nicht als Finanz-, Anlage-, Handels- oder andere Arten von Ratschlägen oder Empfehlungen gedacht, die von TradingView bereitgestellt oder gebilligt werden, und stellen diese nicht dar. Lesen Sie mehr in den Nutzungsbedingungen.