
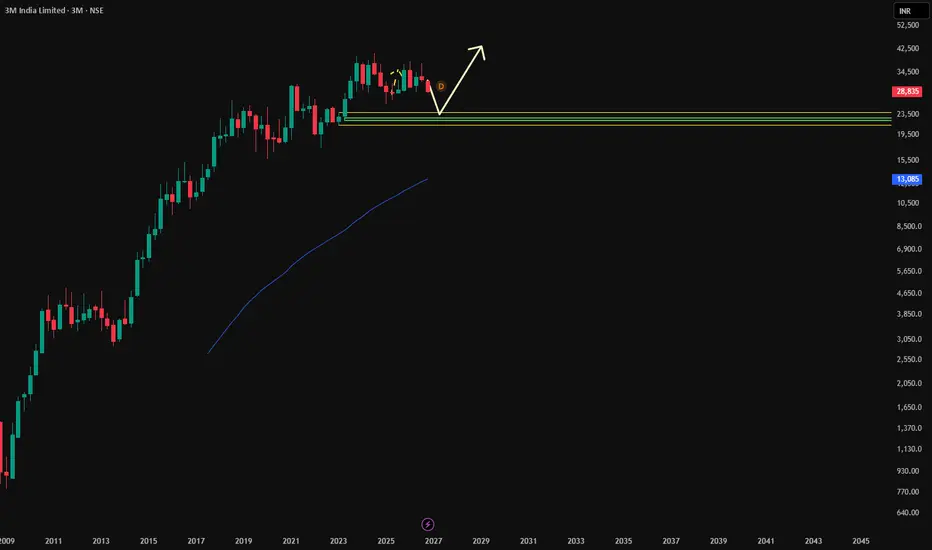
Overall view: 3M India has a bullish multi-timeframe demand structure. Yearly and half-yearly demand zones are aligned at ₹25,200–31,000, while quarterly, monthly and weekly demand zones provide progressively closer support. The strongest immediate confluence is the ITF demand zone at ₹21,300–21,695.
1. Six key technical insights
1. HTF trend – Strong bullish structure: Yearly and half-yearly Rally Base Rally zones overlap completely at ₹25,200–31,000, averaging ₹28,100. This represents a major long-term demand zone.
2. Quarterly demand – Important structural support: Quarterly demand at ₹21,300–23,995 provides the next major support. The quarterly average is ₹22,648, supporting the broader bullish structure.
3. MTF alignment – Bullish: Monthly, weekly and daily trends are UP. Their average demand zone is ₹21,300–23,268, with an average of ₹22,284.
4. ITF confluence – High conviction area: All three intraday timeframes (240M, 180M and 60M) share the same DMIP zone of ₹21,300–21,695. This is a significant demand confluence, although overlapping zones do not guarantee a reversal.
5. Entry strategy – Two-level accumulation: Entry-1 at ₹25,320 corresponds to monthly demand, while Entry-2 at ₹23,995 corresponds to quarterly demand. The planned average entry of ₹24,658 positions the trade between these two demand levels.
6. Target potential – Extended bullish setup: The primary target of ₹43,123 offers 5.5:1 gross reward-to-risk based on your supplied risk and reward. The extended position target of ₹63,988 represents a longer-term scenario and requires fresh confirmation.
2. Complete trade economics
Parameter Value
Entry-1 ₹25,320
Entry-2 ₹23,995
Average entry ₹24,658
Stop-loss ₹21,300
Primary target ₹43,123
Extended target ₹63,988
Quantity 100 shares
Investment value ₹24,65,750
Margin requirement (35%) ₹8,63,013
Financed amount (65%) ₹16,02,738
3. Target and risk analysis
Gross risk
₹3,35,750
Gross reward
₹18,46,500
Gross RR
1:5.50
Net RR (before interest)
1:5.27
120-day financing scenario
Component Amount
Gross profit at target ₹18,46,500
Brokerage / taxes assumed -₹12,087
Interest (120 days) -₹51,059
Total net profit ₹17,83,354
4. Price target structure
TRADE PRICE LEVELS
₹63,988
Extended position target
₹43,123
Primary target (+74.9% from average entry)
₹24,658
Average entry
₹21,300
Stop-loss / ITF distal demand
5. Important calculation corrections
There are three points to address before executing this trade:
- Brokerage: ₹12,087 is approximately 0.49% of the purchase value alone. If 0.49% is intended on both buy and sell turnover, the exit-side charges must also be included.
- Interest: Your ₹51,059 interest is consistent with approximately 120 days on ₹16,02,738 at 9.69% annual interest.
- ROI: Net profit of ₹17,83,354 represents approximately 206.6% return on the initial 35% margin of ₹8,63,013, before any additional charges or margin requirements.
My assessment: The technical setup has strong timeframe alignment, but the planned stop-loss is below the overlapping ITF demand zone and the risk is substantial because of leverage. The ₹43,123 target should be treated as a price objective, not a guaranteed outcome. Position sizing and margin-call risk need to be considered independently.
1. Six key technical insights
1. HTF trend – Strong bullish structure: Yearly and half-yearly Rally Base Rally zones overlap completely at ₹25,200–31,000, averaging ₹28,100. This represents a major long-term demand zone.
2. Quarterly demand – Important structural support: Quarterly demand at ₹21,300–23,995 provides the next major support. The quarterly average is ₹22,648, supporting the broader bullish structure.
3. MTF alignment – Bullish: Monthly, weekly and daily trends are UP. Their average demand zone is ₹21,300–23,268, with an average of ₹22,284.
4. ITF confluence – High conviction area: All three intraday timeframes (240M, 180M and 60M) share the same DMIP zone of ₹21,300–21,695. This is a significant demand confluence, although overlapping zones do not guarantee a reversal.
5. Entry strategy – Two-level accumulation: Entry-1 at ₹25,320 corresponds to monthly demand, while Entry-2 at ₹23,995 corresponds to quarterly demand. The planned average entry of ₹24,658 positions the trade between these two demand levels.
6. Target potential – Extended bullish setup: The primary target of ₹43,123 offers 5.5:1 gross reward-to-risk based on your supplied risk and reward. The extended position target of ₹63,988 represents a longer-term scenario and requires fresh confirmation.
2. Complete trade economics
Parameter Value
Entry-1 ₹25,320
Entry-2 ₹23,995
Average entry ₹24,658
Stop-loss ₹21,300
Primary target ₹43,123
Extended target ₹63,988
Quantity 100 shares
Investment value ₹24,65,750
Margin requirement (35%) ₹8,63,013
Financed amount (65%) ₹16,02,738
3. Target and risk analysis
Gross risk
₹3,35,750
Gross reward
₹18,46,500
Gross RR
1:5.50
Net RR (before interest)
1:5.27
120-day financing scenario
Component Amount
Gross profit at target ₹18,46,500
Brokerage / taxes assumed -₹12,087
Interest (120 days) -₹51,059
Total net profit ₹17,83,354
4. Price target structure
TRADE PRICE LEVELS
₹63,988
Extended position target
₹43,123
Primary target (+74.9% from average entry)
₹24,658
Average entry
₹21,300
Stop-loss / ITF distal demand
5. Important calculation corrections
There are three points to address before executing this trade:
- Brokerage: ₹12,087 is approximately 0.49% of the purchase value alone. If 0.49% is intended on both buy and sell turnover, the exit-side charges must also be included.
- Interest: Your ₹51,059 interest is consistent with approximately 120 days on ₹16,02,738 at 9.69% annual interest.
- ROI: Net profit of ₹17,83,354 represents approximately 206.6% return on the initial 35% margin of ₹8,63,013, before any additional charges or margin requirements.
My assessment: The technical setup has strong timeframe alignment, but the planned stop-loss is below the overlapping ITF demand zone and the risk is substantial because of leverage. The ₹43,123 target should be treated as a price objective, not a guaranteed outcome. Position sizing and margin-call risk need to be considered independently.

Haftungsausschluss
Die Informationen und Veröffentlichungen sind nicht als Finanz-, Anlage-, Handels- oder andere Arten von Ratschlägen oder Empfehlungen gedacht, die von TradingView bereitgestellt oder gebilligt werden, und stellen diese nicht dar. Lesen Sie mehr in den Nutzungsbedingungen.
Haftungsausschluss
Die Informationen und Veröffentlichungen sind nicht als Finanz-, Anlage-, Handels- oder andere Arten von Ratschlägen oder Empfehlungen gedacht, die von TradingView bereitgestellt oder gebilligt werden, und stellen diese nicht dar. Lesen Sie mehr in den Nutzungsbedingungen.