
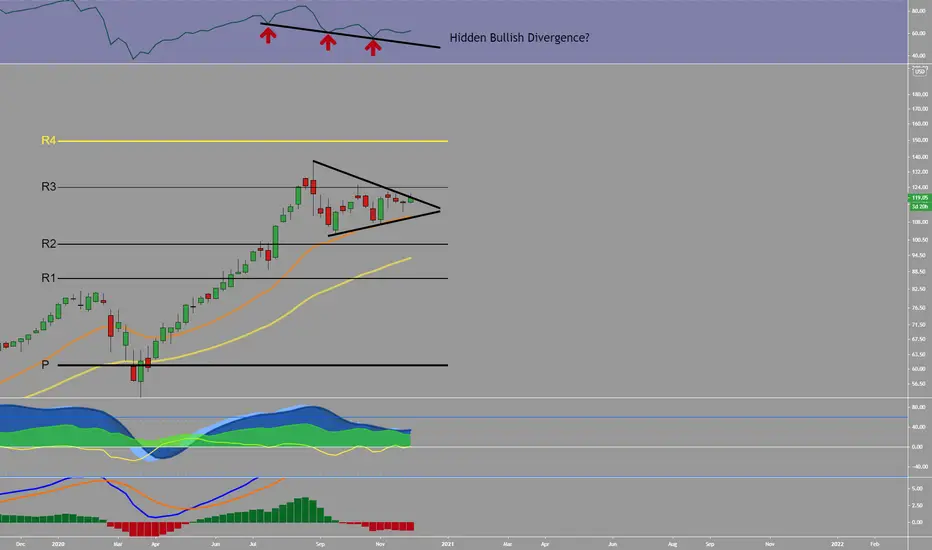
Lately, tech stocks have seen lots of sideways price action over the last few weeks. The Apple chart looks to have formed a symmetrical triangle on top of the weekly 21EMA with hidden bullish divergence on the RSI. A daily close above the $121 resistance level could trigger a move towards the $125 weekly resistance. A weekly close above $125 may push prices back to the $137 high or the R4 yearly pivot.
Anmerkung
Looks like the hidden bullish divergence is playing out, congrats to all who were on the train.
Haftungsausschluss
Die Informationen und Veröffentlichungen sind nicht als Finanz-, Anlage-, Handels- oder andere Arten von Ratschlägen oder Empfehlungen gedacht, die von TradingView bereitgestellt oder gebilligt werden, und stellen diese nicht dar. Lesen Sie mehr in den Nutzungsbedingungen.
Haftungsausschluss
Die Informationen und Veröffentlichungen sind nicht als Finanz-, Anlage-, Handels- oder andere Arten von Ratschlägen oder Empfehlungen gedacht, die von TradingView bereitgestellt oder gebilligt werden, und stellen diese nicht dar. Lesen Sie mehr in den Nutzungsbedingungen.