Long
Angold Resources (AAU): Potential for big upside
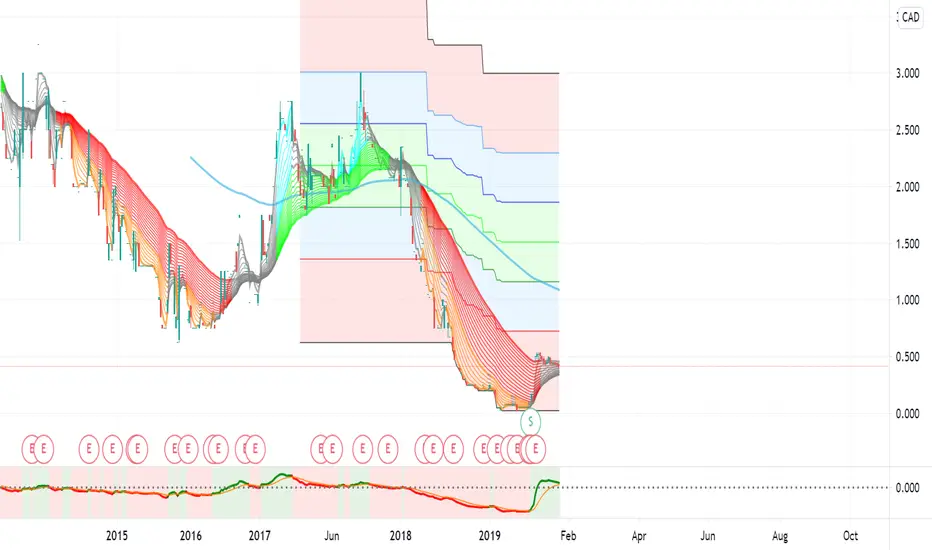
On the 1 day chart for Angold Resources you can see that my super guppy indicator has turned from Red/Orange to grey which indicates incoming volatility and a bounce in price. You can see that the fast EMA's are starting to converge and crossover with the slow EMA's which indicates a bullish reversal may be occurring. When looking at the 1 week chart we can also see a strong signal from our GMMA oscillator. In addition to this we are also starting to see the same convergence and crossover of our fast EMA's and slow EMA's on our 1 week chart that has formed on our 1 day chart. All this indicates a bullish reversal could be underway which would bring some really nice upside.

Haftungsausschluss
Die Informationen und Veröffentlichungen sind nicht als Finanz-, Anlage-, Handels- oder andere Arten von Ratschlägen oder Empfehlungen gedacht, die von TradingView bereitgestellt oder gebilligt werden, und stellen diese nicht dar. Lesen Sie mehr in den Nutzungsbedingungen.
Haftungsausschluss
Die Informationen und Veröffentlichungen sind nicht als Finanz-, Anlage-, Handels- oder andere Arten von Ratschlägen oder Empfehlungen gedacht, die von TradingView bereitgestellt oder gebilligt werden, und stellen diese nicht dar. Lesen Sie mehr in den Nutzungsbedingungen.