
-AAVE has been consolidating for nearly a month
-Price broke out of major resistance
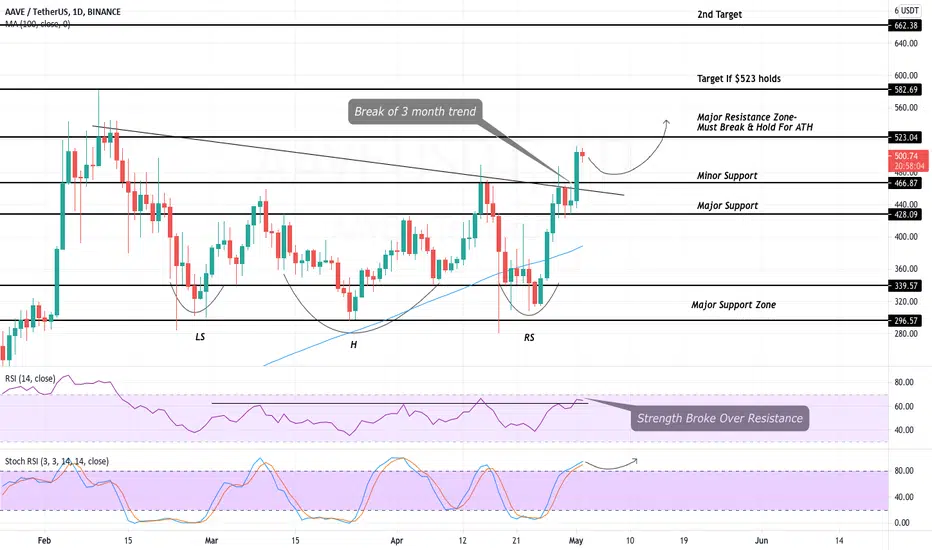
-Bullish inverse head & shoulders pattern
AAVE has been in a sideways slumber the last 3 months with very little price movement. The bulls have managed to break out of this trading range as Ethereum continues to make all time highs. After rising nearly 600% in 2021, the consolation was much needed.
AAVE breaking and holding the important S/R zone of $428 has set the price free for a potential breach of ATH. The price has also managed to break a three month top trend line that has been keeping the price printing lower highs. If AAVE continues to hold these two important levels we can expect prices to reach $525+.
AAVE has printed an inverse head and shoulders pattern on the daily chart. This chart has broke the neckline of $428. If AAVE cannot continue to hold his neckline, price is in danger of falling to the 100MA. If this level fails to hold, the support range can relied upon to produce a bounce.
While looking at the RSI, we can conclude the strength was stuck under a resistance line of around 62. The strength managed to break this key level and is attempting to hold it. This is a bullish signal for the AAVE price. The Stochastic RSI has risen to overbought levels, as long as this strength stays above the overbought line, AAVE is in a good bullish state for a try at ATH.
AAVE intraday levels
Spot rate: $500
Trend: Bullish
Volatility: High
Support: $466
Resistance: $523
-Price broke out of major resistance
-Bullish inverse head & shoulders pattern
AAVE has been in a sideways slumber the last 3 months with very little price movement. The bulls have managed to break out of this trading range as Ethereum continues to make all time highs. After rising nearly 600% in 2021, the consolation was much needed.
AAVE breaking and holding the important S/R zone of $428 has set the price free for a potential breach of ATH. The price has also managed to break a three month top trend line that has been keeping the price printing lower highs. If AAVE continues to hold these two important levels we can expect prices to reach $525+.
AAVE has printed an inverse head and shoulders pattern on the daily chart. This chart has broke the neckline of $428. If AAVE cannot continue to hold his neckline, price is in danger of falling to the 100MA. If this level fails to hold, the support range can relied upon to produce a bounce.
While looking at the RSI, we can conclude the strength was stuck under a resistance line of around 62. The strength managed to break this key level and is attempting to hold it. This is a bullish signal for the AAVE price. The Stochastic RSI has risen to overbought levels, as long as this strength stays above the overbought line, AAVE is in a good bullish state for a try at ATH.
AAVE intraday levels
Spot rate: $500
Trend: Bullish
Volatility: High
Support: $466
Resistance: $523

Haftungsausschluss
Die Informationen und Veröffentlichungen sind nicht als Finanz-, Anlage-, Handels- oder andere Arten von Ratschlägen oder Empfehlungen gedacht, die von TradingView bereitgestellt oder gebilligt werden, und stellen diese nicht dar. Lesen Sie mehr in den Nutzungsbedingungen.
Haftungsausschluss
Die Informationen und Veröffentlichungen sind nicht als Finanz-, Anlage-, Handels- oder andere Arten von Ratschlägen oder Empfehlungen gedacht, die von TradingView bereitgestellt oder gebilligt werden, und stellen diese nicht dar. Lesen Sie mehr in den Nutzungsbedingungen.