
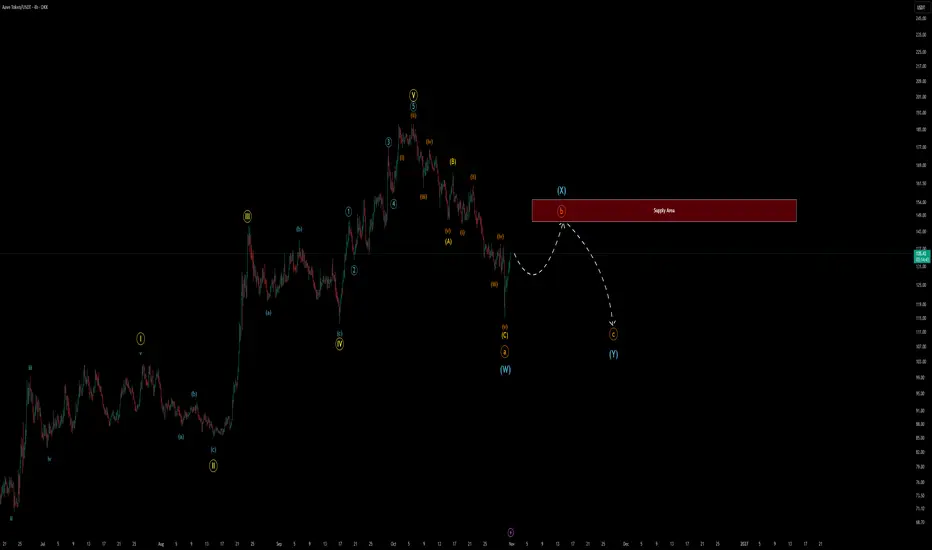
Before we begin, I need you to check the previous analysis so you can understand the structure.
I'm not going to go over it all again since I already shared all the technical details recently.
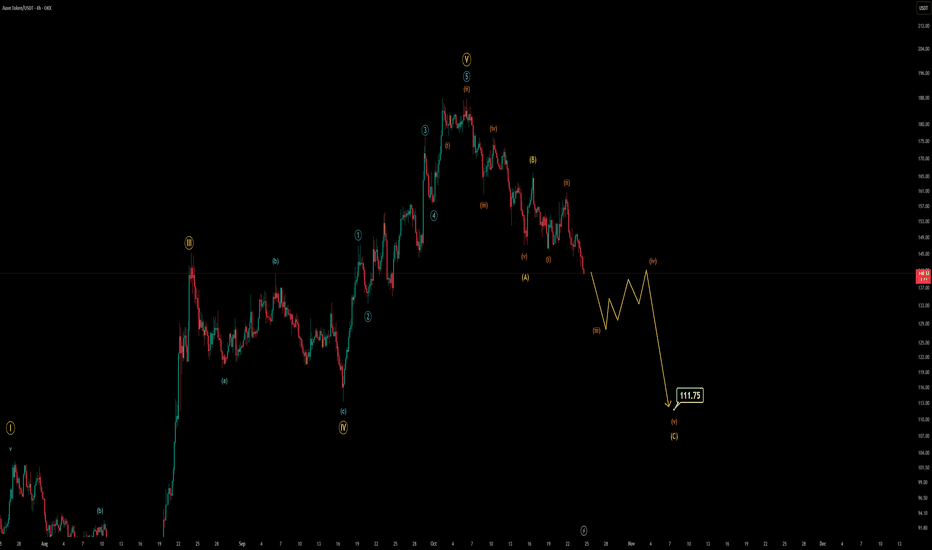
At the moment, what you see on the chart is a completed wave (C), which marks the end of a larger-degree wave A or W. This is where the problem starts: we don't know yet which exact type of correction we're going to see in the coming days. It might evolve into a complex W-X-Y structure, a Flat family variation, or simply a standard Zigzag.
Whatever comes next, it won't matter.
We're going UP.
Wave B (or X) will end around the supply box I drew for you on the chart, which sits right at the 50% - 61.8% Fibonacci retracement zone of the current wave A.
The bigger picture:
AAVE is currently developing its macro Wave 2 of a larger impulse on the weekly timeframe.
That's where the confusion starts. The current structure CANNOT be the entire Wave 2 because of strict NEoWave rules:
According to NEoWave's Law of Similarity and Balance (Time & Degree Proportionality), a corrective wave must take more time and build greater structural complexity than the smaller-degree corrections within the preceding impulse. If you look closely at the chart, the entire (A)-(B)-(C) drop took roughly the same or even less time than the internal sub wave (IV) alone. A macro Wave 2 correcting a full 5-wave cycle simply cannot finish faster than its own lower-degree sub-wave (IV). While the price target (liquidity sweep of wave IV) has been met, the TIME requirement is nowhere near complete. Therefore, this 5-3-5 drop is only the first leg (Wave A or W) of a much larger corrective structure designed to consume time before the macro trend resumes.
After this upcoming wave B (or X) relief rally hits our supply zone, we will see one final bloodbath to complete the macro correction. After that, the real war between bulls and bears will begin.
I'm not going to go over it all again since I already shared all the technical details recently.
At the moment, what you see on the chart is a completed wave (C), which marks the end of a larger-degree wave A or W. This is where the problem starts: we don't know yet which exact type of correction we're going to see in the coming days. It might evolve into a complex W-X-Y structure, a Flat family variation, or simply a standard Zigzag.
Whatever comes next, it won't matter.
We're going UP.
Wave B (or X) will end around the supply box I drew for you on the chart, which sits right at the 50% - 61.8% Fibonacci retracement zone of the current wave A.
The bigger picture:
AAVE is currently developing its macro Wave 2 of a larger impulse on the weekly timeframe.
That's where the confusion starts. The current structure CANNOT be the entire Wave 2 because of strict NEoWave rules:
According to NEoWave's Law of Similarity and Balance (Time & Degree Proportionality), a corrective wave must take more time and build greater structural complexity than the smaller-degree corrections within the preceding impulse. If you look closely at the chart, the entire (A)-(B)-(C) drop took roughly the same or even less time than the internal sub wave (IV) alone. A macro Wave 2 correcting a full 5-wave cycle simply cannot finish faster than its own lower-degree sub-wave (IV). While the price target (liquidity sweep of wave IV) has been met, the TIME requirement is nowhere near complete. Therefore, this 5-3-5 drop is only the first leg (Wave A or W) of a much larger corrective structure designed to consume time before the macro trend resumes.
After this upcoming wave B (or X) relief rally hits our supply zone, we will see one final bloodbath to complete the macro correction. After that, the real war between bulls and bears will begin.

Verbundene Veröffentlichungen
Haftungsausschluss
Die Informationen und Veröffentlichungen sind nicht als Finanz-, Anlage-, Handels- oder andere Arten von Ratschlägen oder Empfehlungen gedacht, die von TradingView bereitgestellt oder gebilligt werden, und stellen diese nicht dar. Lesen Sie mehr in den Nutzungsbedingungen.