
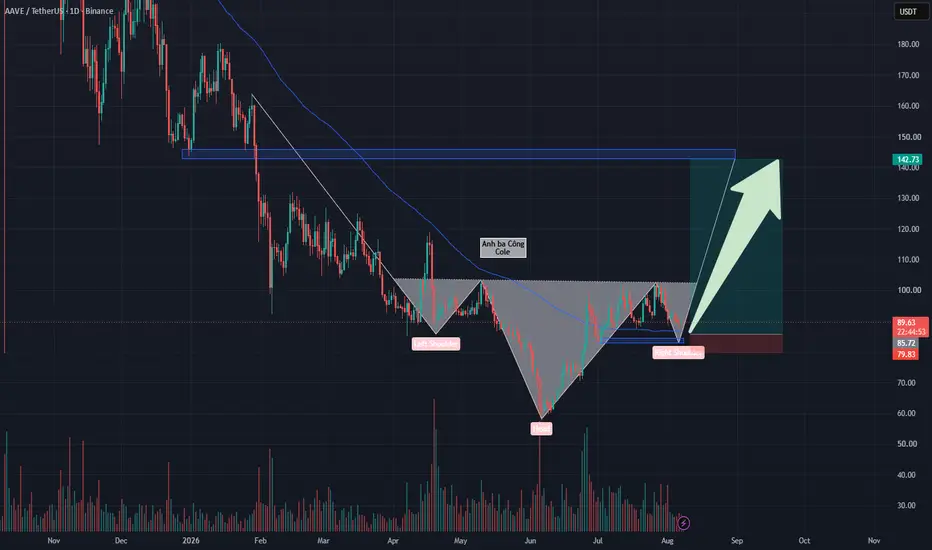
AAVE: Inverse Head & Shoulders Pattern Takes Shape – Dual Strategic Long Execution Framework
AAVE is flashing a clear trend reversal signal as it confirms a decisive bullish bounce off the dynamic MA100 trendline, completing the final structural component of a macro Inverse Head and Shoulders pattern. Following a prolonged decline from its August 2025 peak of $387 to its June 2026 bottom at $58, aggressive dip-buying liquidity propelled price action above the MA100 line to print a local high around the $100–$105 psychological resistance cluster, establishing a key neckline.
Based on the visual data from the daily chart , yesterday's session recorded a technical pullback retesting the dynamic MA100 line, followed by an immediate bullish bounce. This lower-wick rejection confirms that the Right Shoulder has officially formed on a strong base. Buy-side absorption around this support floor indicates that bulls are fully prepared for a massive expansion leg.
This technical framework presents two flexible Long execution strategies for traders:
Scenario 1: Proactively open an early Long entry at the Right Shoulder to optimize for a tight stop-loss placement just beneath local support.
Scenario 2: Patiently await a confirmed daily candle close decisively breaking above the $100–$105 neckline for maximum directional safety.
Disclaimer: This is not financial advice, DYOR.

Haftungsausschluss
Die Informationen und Veröffentlichungen sind nicht als Finanz-, Anlage-, Handels- oder andere Arten von Ratschlägen oder Empfehlungen gedacht, die von TradingView bereitgestellt oder gebilligt werden, und stellen diese nicht dar. Lesen Sie mehr in den Nutzungsbedingungen.
Haftungsausschluss
Die Informationen und Veröffentlichungen sind nicht als Finanz-, Anlage-, Handels- oder andere Arten von Ratschlägen oder Empfehlungen gedacht, die von TradingView bereitgestellt oder gebilligt werden, und stellen diese nicht dar. Lesen Sie mehr in den Nutzungsbedingungen.