
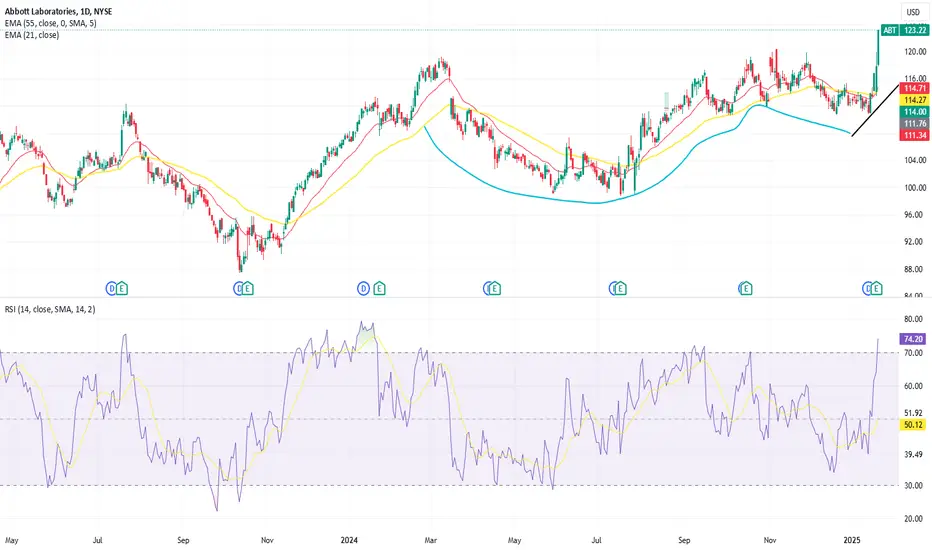
A little late posting this idea but I believe I identified a cup - and- handle pattern on the daily chart in ABT. I was able to enter the trade in the pull back of the 'handle' when volume was starting to dry up at $113.25. Prior to the formation of the pattern there was a ~29% run up on the stock. Playing this conservatively I am setting my price targets at 12% ($134.40) and 24% ($148.8) above the high of the pattern. Where I will sell half of my position at the first target and the second half at the second target. Initially my first Stop Loss is set just beneath the 'handle' at $106.99


Haftungsausschluss
Die Informationen und Veröffentlichungen sind nicht als Finanz-, Anlage-, Handels- oder andere Arten von Ratschlägen oder Empfehlungen gedacht, die von TradingView bereitgestellt oder gebilligt werden, und stellen diese nicht dar. Lesen Sie mehr in den Nutzungsbedingungen.
Haftungsausschluss
Die Informationen und Veröffentlichungen sind nicht als Finanz-, Anlage-, Handels- oder andere Arten von Ratschlägen oder Empfehlungen gedacht, die von TradingView bereitgestellt oder gebilligt werden, und stellen diese nicht dar. Lesen Sie mehr in den Nutzungsbedingungen.