
Hello Traders,
I am back for another AC technical analysis.
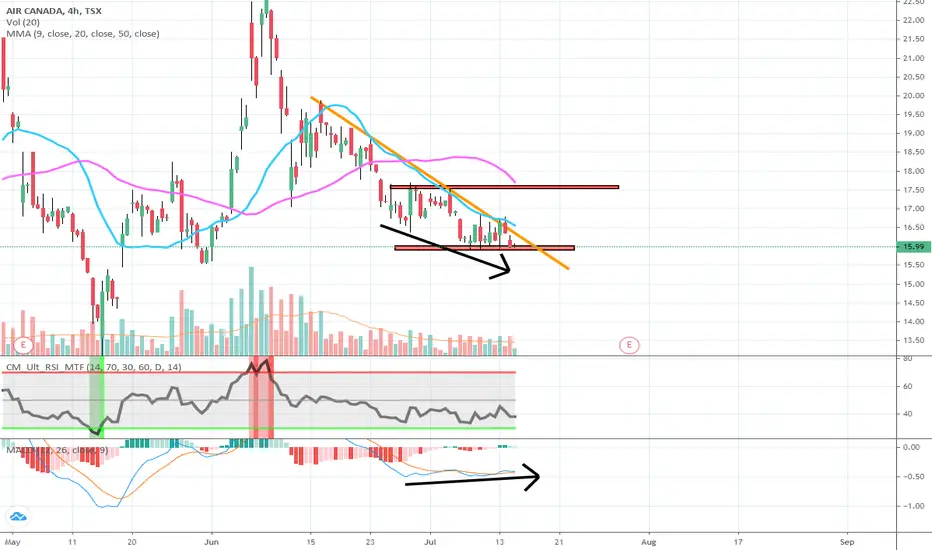
Looking at the 4 hour chart, we can see that AC has been in down-trend since June 20th high, as the price has been rejected multiple times at 4-hourly 20MA.
However, few bullish signals have emerged:
1) Bullish divergence in price and MACD
2) $15.90 has been tested multiple times and bears are failing to break this support
If AC breaks orange trend line with convincing volume, we can expect the price to hit $17.50 in short term.
Stop loss: $15.85
Happy trading.
I am back for another AC technical analysis.
Looking at the 4 hour chart, we can see that AC has been in down-trend since June 20th high, as the price has been rejected multiple times at 4-hourly 20MA.
However, few bullish signals have emerged:
1) Bullish divergence in price and MACD
2) $15.90 has been tested multiple times and bears are failing to break this support
If AC breaks orange trend line with convincing volume, we can expect the price to hit $17.50 in short term.
Stop loss: $15.85
Happy trading.
Anmerkung
And here it is strong bounce from $16 :)
Verbundene Veröffentlichungen
Haftungsausschluss
Die Informationen und Veröffentlichungen sind nicht als Finanz-, Anlage-, Handels- oder andere Arten von Ratschlägen oder Empfehlungen gedacht, die von TradingView bereitgestellt oder gebilligt werden, und stellen diese nicht dar. Lesen Sie mehr in den Nutzungsbedingungen.
Verbundene Veröffentlichungen
Haftungsausschluss
Die Informationen und Veröffentlichungen sind nicht als Finanz-, Anlage-, Handels- oder andere Arten von Ratschlägen oder Empfehlungen gedacht, die von TradingView bereitgestellt oder gebilligt werden, und stellen diese nicht dar. Lesen Sie mehr in den Nutzungsbedingungen.