
Hello?
Welcome, traders.
By "following", you can always get new information quickly.
Please also click "Boost".
Have a good day.
-------------------------------------
(ADAUSDT 1W chart)

The key is whether you can climb to the 0.5184-0.6834 section.
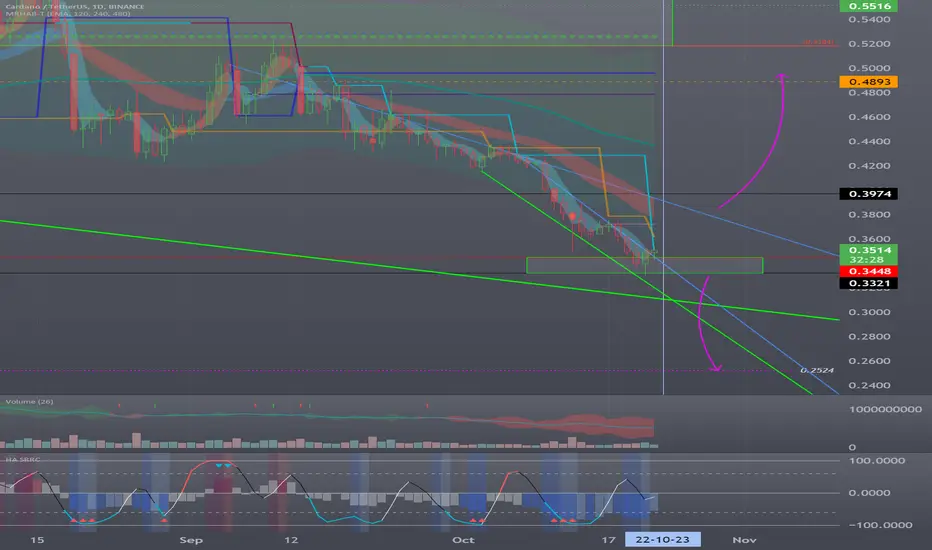
(1D chart)
1st resistance: 0.3974
2nd resistance: 0.4893
Support: 0.3321-0.3448
------------------------------------------------------------ -------------------------------------------
** All descriptions are for reference only and do not guarantee a profit or loss in investment.
** If you share this chart, you can use the indicators normally.
** The MRHAB-T indicator contains indicators that indicate support and resistance points.
** SR_R_C indicators are displayed as StochRSI(line), RSI(columns), CCI(bgcolor).
** CCI indicator is expressed as overbought range (CCI > +100) and oversold range (CCI < -100).
(Short-term Stop Loss can be said to be a point where profit and loss can be preserved or additional entry can be made through split trading. It is a short-term investment perspective.)
---------------------------------
Welcome, traders.
By "following", you can always get new information quickly.
Please also click "Boost".
Have a good day.
-------------------------------------
(ADAUSDT 1W chart)
The key is whether you can climb to the 0.5184-0.6834 section.
(1D chart)
1st resistance: 0.3974
2nd resistance: 0.4893
Support: 0.3321-0.3448
------------------------------------------------------------ -------------------------------------------
** All descriptions are for reference only and do not guarantee a profit or loss in investment.
** If you share this chart, you can use the indicators normally.
** The MRHAB-T indicator contains indicators that indicate support and resistance points.
** SR_R_C indicators are displayed as StochRSI(line), RSI(columns), CCI(bgcolor).
** CCI indicator is expressed as overbought range (CCI > +100) and oversold range (CCI < -100).
(Short-term Stop Loss can be said to be a point where profit and loss can be preserved or additional entry can be made through split trading. It is a short-term investment perspective.)
---------------------------------
Anmerkung
(ADABTC 1W chart)0.0000 1593 ~ 0.0000 The key is whether you can support and rise in the 1944 section.
Anmerkung
(ADA.D 1W chart)The key is whether it can move higher than 1.90-2.09.

[Practical trading strategy using HA-MS and SBOD]
youtu.be/aceN1AttX1Y
[Web Site]
readcrypto.kr
- Chart pattern analysis has been added.
youtu.be/aceN1AttX1Y
[Web Site]
readcrypto.kr
- Chart pattern analysis has been added.
Verbundene Veröffentlichungen
Haftungsausschluss
Die Informationen und Veröffentlichungen sind nicht als Finanz-, Anlage-, Handels- oder andere Arten von Ratschlägen oder Empfehlungen gedacht, die von TradingView bereitgestellt oder gebilligt werden, und stellen diese nicht dar. Lesen Sie mehr in den Nutzungsbedingungen.
[Practical trading strategy using HA-MS and SBOD]
youtu.be/aceN1AttX1Y
[Web Site]
readcrypto.kr
- Chart pattern analysis has been added.
youtu.be/aceN1AttX1Y
[Web Site]
readcrypto.kr
- Chart pattern analysis has been added.
Verbundene Veröffentlichungen
Haftungsausschluss
Die Informationen und Veröffentlichungen sind nicht als Finanz-, Anlage-, Handels- oder andere Arten von Ratschlägen oder Empfehlungen gedacht, die von TradingView bereitgestellt oder gebilligt werden, und stellen diese nicht dar. Lesen Sie mehr in den Nutzungsbedingungen.