
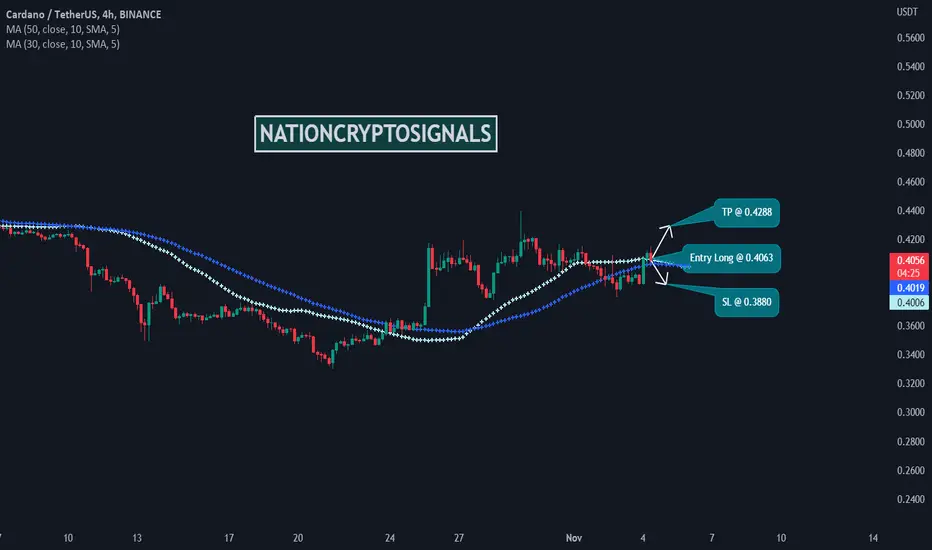
Time Frame: 4H
Symbol: ADAUSDT
Entry: 0.4063
TP: 0.4288
SL: 0.3880
Bias: Long
The study of dynamic support and resistance displays a narrow range and the price is oscillating between two extremes but the volatility factor is low. That is why we cannot expect a high potential trade from the current price context. Considering the price pattern we can expect some price move from support to resistance and resistance to support.

Haftungsausschluss
Die Informationen und Veröffentlichungen sind nicht als Finanz-, Anlage-, Handels- oder andere Arten von Ratschlägen oder Empfehlungen gedacht, die von TradingView bereitgestellt oder gebilligt werden, und stellen diese nicht dar. Lesen Sie mehr in den Nutzungsbedingungen.
Haftungsausschluss
Die Informationen und Veröffentlichungen sind nicht als Finanz-, Anlage-, Handels- oder andere Arten von Ratschlägen oder Empfehlungen gedacht, die von TradingView bereitgestellt oder gebilligt werden, und stellen diese nicht dar. Lesen Sie mehr in den Nutzungsbedingungen.