
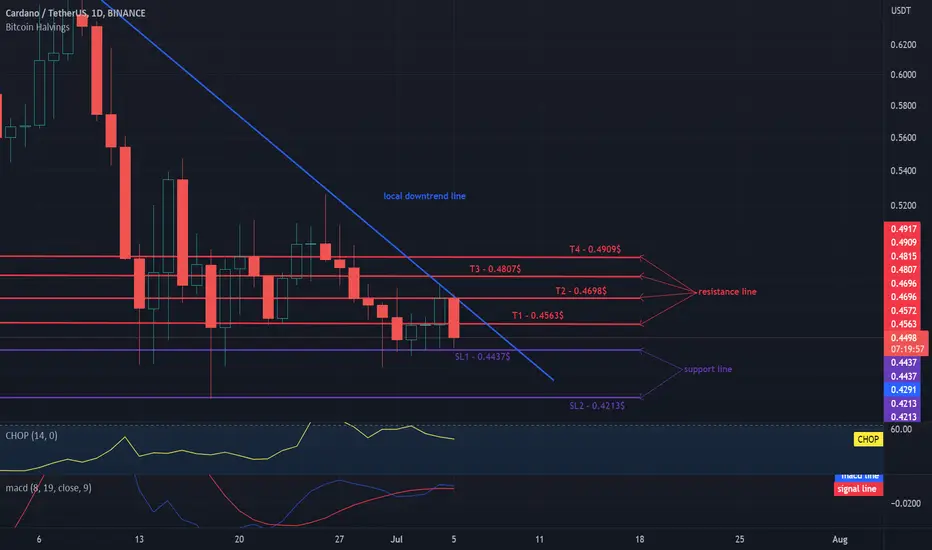
Hello everyone, let's take a look at the 1D ADA to USDT chart as you can see the price is moving below the local downtrend line.
Let's start by setting goals for the near future that we can consider:
T1 - $ 0.4563
T2 - $ 0.4698
T3 - $ 0.4807
and
T4 - $ 0.4909
Now let's move on to the stop loss in case of further market declines:
SL1 - $ 0.4437
and
SL2 - $ 0.4213
Looking at the CHOP indicator, we can see that in the 1D range we have a lot of energy and the MACD indicator shows that we can enter an upward trend locally.

Haftungsausschluss
Die Informationen und Veröffentlichungen sind nicht als Finanz-, Anlage-, Handels- oder andere Arten von Ratschlägen oder Empfehlungen gedacht, die von TradingView bereitgestellt oder gebilligt werden, und stellen diese nicht dar. Lesen Sie mehr in den Nutzungsbedingungen.
Haftungsausschluss
Die Informationen und Veröffentlichungen sind nicht als Finanz-, Anlage-, Handels- oder andere Arten von Ratschlägen oder Empfehlungen gedacht, die von TradingView bereitgestellt oder gebilligt werden, und stellen diese nicht dar. Lesen Sie mehr in den Nutzungsbedingungen.