Short
A Corrective Mess
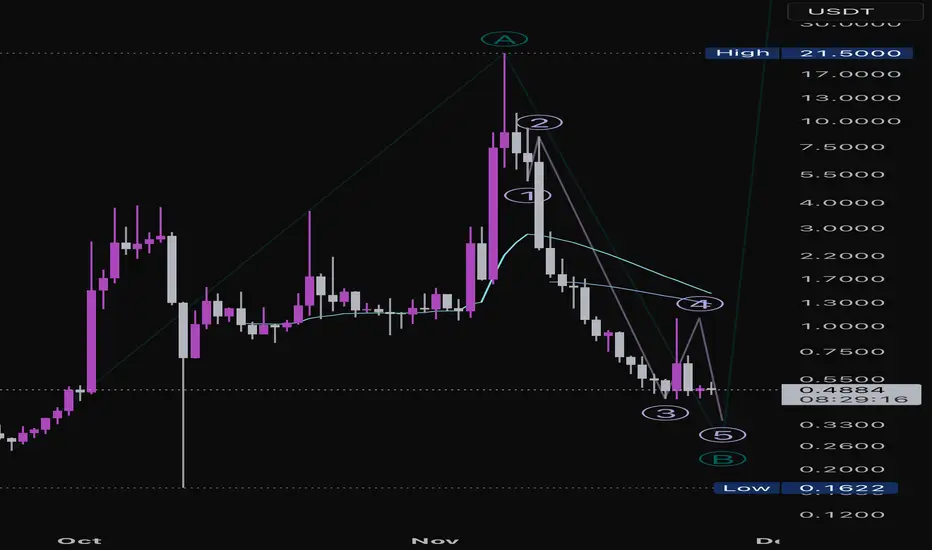
Hard to count this chart as anything but long-term bearish, but my best Elliot interpretation of AIA is that we could be in wave 4 of C of B to the downside. Very short term, we could see another [relatively] small rally to the 1.09-1.3ish area, but volume is low and further downside is expected with or without a C wave up. A break above the intraday high would be a first signal for a C wave, break below 0.439 for larger trend continuation.
Anmerkung
Clarification: very short-term possibility is Wave c of 4, not Wave C of larger ABC count. Standard Fibonacci extension targets if we do get a Wave c of 4 rally: 1.09-1.49
Haftungsausschluss
Die Informationen und Veröffentlichungen sind nicht als Finanz-, Anlage-, Handels- oder andere Arten von Ratschlägen oder Empfehlungen gedacht, die von TradingView bereitgestellt oder gebilligt werden, und stellen diese nicht dar. Lesen Sie mehr in den Nutzungsbedingungen.
Haftungsausschluss
Die Informationen und Veröffentlichungen sind nicht als Finanz-, Anlage-, Handels- oder andere Arten von Ratschlägen oder Empfehlungen gedacht, die von TradingView bereitgestellt oder gebilligt werden, und stellen diese nicht dar. Lesen Sie mehr in den Nutzungsbedingungen.