
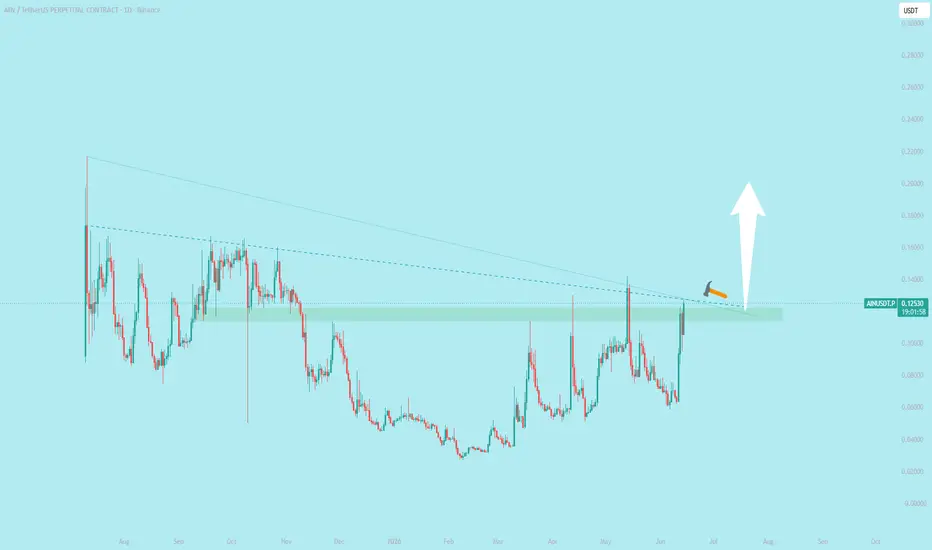
📊 Possible Patterns
- **Falling Wedge (Bullish Reversal)**
- The descending trendline combined with higher lows suggests a wedge formation.
- Price is pressing against the upper boundary, and a breakout above resistance would confirm the wedge pattern.
- Target projection: height of wedge added to breakout point → could push toward **0.14–0.15**.
- **Double Bottom (Reversal)**
- Around the **0.105–0.106** zone, price tested support twice before bouncing.
- This creates a potential double bottom structure, which is bullish if neckline (0.125–0.127) breaks.
- Measured move target: ~0.145.
- **Bullish Hammer Candlestick**
- The recent candle resembles a hammer at the trendline, signaling rejection of lower prices and possible reversal momentum.
---
⚠️ What to Watch
- **Confirmation:** Patterns only matter if confirmed by breakout and volume.
- **Neckline Break:** For the double bottom, a daily close above **0.127** is key.
- **Retest:** Often, price retests the breakout zone before continuing higher.
---
👉 In summary: The chart shows a **falling wedge** and a **double bottom** forming at support. Both are bullish reversal patterns, but confirmation requires a strong breakout above resistance with volume.

Haftungsausschluss
Die Informationen und Veröffentlichungen sind nicht als Finanz-, Anlage-, Handels- oder andere Arten von Ratschlägen oder Empfehlungen gedacht, die von TradingView bereitgestellt oder gebilligt werden, und stellen diese nicht dar. Lesen Sie mehr in den Nutzungsbedingungen.
Haftungsausschluss
Die Informationen und Veröffentlichungen sind nicht als Finanz-, Anlage-, Handels- oder andere Arten von Ratschlägen oder Empfehlungen gedacht, die von TradingView bereitgestellt oder gebilligt werden, und stellen diese nicht dar. Lesen Sie mehr in den Nutzungsbedingungen.