
🔮 #AI Analysis 💰💰
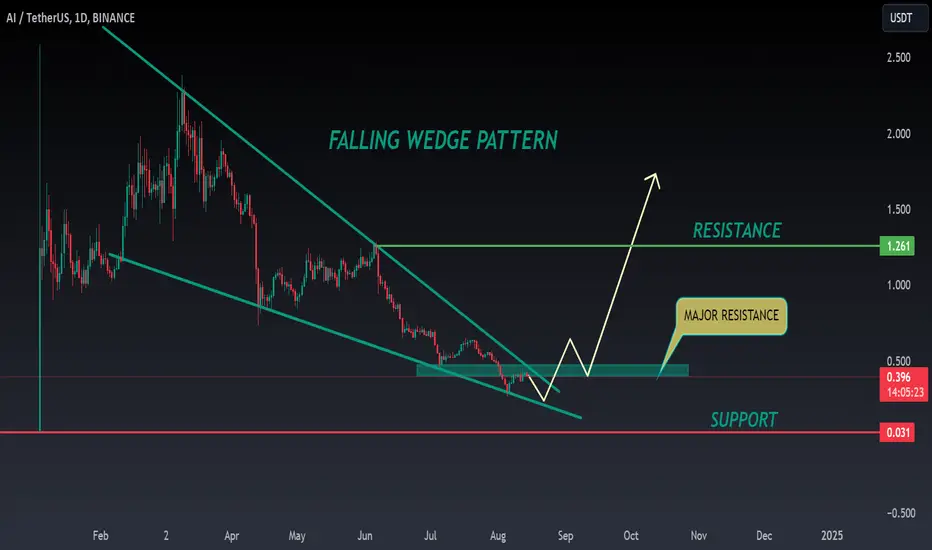
🌟🚀In daily chart we can see a formation "Falling Wedge Pattern" in #AI. Currently #AI is testing its major resistance level. If #AI breaks and holds this resistance then we will see a good bullish move.💲💲
🔖 Current Price: $0.397
⏳ Target Price: $1.260
⁉️ What to do?
- We have marked some crucial levels in the chart. We can trade according to the chart and make some profits in #AI. 🚀💸
#AI #Cryptocurrency #DYOR #PotentialBreakout
🌟🚀In daily chart we can see a formation "Falling Wedge Pattern" in #AI. Currently #AI is testing its major resistance level. If #AI breaks and holds this resistance then we will see a good bullish move.💲💲
🔖 Current Price: $0.397
⏳ Target Price: $1.260
⁉️ What to do?
- We have marked some crucial levels in the chart. We can trade according to the chart and make some profits in #AI. 🚀💸
#AI #Cryptocurrency #DYOR #PotentialBreakout

Verbundene Veröffentlichungen
Haftungsausschluss
Die Informationen und Veröffentlichungen sind nicht als Finanz-, Anlage-, Handels- oder andere Arten von Ratschlägen oder Empfehlungen gedacht, die von TradingView bereitgestellt oder gebilligt werden, und stellen diese nicht dar. Lesen Sie mehr in den Nutzungsbedingungen.
Verbundene Veröffentlichungen
Haftungsausschluss
Die Informationen und Veröffentlichungen sind nicht als Finanz-, Anlage-, Handels- oder andere Arten von Ratschlägen oder Empfehlungen gedacht, die von TradingView bereitgestellt oder gebilligt werden, und stellen diese nicht dar. Lesen Sie mehr in den Nutzungsbedingungen.