
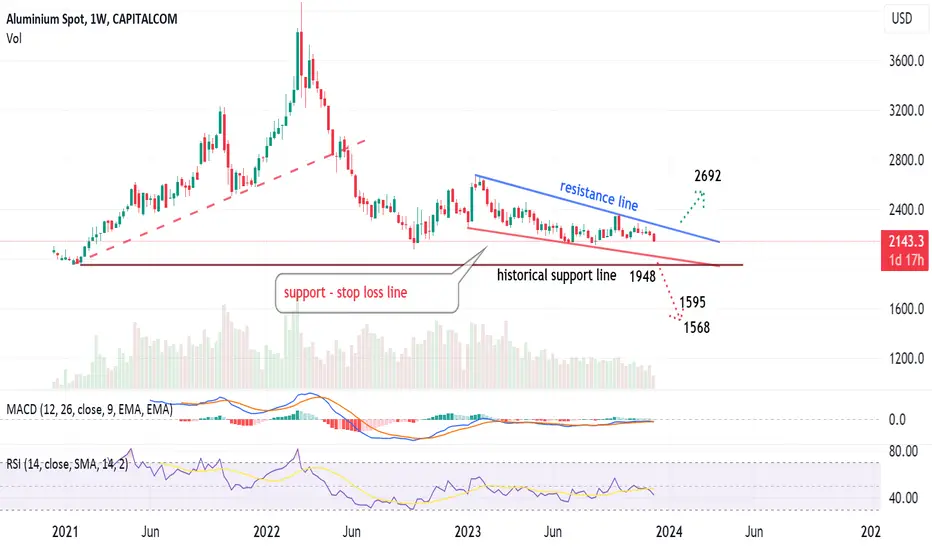
Weekly chart, Aluminum is showing negative indicators RSI and MACD. It seems the price is testing down the support line, then -may be- the historical support line.
Below that level, price can easily go to 1595 and 1568
Above resistance, the target is 2692
Below that level, price can easily go to 1595 and 1568
Above resistance, the target is 2692
Trade ist aktiv
Aluminium price crossed the resistance line upwards, and activated the target
Haftungsausschluss
Die Informationen und Veröffentlichungen sind nicht als Finanz-, Anlage-, Handels- oder andere Arten von Ratschlägen oder Empfehlungen gedacht, die von TradingView bereitgestellt oder gebilligt werden, und stellen diese nicht dar. Lesen Sie mehr in den Nutzungsbedingungen.
Haftungsausschluss
Die Informationen und Veröffentlichungen sind nicht als Finanz-, Anlage-, Handels- oder andere Arten von Ratschlägen oder Empfehlungen gedacht, die von TradingView bereitgestellt oder gebilligt werden, und stellen diese nicht dar. Lesen Sie mehr in den Nutzungsbedingungen.