
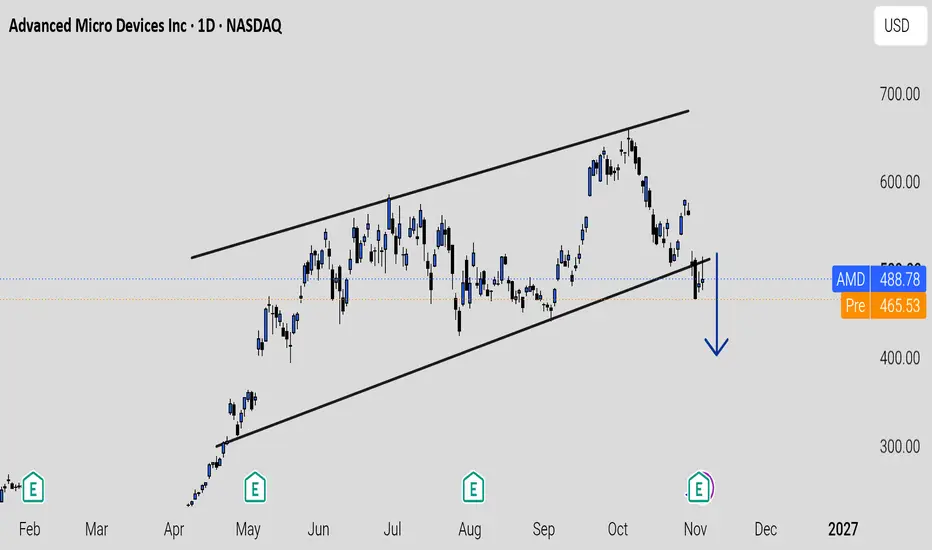
NASDAQ:AMD | 1D | Reference price: $488.78
AMD has been one of the stocks I've been watching closely as AI demand continues to grow.
Its latest earnings delivered impressive numbers, especially from the data-center business. However, something on my daily chart caught my attention: price is struggling around the lower boundary of its rising channel.
This creates an interesting situation. Strong fundamentals are supporting the long-term story, but the technical structure is showing some weakness.
What's driving AMD's momentum?
AMD reported record Q3 2026 revenue of $13.4 billion, representing 45% year-over-year growth.
A few numbers stood out to me:
- Data-center revenue reached $8.5 billion, up 97% year over year.
- Non-GAAP EPS came in at $2.09, up 74%.
- Q4 revenue guidance is approximately $17 billion.
- Demand for EPYC processors and Instinct GPUs continues to support its AI expansion.
These results show that AMD is gaining traction in the AI infrastructure market. The company is also expanding its Helios rack-scale systems to compete in a market where demand for computing power keeps growing.
But strong earnings don't automatically mean the stock must continue rising.
What I'm seeing on the daily chart
AMD has been trading inside a broad ascending channel since April.
After reaching the $650 area in October, price experienced a noticeable pullback and is now trading around $488.78.
The latest move has brought price below the channel's lower boundary, which is the part I'm watching most closely.
Here are the important areas on my radar:
- $480–$490: Current price region and immediate decision zone.
- $500–$510: Channel boundary and potential resistance on a recovery.
- $450: An intermediate downside area to monitor.
- $400: Major downside target shown in my chart projection.
- $550–$570: Recovery area if buyers regain control.
My bearish scenario
For now, I'm being cautious.
If AMD remains below the broken channel boundary and sellers maintain control, I could see price moving toward $450, with the $400 region becoming a deeper downside possibility.
The pre-market indication around $465.33 also makes the next session worth watching.
I wouldn't rush into a long position simply because the earnings were strong. I'd prefer to see price stabilize and reclaim the broken trendline first.
What could change my outlook?
If buyers push AMD back above $500–$510 and hold that area, the breakdown could turn into a failed move.
That would make me reconsider the bearish outlook and start watching the $550–$570 region as the next recovery area.
Until then, I think patience is more important than trying to predict the next big move.
My takeaway
AMD's AI growth story remains impressive, but the chart is reminding me that fundamentals and price action don't always move together.
I'm watching the $480–$490 area closely. A continued breakdown could open the door toward $400, while a successful reclaim of $500–$510 would improve the recovery outlook.
I also keep an eye on AI-related opportunities beyond public stocks. Bitget's IPO Prime has previously featured OpenAI and SpaceX, and its new Anthropic offering is another development I'm following. The earlier rounds had notable quoted price increases, although past performance doesn't guarantee future results.
Would you buy AMD after this pullback, or wait for the price to reclaim its rising channel first?
This is my personal market analysis, not financial advice. Price targets are possible scenarios, not guarantees. Always manage risk and do your own research.
AMD has been one of the stocks I've been watching closely as AI demand continues to grow.
Its latest earnings delivered impressive numbers, especially from the data-center business. However, something on my daily chart caught my attention: price is struggling around the lower boundary of its rising channel.
This creates an interesting situation. Strong fundamentals are supporting the long-term story, but the technical structure is showing some weakness.
What's driving AMD's momentum?
AMD reported record Q3 2026 revenue of $13.4 billion, representing 45% year-over-year growth.
A few numbers stood out to me:
- Data-center revenue reached $8.5 billion, up 97% year over year.
- Non-GAAP EPS came in at $2.09, up 74%.
- Q4 revenue guidance is approximately $17 billion.
- Demand for EPYC processors and Instinct GPUs continues to support its AI expansion.
These results show that AMD is gaining traction in the AI infrastructure market. The company is also expanding its Helios rack-scale systems to compete in a market where demand for computing power keeps growing.
But strong earnings don't automatically mean the stock must continue rising.
What I'm seeing on the daily chart
AMD has been trading inside a broad ascending channel since April.
After reaching the $650 area in October, price experienced a noticeable pullback and is now trading around $488.78.
The latest move has brought price below the channel's lower boundary, which is the part I'm watching most closely.
Here are the important areas on my radar:
- $480–$490: Current price region and immediate decision zone.
- $500–$510: Channel boundary and potential resistance on a recovery.
- $450: An intermediate downside area to monitor.
- $400: Major downside target shown in my chart projection.
- $550–$570: Recovery area if buyers regain control.
My bearish scenario
For now, I'm being cautious.
If AMD remains below the broken channel boundary and sellers maintain control, I could see price moving toward $450, with the $400 region becoming a deeper downside possibility.
The pre-market indication around $465.33 also makes the next session worth watching.
I wouldn't rush into a long position simply because the earnings were strong. I'd prefer to see price stabilize and reclaim the broken trendline first.
What could change my outlook?
If buyers push AMD back above $500–$510 and hold that area, the breakdown could turn into a failed move.
That would make me reconsider the bearish outlook and start watching the $550–$570 region as the next recovery area.
Until then, I think patience is more important than trying to predict the next big move.
My takeaway
AMD's AI growth story remains impressive, but the chart is reminding me that fundamentals and price action don't always move together.
I'm watching the $480–$490 area closely. A continued breakdown could open the door toward $400, while a successful reclaim of $500–$510 would improve the recovery outlook.
I also keep an eye on AI-related opportunities beyond public stocks. Bitget's IPO Prime has previously featured OpenAI and SpaceX, and its new Anthropic offering is another development I'm following. The earlier rounds had notable quoted price increases, although past performance doesn't guarantee future results.
Would you buy AMD after this pullback, or wait for the price to reclaim its rising channel first?
This is my personal market analysis, not financial advice. Price targets are possible scenarios, not guarantees. Always manage risk and do your own research.

Research the market. Trade with a plan. Respect the risk. 📊
Haftungsausschluss
Die Informationen und Veröffentlichungen sind nicht als Finanz-, Anlage-, Handels- oder andere Arten von Ratschlägen oder Empfehlungen gedacht, die von TradingView bereitgestellt oder gebilligt werden, und stellen diese nicht dar. Lesen Sie mehr in den Nutzungsbedingungen.
Research the market. Trade with a plan. Respect the risk. 📊
Haftungsausschluss
Die Informationen und Veröffentlichungen sind nicht als Finanz-, Anlage-, Handels- oder andere Arten von Ratschlägen oder Empfehlungen gedacht, die von TradingView bereitgestellt oder gebilligt werden, und stellen diese nicht dar. Lesen Sie mehr in den Nutzungsbedingungen.