
With the shift in interest rates by the FED, money tends to become more expensive, so the economic contraction knocks the door.
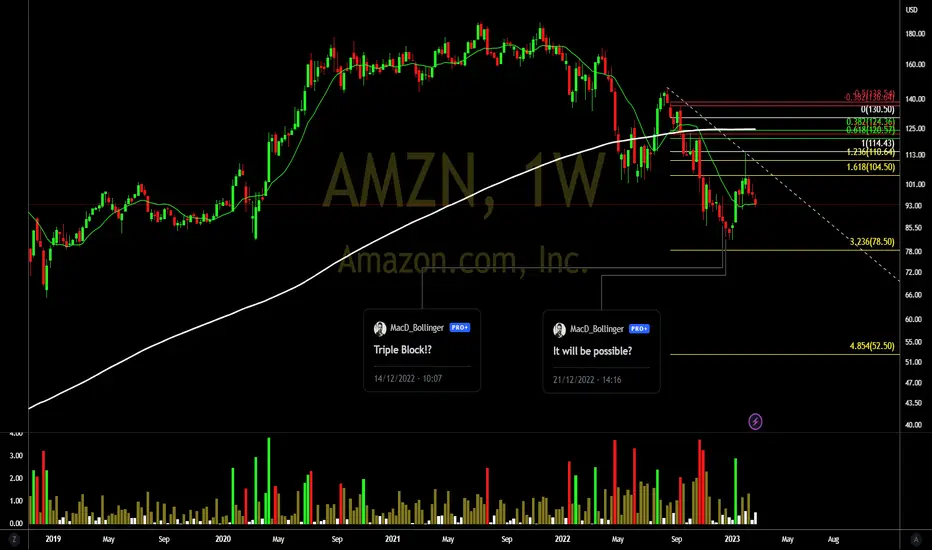
Graphically speaking and in the short term, the AMZN asset has great chances of reaching the previous bottom again in the region of $84.15 on the daily chart as the SETUP used informs!

-On the hourly chart, SETUP suggests that prices will seek the long average to fall again.

Are long-term investors looking for more discounts to buy the asset again?
Will $84.15 be right around the corner!?
-Do your analysis and good business.
-Be Aware, If You Buy, Use Stop!
-See below for other reviews!
Graphically speaking and in the short term, the AMZN asset has great chances of reaching the previous bottom again in the region of $84.15 on the daily chart as the SETUP used informs!
-On the hourly chart, SETUP suggests that prices will seek the long average to fall again.
Are long-term investors looking for more discounts to buy the asset again?
Will $84.15 be right around the corner!?
-Do your analysis and good business.
-Be Aware, If You Buy, Use Stop!
-See below for other reviews!

Verbundene Veröffentlichungen
Haftungsausschluss
Die Informationen und Veröffentlichungen sind nicht als Finanz-, Anlage-, Handels- oder andere Arten von Ratschlägen oder Empfehlungen gedacht, die von TradingView bereitgestellt oder gebilligt werden, und stellen diese nicht dar. Lesen Sie mehr in den Nutzungsbedingungen.