
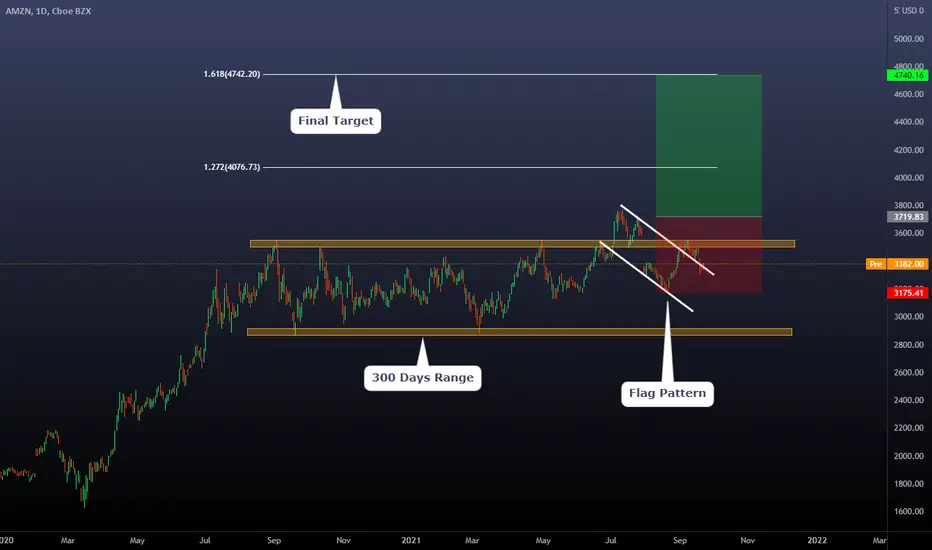
Today we will talk about the AMZN setup we have currently pending. Most of the time, we never have more than three setups executed at the same time. One of those is Amazon; after the breakout of the massive range, we observed a Flag Pattern on the edge of it, which is a sequence that has been repeated with different variations across the history of the asset.
Why is this relevant? Because our primary approach when executing any setup is: "Can I demonstrate that what I'm trying to trade right now have been proven to have a statistical advantage on the past? If the answer Is yes, we proceed. Based on our research, this setup represents a pattern with an excellent statistical edge overall.
Does it mean that the following setup will be a profitable one? Nobody knows; it's impossible to determine which "game" or "sequence" of the system will be a take profit or a stop loss. However, we know that after 15 or 30 setups with this quality, we can create a statistical advantage, or in other words, "Profits."
Returning to the chart, the strategy we are using here is pretty simple. We will execute our setup above "B," or the inner local resistance of the flag pattern. Stop loss will be below the structure. Take Profit will be on the fibo extension of the previous impulse ( MAR 2020 - SEP 2020)
Risk: We will be taking a maximum loss of 1.5% of our trading capital.
A movement like this can take between 100 to 150 days. (Be patient)
Thanks for reading!
Why is this relevant? Because our primary approach when executing any setup is: "Can I demonstrate that what I'm trying to trade right now have been proven to have a statistical advantage on the past? If the answer Is yes, we proceed. Based on our research, this setup represents a pattern with an excellent statistical edge overall.
Does it mean that the following setup will be a profitable one? Nobody knows; it's impossible to determine which "game" or "sequence" of the system will be a take profit or a stop loss. However, we know that after 15 or 30 setups with this quality, we can create a statistical advantage, or in other words, "Profits."
Returning to the chart, the strategy we are using here is pretty simple. We will execute our setup above "B," or the inner local resistance of the flag pattern. Stop loss will be below the structure. Take Profit will be on the fibo extension of the previous impulse ( MAR 2020 - SEP 2020)
Risk: We will be taking a maximum loss of 1.5% of our trading capital.
A movement like this can take between 100 to 150 days. (Be patient)
Thanks for reading!

Haftungsausschluss
Die Informationen und Veröffentlichungen sind nicht als Finanz-, Anlage-, Handels- oder andere Arten von Ratschlägen oder Empfehlungen gedacht, die von TradingView bereitgestellt oder gebilligt werden, und stellen diese nicht dar. Lesen Sie mehr in den Nutzungsbedingungen.
Haftungsausschluss
Die Informationen und Veröffentlichungen sind nicht als Finanz-, Anlage-, Handels- oder andere Arten von Ratschlägen oder Empfehlungen gedacht, die von TradingView bereitgestellt oder gebilligt werden, und stellen diese nicht dar. Lesen Sie mehr in den Nutzungsbedingungen.