
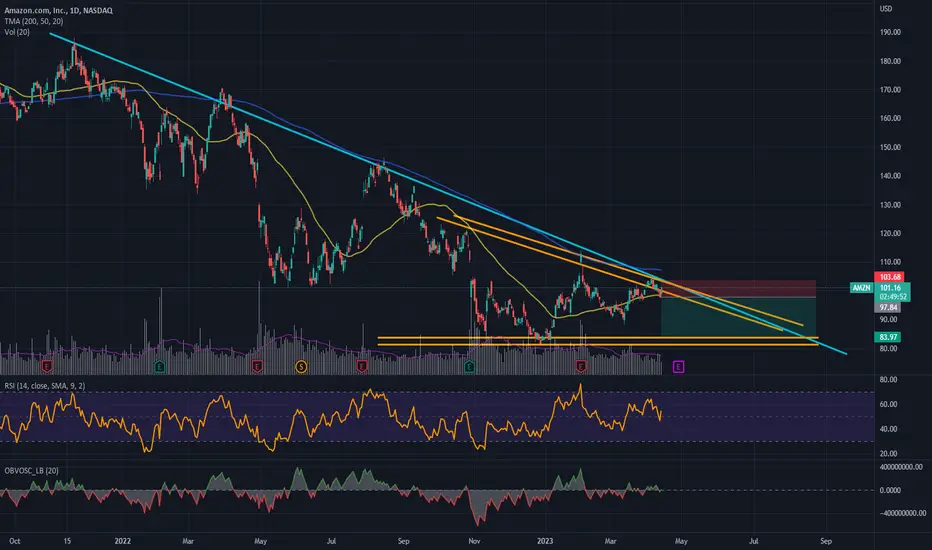
- Price below the 200 MA, confirming the general downtrend.
- Possible formation of descending triangle.
- Demand for the asset is weakening (see volume, RSI and OBV indicators).
When the price cuts below the 50 MA, the RSI is well below 50% and the OBV is red and well below the mid level, enter short. I prefer to enter my positions with confirmations of indicators, rather formations of patterns.
WARNING: THIS IS NOT A INVESTMENT ADVICE. I'M JUST POSTING MY IDEAS AND IT IS FOR EXCHANGE OPINIONS.

Haftungsausschluss
Die Informationen und Veröffentlichungen sind nicht als Finanz-, Anlage-, Handels- oder andere Arten von Ratschlägen oder Empfehlungen gedacht, die von TradingView bereitgestellt oder gebilligt werden, und stellen diese nicht dar. Lesen Sie mehr in den Nutzungsbedingungen.
Haftungsausschluss
Die Informationen und Veröffentlichungen sind nicht als Finanz-, Anlage-, Handels- oder andere Arten von Ratschlägen oder Empfehlungen gedacht, die von TradingView bereitgestellt oder gebilligt werden, und stellen diese nicht dar. Lesen Sie mehr in den Nutzungsbedingungen.