
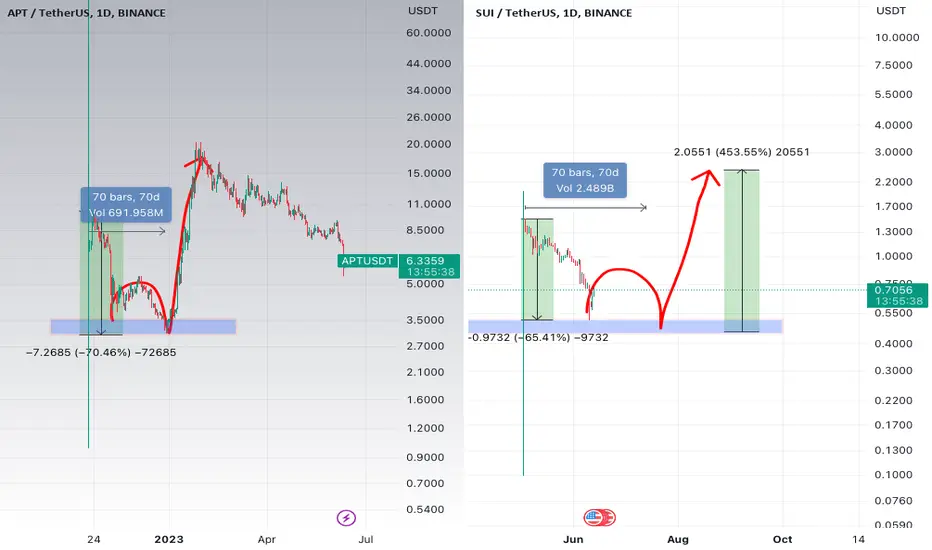
Friends, hello everyone! I noticed an interesting similarity between two assets - SUI and Atop. After the decline, both assets experienced approximately a 70% loss. However, if we look at APT, we can observe an intriguing pattern - it showed a decline, followed by a minor correction, a final impulse (where the best entry point was), and a 400% increase.
Now, as SUI has undergone a decline, we are observing a slight correction, after which we expect a final impulse and further growth.
It's fascinating to see what will happen with these assets going forward! Let's keep an eye out for updates.
Now, as SUI has undergone a decline, we are observing a slight correction, after which we expect a final impulse and further growth.
It's fascinating to see what will happen with these assets going forward! Let's keep an eye out for updates.

Copy my strategy - copy.mytimebox.app/
TG ENG - t.me/+B_BEn6COneo2ZTBi
TG - t.me/+LTNPinehDNlkZTQy
TG ENG - t.me/+B_BEn6COneo2ZTBi
TG - t.me/+LTNPinehDNlkZTQy
Haftungsausschluss
Die Informationen und Veröffentlichungen sind nicht als Finanz-, Anlage-, Handels- oder andere Arten von Ratschlägen oder Empfehlungen gedacht, die von TradingView bereitgestellt oder gebilligt werden, und stellen diese nicht dar. Lesen Sie mehr in den Nutzungsbedingungen.
Copy my strategy - copy.mytimebox.app/
TG ENG - t.me/+B_BEn6COneo2ZTBi
TG - t.me/+LTNPinehDNlkZTQy
TG ENG - t.me/+B_BEn6COneo2ZTBi
TG - t.me/+LTNPinehDNlkZTQy
Haftungsausschluss
Die Informationen und Veröffentlichungen sind nicht als Finanz-, Anlage-, Handels- oder andere Arten von Ratschlägen oder Empfehlungen gedacht, die von TradingView bereitgestellt oder gebilligt werden, und stellen diese nicht dar. Lesen Sie mehr in den Nutzungsbedingungen.