
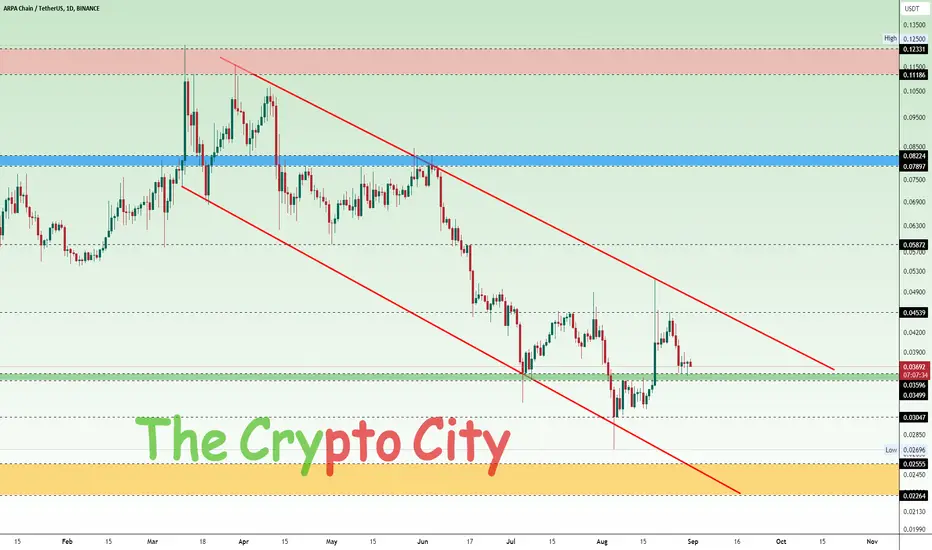
The ARPA is currently in a well-defined downtrend, as indicated by the descending channel that has been guiding the price downward since early March. Currently, the price is consolidating on the support zone (Green) at $0.03499 - $0.03596, after a pull back from the $0.04539 level.
If the price breaks below this support zone (Green) at $0.03499 - $0.03596, it could potentially decline further, testing the next support level at $0.03047 and possibly moving down to the historical low support zone (Yellow) at $0.02264 - $0.02555. On the other hand, if the price manages to break above the resistance at $0.04539 and breach the descending channel's upper boundary, it may indicate the beginning of a bullish reversal. However, the overall trend remains bearish, and any upward move would need to be sustained by a significant increase in volume to confirm a true breakout.
Overall, the market is at a crucial juncture where it could either continue its downward trajectory or attempt a reversal. Traders should closely monitor the key support and resistance levels and watch for changes in volume to gauge the potential direction of the next move.
Trade ist aktiv
ARPA is on support zone (Green) at $0.03499 - $0.03596
Haftungsausschluss
Die Informationen und Veröffentlichungen sind nicht als Finanz-, Anlage-, Handels- oder andere Arten von Ratschlägen oder Empfehlungen gedacht, die von TradingView bereitgestellt oder gebilligt werden, und stellen diese nicht dar. Lesen Sie mehr in den Nutzungsbedingungen.
Haftungsausschluss
Die Informationen und Veröffentlichungen sind nicht als Finanz-, Anlage-, Handels- oder andere Arten von Ratschlägen oder Empfehlungen gedacht, die von TradingView bereitgestellt oder gebilligt werden, und stellen diese nicht dar. Lesen Sie mehr in den Nutzungsbedingungen.